4QFY2018 Result Update | Cable
May 7, 2018
Matrimony.com Ltd
BUY
CMP
`850
Performance Update
Target Price
`1,016
Y/E March (` cr)
4QFY18
4QFY17
% yoy
3QFY18
% qoq
Investment Period
12 month
Net sales
84
75
12
84
1
Sector
Internet Services
EBITDA
20
11
78
17
15
Market Cap (Rs cr)
1,910
EBITDA margin (%)
23.6
14.8
878bp
20.8
280bp
Net Debt
(167)
Adjusted PAT
17
13
26
13
29
Beta
0.3
Source: Company, Angel Research
52 Week High / Low
1025/703
Avg. Daily Volume
36,577
For 4QFY2018, Matrimony.com Ltd (MCL) posted results in-line with our
Face Value (Rs)
10
expectations on both top-line as well as bottom-line fronts. Consolidated revenues
BSE Sensex
35,025
grew by ~12% yoy and operating margins were also higher yoy. On the bottom-
Nifty
10,653
Reuters Code
NA
line front, MCL reported growth of ~26% yoy to `17cr on the back of strong top-
Bloomberg Code
MATRIM.IN
line growth and operating performance.
Top-line driven by healthy volume growth: The company’s top-line grew by ~12%
Shareholding Pattern (%)
yoy to `84cr on the back of healthy growth in volumes and price hike. In the
Promoters
50.6
Matchmaking Services segment the company reported ~14% growth yoy and in
MF / Banks / Indian Fls
24.1
FII / NRIs / OCBs
22.4
Marriage Services segment the company reported ~20% de-growth yoy.
Indian Public / Others
2.9
Healthy revenues and strong operating performance aided overall profitability: On
the operating front, the company’s margin improved by 878bps yoy on the back of
Abs. (%)
3m 1yr
3yr
strong growth in Matchmaking Services, which is a higher margin business. The
Sensex
0.5
15.9
27.0
company reported ~26% yoy rise in its net profit to `17cr on the back of healthy
MCL
(3.9)
NA
NA
revenue growth and operating margin improvement.
Outlook and Valuation: We expect MCL to report net revenue CAGR of ~15% to
~`450cr over FY2018-20E mainly due to strong growth in online matchmaking
and marriage related services coupled by its strong brand recall and large user
database. On the bottom-line front, we expect CAGR of ~15% to `83cr over the
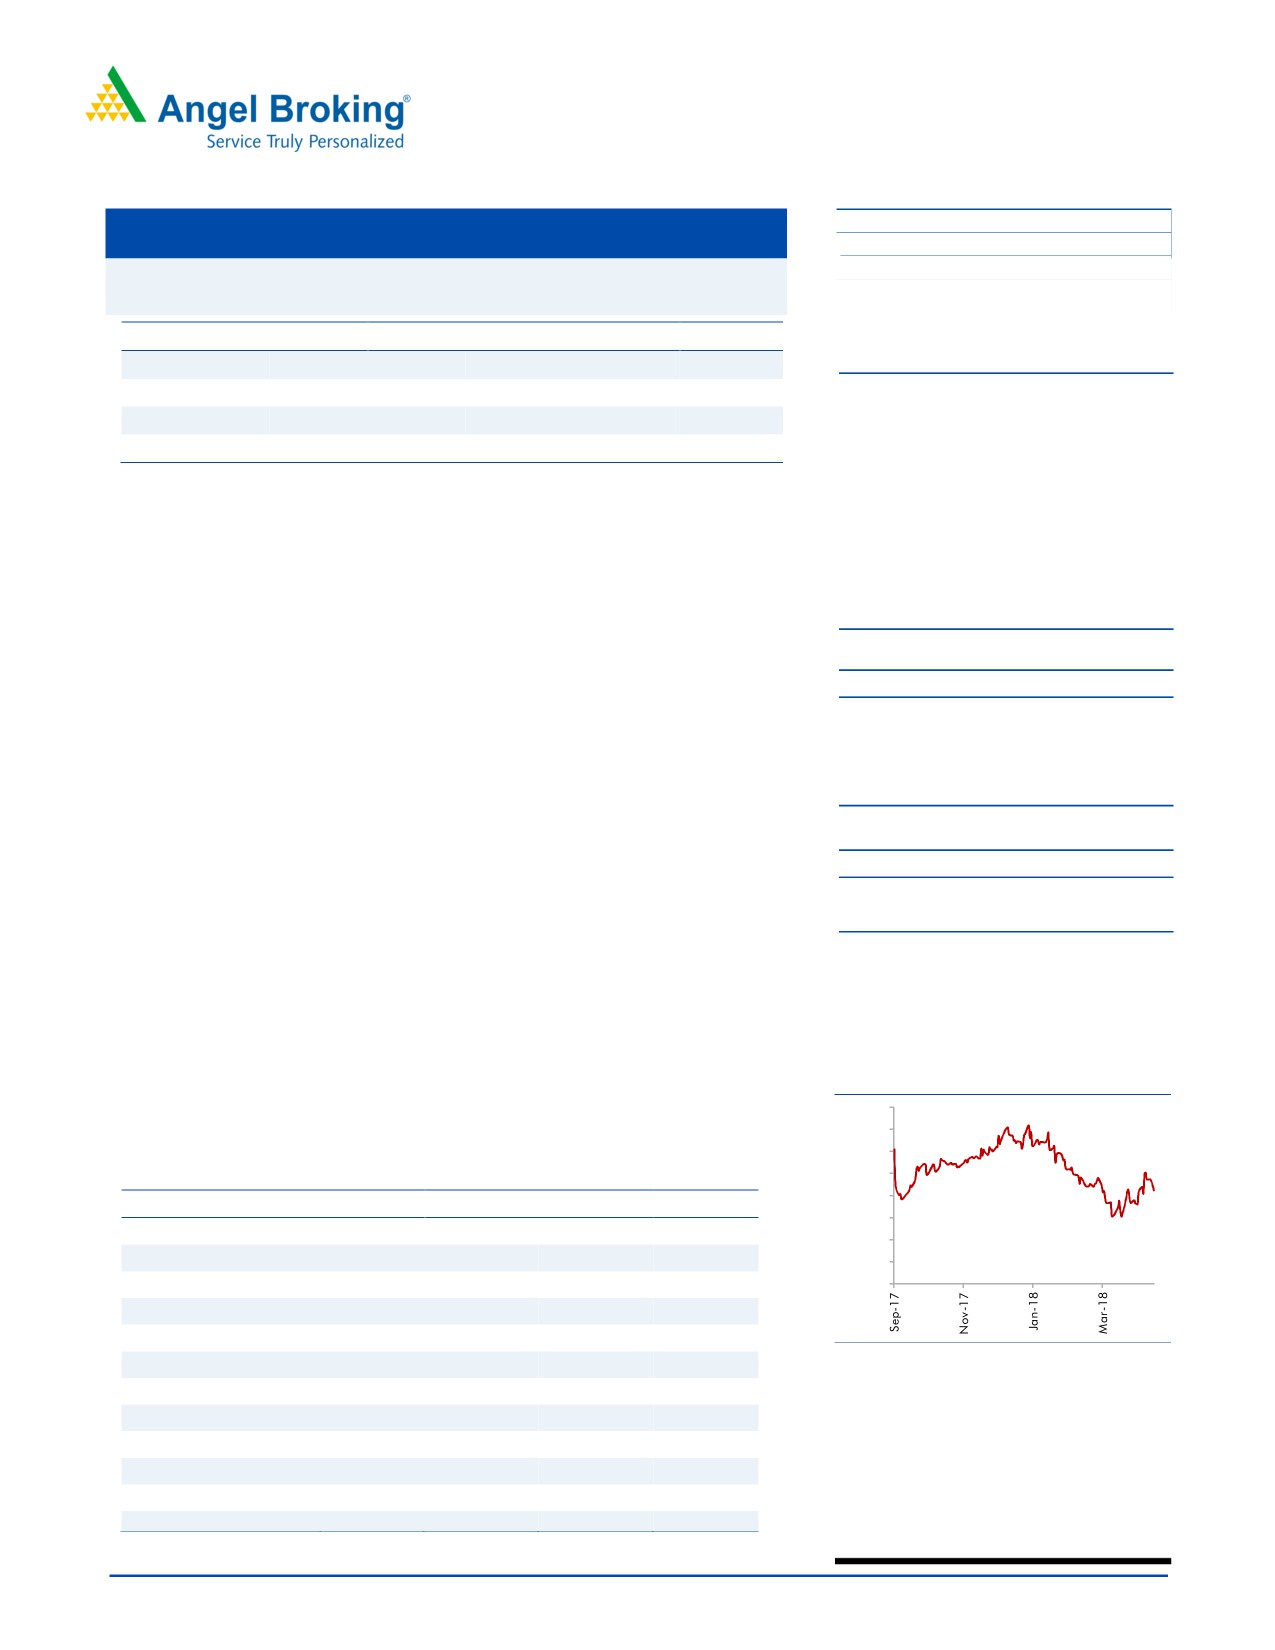
Historical share price chart
same period on the back of margin improvement. We maintain our BUY rating on
1,000
950
the stock with target price of `1,016.
900
850
Key Financials
800
Y/E March (` cr)
FY2017
FY2018E
FY2019E FY2020E
750
Net sales
293
335
388
450
700
% chg
14.9
14.6
15.5
16.0
650
Adj. Net profit
48
63
70
83
600
% chg
-
30.8
11.2
18.0
EBITDA margin (%)
18.7
23.1
24.6
25.3
EPS (`)
21.3
27.9
31.0
36.6
Source: Company, Angel Research
P/E (x)
39.9
30.5
27.4
23.3
Amarjeet S Maurya
P/BV (x)
-
11.9
8.3
6.1
022-40003600 Ext: 6831
RoE (%)
-
38.9
30.2
26.3
RoCE (%)
330.8
40.4
35.0
30.8
EV/Sales (x)
6.5
5.2
4.5
3.7
EV/EBITDA (x)
34.9
22.6
18.3
14.8
Source: Company, Angel Research Note: CMP as of May 04, 2018
Please refer to important disclosures at the end of this report
1
Matrimony.com Ltd | 4QFY2018 Result Update
Exhibit 1: 4QFY2018 Performance
Y/E March (` cr)
4QFY18
4QFY17
% yoy
3QFY18
% qoq
FY2018
FY2017
% chg
Net Sales
84
75
11.9
84
0.8
335
293
14.6
Staff Costs
34
29
17.3
34
(0.2)
133
116
14.2
(% of Sales)
40.2
38.4
40.6
39.6
39.8
Selling & Adm Expenses
15
14
3.9
15
(1.0)
56
52
7.3
(% of Sales)
17.2
18.6
17.5
16.7
17.8
Other Expenses
16
21
(25.0)
18
(9.3)
69
70
(1.1)
(% of Sales)
18.9
28.3
21.1
20.6
23.8
Total Expenditure
64
64
0.3
66
(2.8)
258
238
8.2
Operating Profit
20
11
78.1
17
14.6
78
54
42.4
OPM
23.6
14.8
20.8
23.1
18.6
Interest
0.0
1.1
(98.1)
0.1
(81.8)
1.5
6
(72.6)
Depreciation
2.2
2.4
(7.8)
2.5
(11.5)
9.6
10
(7.8)
Other Income
2
1
15
19.3
4
PBT (excl. Ext Items)
20
9
126.3
30
(32.4)
86
43
99.5
Ext (Income)/Expense
PBT (incl. Ext Items)
20
9
126.3
30
(32.4)
86
43
99.5
(% of Sales)
23.6
11.7
35.3
25.6
14.7
Provision for Taxation
3
-
7
12
0
(% of PBT)
15.7
-
22.1
13.9
0.0
Reported PAT
17
9
90.8
23
(26.9)
74
43
71.9
PATM
19.9
11.7
27.5
22.0
14.7
Minority Interest After NP
(4.5)
10.0
10.9
(4.2)
Extra-ordinary Items
Adj. PAT
17
13
26.3
13
29.3
63
47
33.4
Source: Company, Angel Research
May 7, 2018
2
Matrimony.com Ltd | 4QFY2018 Result Update
Key investment arguments
Huge untapped market opportunity: Unmarried population in CY2016 was 107mn,
out of which active seekers were 63mn. However, active users of the online
matrimony segment were only 6mn in CY2016, according to KPMG report.
Currently, MCL has 3.08mn active profiles on Matrimony.com. Hence, there is a
huge untapped market opportunity for the company.
Leading provider of online matchmaking services in India: According to the
comScore Report for June
2017, Matrimony.com is the leader for online
matchmaking services in India in terms of the average number of website pages
viewed by unique visitors, time spent and total pages viewed mainly due to the
company’s large database of profiles.
Strong consumer brand recall: Matrimony.com has high degree of brand recall and
trust in India, as evidenced by the average number of website pages viewed by
unique visitors in June 2017 (comScore Report). BharatMatrimony.com has been
ranked as India’s most trusted online matrimony brand by The Brand Trust Report
India Study 2014. MCL spends 17-18% (% of sales) on ad spends every year.
Foray into marriage services: MCL’s key strategy for driving monetization is to
increase the length of relationship with customers and increase the amount of
revenue earned from customers by offering additional wedding related services such
as photography & videography, wedding apparel, venue, stage decorations, make-
up, catering and honeymoon packages from various vendors to meet customers’
wedding needs.
Outlook & Valuation: We expect MCL to report net revenue CAGR of ~15% to
~`450cr over FY2018-20E mainly due to strong growth in online matchmaking and
marriage related services coupled by its strong brand recall and large user
database. On the bottom-line front, we expect CAGR of ~15% to `83cr over the
same period on the back of margin improvement (due to strong operating leverage
& reduction in losses of marriage service business). We maintain our BUY rating on
the stock with target price of `1,016.
May 7, 2018
3
Matrimony.com Ltd | 4QFY2018 Result Update
Downside risks to our estimates
Any increase in competition from online and offline companies could impact
MCL’s earnings.
If MCL is unable to keep pace with changing technology, evolving industry
standards and does not develop new products for business, its profitability could
be impacted.
The company is dependent on telecommunications and information technology
systems, networks and infrastructure to operate its business. Any interruption or
breakdown in such systems, networks or infrastructure or its technical systems
could impair MCL’s products and services.
Company Background
Incorporated in 2001, Matrimony.com is engaged in providing online matchmaking
and marriage services. They offer their services through Internet and mobile
platforms in India and internationally. MCL is one of the first companies to provide
online matchmaking services in India, having database comprising of 3.08 million
active profiles (being profiles that have been published or logged in at least once
during the prior 180 day period). They offer a range of targeted and customized
products and services that are tailored to meet the specific requirements of customers
based on their religious or caste preferences or other criteria such as marital status
and age bracket. Currently, they have 140 retail centers distributed across India
where customers can walk in and register on their websites. Its flagship brand,
BharatMatrimony, has 15 language based domains under its umbrella. They also
have other portals like EliteMatrimony, CommunityMatrimony, MatrimonyDirectory,
MatrimonyPhotography,
MatrimonyBazaar,
MatrimonyDirectory
and
MatrimonyMandaps.
May 7, 2018
4
Matrimony.com Ltd | 4QFY2018 Result Update
Consolidated Profit & Loss Statement
Y/E March (` cr)
FY2016
FY2017
FY2018
FY2019E
FY2020E
Total operating income
255
293
335
388
450
% chg
5.6
14.9
14.6
15.5
16.0
Total Expenditure
322
238
258
292
336
Employee
125
117
133
147
171
Selling & Administrative Expenses
54
52
56
59
65
Others Expenses
143
69
69
86
100
EBITDA
(67)
55
78
95
114
% chg
41.8
22.9
19.3
(% of Net Sales)
(26.4)
18.7
23.1
24.6
25.3
Depreciation& Amortisation
10
10
10
12
15
EBIT
(77)
44
68
83
99
% chg
53.4
22.8
18.3
(% of Net Sales)
(30.2)
15.1
20.3
21.5
22.0
Interest & other Charges
3
4
2
1
1
Other Income
5
4
19
5
5
(% of PBT)
(6.4)
8.9
22.5
5.7
4.8
Share in profit of Associates
-
-
-
-
-
Recurring PBT
(75)
44
86
87
103
% chg
95.8
2.0
18.0
Tax
-
0
12
17
21
(% of PBT)
-
0.0
13.9
20.0
20.0
PAT (reported)
(75)
44
74
70
83
Minority Interest (after tax)
0
-
-
-
-
Extraordinary Items
(74)
(4)
11
-
-
ADJ. PAT
(1)
48
63
70
83
% chg
30.8
11.2
18.0
(% of Net Sales)
(0.5)
16.4
18.8
18.1
18.4
Basic & Fully Diluted EPS (`)
(0.6)
21.3
27.9
31.0
36.6
% chg
30.8
11.2
18.0
May 7, 2018
5
Matrimony.com Ltd | 4QFY2018 Result Update
Consolidated Balance Sheet
Y/E March (` cr)
FY2016
FY2017
FY2018
FY2019E FY2019E
SOURCES OF FUNDS
Equity Share Capital
9
11
11
11
11
Reserves& Surplus
(85)
(42)
151
221
303
Shareholders Funds
(76)
(31)
162
232
314
Minority Interest
0
-
-
-
-
Total Loans
49
45
6
6
6
Deferred Tax Liability
23
2
2
2
2
Total Liabilities
(5)
16
170
240
323
APPLICATION OF FUNDS
Gross Block
63
24
77
120
130
Less: Acc. Depreciation
34
-
10
21
36
Net Block
28
24
68
99
94
Capital Work-in-Progress
-
-
-
-
-
Investments
-
-
74
74
74
Current Assets
95
95
165
212
315
Inventories
-
-
-
-
-
Sundry Debtors
2
2
17
21
31
Cash
58
58
98
113
167
Loans & Advances
24
16
17
27
45
Other Assets
11
19
34
50
72
Current liabilities
128
104
136
144
159
Net Current Assets
(33)
(9)
29
68
156
Deferred Tax Asset
-
-
-
-
-
Mis. Exp. not written off
-
-
-
-
-
Total Assets
(5)
16
170
240
323
May 7, 2018
6
Matrimony.com Ltd | 4QFY2018 Result Update
Consolidated Cashflow Statement
Y/E March (Rs cr)
FY2016
FY2017
FY2018
FY2019E FY2019E
Profit before tax
(1)
48
86
87
103
Depreciation
10
10
10
12
15
Change in Working Capital
13
(9)
3
(24)
(33)
Interest / Dividend (Net)
(1)
1
0
0
0
Direct taxes paid
(1)
(2)
(12)
(17)
(21)
Others
(27)
(34)
0
0
0
Cash Flow from Operations
(8)
14
86
57
64
(Inc.)/ Dec. in Fixed Assets
(10)
(10)
(53)
(43)
(10)
(Inc.)/ Dec. in Investments
11
11
(74)
0
0
Cash Flow from Investing
1
1
(127)
(43)
(10)
Issue of Equity
0
1
130
0
0
Inc./(Dec.) in loans
21
0
(38)
0
0
Dividend Paid (Incl. Tax)
0
0
0
0
0
Interest / Dividend (Net)
(3)
(9)
17
0
0
Cash Flow from Financing
18
(8)
109
0
0
Inc./(Dec.) in Cash
12
7
68
14
54
Opening Cash balances
11
23
30
98
113
Closing Cash balances
23
30
98
113
167
May 7, 2018
7
Matrimony.com Ltd | 4QFY2018 Result Update
Key Ratios
Y/E March
FY2016
FY2017
FY2018
FY2019E FY2019E
Valuation Ratio (x)
P/E (on FDEPS)
-
39.9
30.5
27.4
23.3
P/CEPS
-
35.5
23.0
23.5
19.7
P/BV
-
(61.7)
11.9
8.3
6.1
EV/Sales
7.5
6.5
5.2
4.5
3.7
EV/EBITDA
-
34.9
22.6
18.3
14.8
EV / Total Assets
-)
122.3
10.3
7.2
5.2
Per Share Data (Rs)
EPS (Basic)
(0.6)
21.3
27.9
31.0
36.6
EPS (fully diluted)
(0.6)
21.3
27.9
31.0
36.6
Cash EPS
(28.9)
24.0
36.9
36.2
43.2
Book Value
(33.7)
(13.8)
71.6
102.6
139.1
Returns (%)
ROCE
280.8
330.8
40.4
35.0
30.8
Angel ROIC (Pre-tax)
89.7
(99.4)
(1,758.7)
161.3
123.5
ROE
1.7
(154.7)
38.9
30.2
26.3
Turnover ratios (x)
Asset Turnover (Gross Block)
4.1
12.1
4.3
3.2
3.5
Inventory / Sales (days)
-
-
-
-
-
Receivables (days)
3
3
18
20
25
Payables (days)
58
22
20
18
16
Working capital cycle (ex-cash) (days)
(55)
(19)
(2)
2
9
Source: Company, Angel Research
May 7, 2018
8
Matrimony.com Ltd | 4QFY2018 Result Update
Research Team Tel: 022 - 39357800
DISCLAIMER
This document is solely for the personal information of the recipient, and must not be singularly used as the basis of any investment
decision. Nothing in this document should be construed as investment or financial advice. Each recipient of this document should make
such investigations as they deem necessary to arrive at an independent evaluation of an investment in the securities of the companies
referred to in this document (including the merits and risks involved), and should consult their own advisors to determine the merits and
risks of such an investment.
Angel Broking Pvt. Limited, its affiliates, directors, its proprietary trading and investment businesses may, from time to time, make
investment decisions that are inconsistent with or contradictory to the recommendations expressed herein. The views contained in this
document are those of the analyst, and the company may or may not subscribe to all the views expressed within.
Reports based on technical and derivative analysis center on studying charts of a stock's price movement, outstanding positions and
trading volume, as opposed to focusing on a company's fundamentals and, as such, may not match with a report on a company's
fundamentals.
The information in this document has been printed on the basis of publicly available information, internal data and other reliable sources
believed to be true, but we do not represent that it is accurate or complete and it should not be relied on as such, as this document is for
general guidance only. Angel Broking Pvt. Limited or any of its affiliates/ group companies shall not be in any way responsible for any
loss or damage that may arise to any person from any inadvertent error in the information contained in this report. Angel Broking Pvt.
Limited has not independently verified all the information contained within this document. Accordingly, we cannot testify, nor make any
representation or warranty, express or implied, to the accuracy, contents or data contained within this document. While Angel Broking
Pvt. Limited endeavours to update on a reasonable basis the information discussed in this material, there may be regulatory, compliance,
or other reasons that prevent us from doing so.
This document is being supplied to you solely for your information, and its contents, information or data may not be reproduced,
redistributed or passed on, directly or indirectly.
Angel Broking Pvt. Limited and its affiliates may seek to provide or have engaged in providing corporate finance, investment banking or
other advisory services in a merger or specific transaction to the companies referred to in this report, as on the date of this report or in
the past.
Neither Angel Broking Pvt. Limited, nor its directors, employees or affiliates shall be liable for any loss or damage that may arise from
or in connection with the use of this information.
Note: Please refer to the important `Stock Holding Disclosure' report on the Angel website (Research Section). Also, please refer to the
latest update on respective stocks for the disclosure status in respect of those stocks. Angel Broking Pvt. Limited and its affiliates may
have investment positions in the stocks recommended in this report.
Disclosure of Interest Statement
Century Plyboards India
1. Analyst ownership of the stock
No
2. Angel and its Group companies ownership of the stock
No
3. Angel and its Group companies' Directors ownership of the stock
No
4. Broking relationship with company covered
No
Note: We have not considered any Exposure below ` 1 lakh for Angel, its Group companies and Directors
Ratings (Returns):
Buy (> 15%)
Accumulate (5% to 15%)
Neutral (-5 to 5%)
Reduce (-5% to -15%)
Sell (< -15%)
May 7, 2018
9