3QFY2017 Result Update | Automobile
January 27, 2017
Maruti Suzuki
ACCUMULATE
CMP
`5,797
Performance Highlights
Target Price
`6,560
Y/E March (` cr)
3QFY17 3QFY16
% chg (yoy)
2QFY17
% chg (qoq)
Investment Period
12 Months
Net Sales
16,865
15,013
12.3
17,843
(5.5)
EBITDA
2,489
2,145
16.0
3,037
(18.1)
Stock Info
EBITDA Margin (%)
14.8
14.3
46 bp
17.0
(226) bp
Sector
Automobile
Adj. PAT
1,745
1,183
47.5
2,398
(27.3)
Market Cap (` cr)
175,110
Source: Company, Angel Research
Net Debt (` cr)
(17,593)
Beta
0.8
Strong operating performance aided by decent UV volumes: Maruti Suzuki (MSIL)
52 Week High / Low
5,972/3,202
reported a good set of numbers for 3QFY2017 with yoy 12.3% revenue growth
Avg. Daily Volume
76,907
and yoy 47.5% growth in its PAT. EBITDA came at `2,489cr, a yoy growth of
Face Value (`)
5
16.0%. EBITDA margins were at 14.8% v/s. 14.3% in 3QFY2016 and 17.0% in
2QFY2017. On sequential basis, revenue witnessed a 5.5% decline due to
BSE Sensex
27,708
demonetization. On the volume front, company reported yoy 5.8% and 1.6%
Nifty
8,603
decline in mini and compact segment vehicles respectively. The UV segment,
Reuters Code
MRTI.BO
however, reported yoy 25.5% growth due to the performance of recently launched
Bloomberg Code
MSIL@IN
models. Net realizations remained at `429,272 per unit showing a yoy growth of
8.65%. RM cost per unit at `301,453 increased by 9.59% yoy due to the rise in
Shareholding Pattern (%)
input costs. Management has indicated that showroom footfalls have come back
Promoters
56.2
to normalcy indicating that 4QFY2017 numbers are likely to be better than
MF / Banks / Indian Fls
12.2
3QFY2017.
FII / NRIs / OCBs
24.7
Indian Public / Others
6.9
Outlook and valuation: MSIL has continued to report double digit numbers due to
the strong performance of its utility vehicles. Company expects to launch one
model each year, which is likely to sustain its growth momentum in the near term.
Abs. (%)
3m 1yr
3yr
MSIL has indicated that showroom footfalls have come back to normalcy, which
Sensex
(0.5)
13.2
31.1
were impacted immediately after the demonetisation announcement. We believe
Maruti Suzuki
(1.3)
41.9
227.0
that 4QFY2017 revenue growth is likely to be better than 3QFY2017. With the
Gujarat plant nearing commissioning, the company will see de-bottlenecking of
capacity constraints. With the strong performance, MSIL is likely to gain further
3-year price chart
market share. At CMP, MSIL is trading at P/E of 22.8x and 18.6x its FY2017E and
6,000
FY2018E earnings respectively. We value MSIL on 21x of its FY2018E EPS of `312
5,000
with a target price of `6,560 with Accumulate rating on the stock.
4,000
3,000
Key financials (post SPIL merger)
2,000
Y/E March (` cr)
FY2015
FY2016
FY2017E
FY2018E
1,000
Net Sales
48,606
56,350
66,847
82,165
0
% chg
14.0
15.9
18.6
22.9
Net Profit
3,711
4,571
7,664
9,433
% chg
33.4
23.2
67.7
23.1
Source: Company, Angel Research
OPM (%)
13.8
15.9
16.3
16.6
EPS (Rs)
122.9
151.4
253.8
312.4
P/E (x)
47.2
38.3
22.8
18.6
P/BV (x)
7.4
6.5
5.2
4.2
RoE (%)
15.7
16.9
23.0
22.9
RoCE (%)
17.5
22.6
24.0
25.3
Shrikant Akolkar
EV/Sales (x)
3.3
2.7
2.2
1.7
022-3935 7800 Ext: 6846
EV/EBITDA (x)
24.3
17.5
14.0
10.7
Source: Company, Angel Research; Note: CMP as of January 25, 2016
Please refer to important disclosures at the end of this report
1
Maruti Suzuki | 3QFY2017 Result Update
Exhibit 1: Quarterly financial performance
Y/E March (` cr)
3QFY17
3QFY16
% chg (yoy)
2QFY17
% chg (qoq)
9MFY17
9MFY16
% chg (yoy)
Net Sales
16,865
15,013
12.3
17,843
(5.5)
49,628
42,141
17.8
Raw-material cost
11,674
10,293
13.4
12,074
(3.3)
33,873
28,579
18.5
(% of Sales)
69.2
68.6
67.7
68.3
67.8
Staff cost
617
502
22.9
519
18.8
1,715
1,381
24.2
(% of Sales)
3.7
3.3
2.9
3.5
3.3
Other Expenses
2,085
2,073
0.6
2,212
(5.7)
6,298
5,724
10.0
(% of Sales)
12.4
13.8
12.4
12.7
13.6
Total Expenditure
14,376
12,868
11.7
14,805
(2.9)
41,886
35,683
17.4
Operating Profit
2,489
2,145
16.0
3,037
(18.1)
7,742
6,458
19.9
OPM (%)
14.8
14.3
17.0
15.6
15.3
Interest
29
24
18.9
20
47.2
68
61
10.8
Depreciation
635
722
(12.1)
630
0.8
1,904
2,063
-7.7
Other Income
592
243
144.1
813
(27.2)
1,888
923
104.6
PBT (excl. Extr. Items)
2,417
1,641
47.3
3,200
(24.5)
7,658
5,256
45.7
Extr. Income/(Expense)
PBT (incl. Extr. Items)
2,417
1,641
47.3
3,200
(24.5)
7,658
5,256
45.7
(% of Sales)
14.3
10.9
17.9
15.4
12.5
Provision for Taxation
673
458
46.8
802
(16.2)
2,031
1,468
38.3
(% of PBT)
27.8
27.9
25.1
26.5
27.9
Reported PAT
1,745
1,183
47.5
2,398
(27.3)
5,628
3,788
48.6
Adj PAT
1,745
1,183
47.5
2,398
(27.3)
5,628
3,788
48.6
Adj. PATM
10.3
7.9
13.4
11.3
9.0
Equity capital (cr)
151
151
151
151
151
Reported EPS (`)
57.75
39.16
47.5
79.38
(27.3)
186.30
125.40
48.6
Source: Company, Angel Research
January 27, 2017
2
Maruti Suzuki | 3QFY2017 Result Update
Exhibit 2: Quarterly volume performance
Volume (units)
Q3FY17
Q3FY16
% chg (yoy) Q2FY17
% chg (qoq)
9MFY17
9MFY16
% chg (yoy)
A: Mini: Alto, WagonR
104,342
110,810
(5.8)
114,936
(9.2)
312,001
326,598
(4.5)
A: Compact: Swift, Celerio, Dzire, Baleno
150,899
153,423
(1.6)
156,284
(3.4)
447,204
435,695
2.6
A: Mid-Size: Ciaz
15,504
14,240
8.9
17,920
(13.5)
47,114
38,160
23.5
Total Passenger cars
270,745
278,473
(2.8)
289,140
(6.4)
8,06,319
8,00,453
0.7
B: Utility Vehicles: Gypsy, Ertiga
34,252
27,291
25.5
52,611
(34.9)
126,211
79,055
59.6
C: Vans: Omni, Eeco
51,295
37,231
37.8
41,197
24.5
129,050
92,450
39.6
D: LCV
211
0
83
294
0
n.a
Total Domestic (includes LCV)
356,503
342,995
3.9
383,031
(6.9)
10,61,874
971,958
9.3
Total Exports
30,748
31,187
(1.4)
35,440
(13.2)
92,291
96,888
(4.7)
Total Volume
387,251
374,182
3.5
418,471
(7.5)
11,54,165
10,68,846
8.0
Source: Company, Angel Research
MSIL saw reduced footfalls immediately after the demonetisation
announcement, however, footfalls have been restored, indicating that the
impact of note ban is likely to vanish earlier than expected.
Total volumes during the quarter were at 387,251 showing a yoy growth of
3.5%. Domestic volumes grew by 3.94% while export volumes contracted by
1.4%.
Company reported 5.84% decline in its mini vehicle segment; the compact
class vehicle sales growth was flat. Mid size, vans and UV segment vehicles
showed growth of 8.9%, 37.8% and 25.5% respectively, indicating that the
performance was better than entry level cars.
During the quarter, company sold 211 LCVs compared to 83 LCVs in
3QFY2017.
Company continues to outperform the industry growth. During the quarter
industry growth was 1.8% while company growth was at 3.9%.
Realisation per vehicle grew 8.65% yoy owing to a better product mix with
higher volumes of utility vehicles. The contribution/vehicle also improved by
~9.6% due to better product mix.
We estimate domestic and export realizations to be `4.27 lakh and `4.50 lakh
showing yoy growth 8.31% and 12.54% respectively.
During the quarter company paid royalty at 5.5% of net sales v/s. 6.1% of net
sales in 2QFY2017.
Company is targeting millennial group (age group 18-28) as potential
customers for newly launched hatchback Ignis.
January 27, 2017
3
Maruti Suzuki | 3QFY2017 Result Update
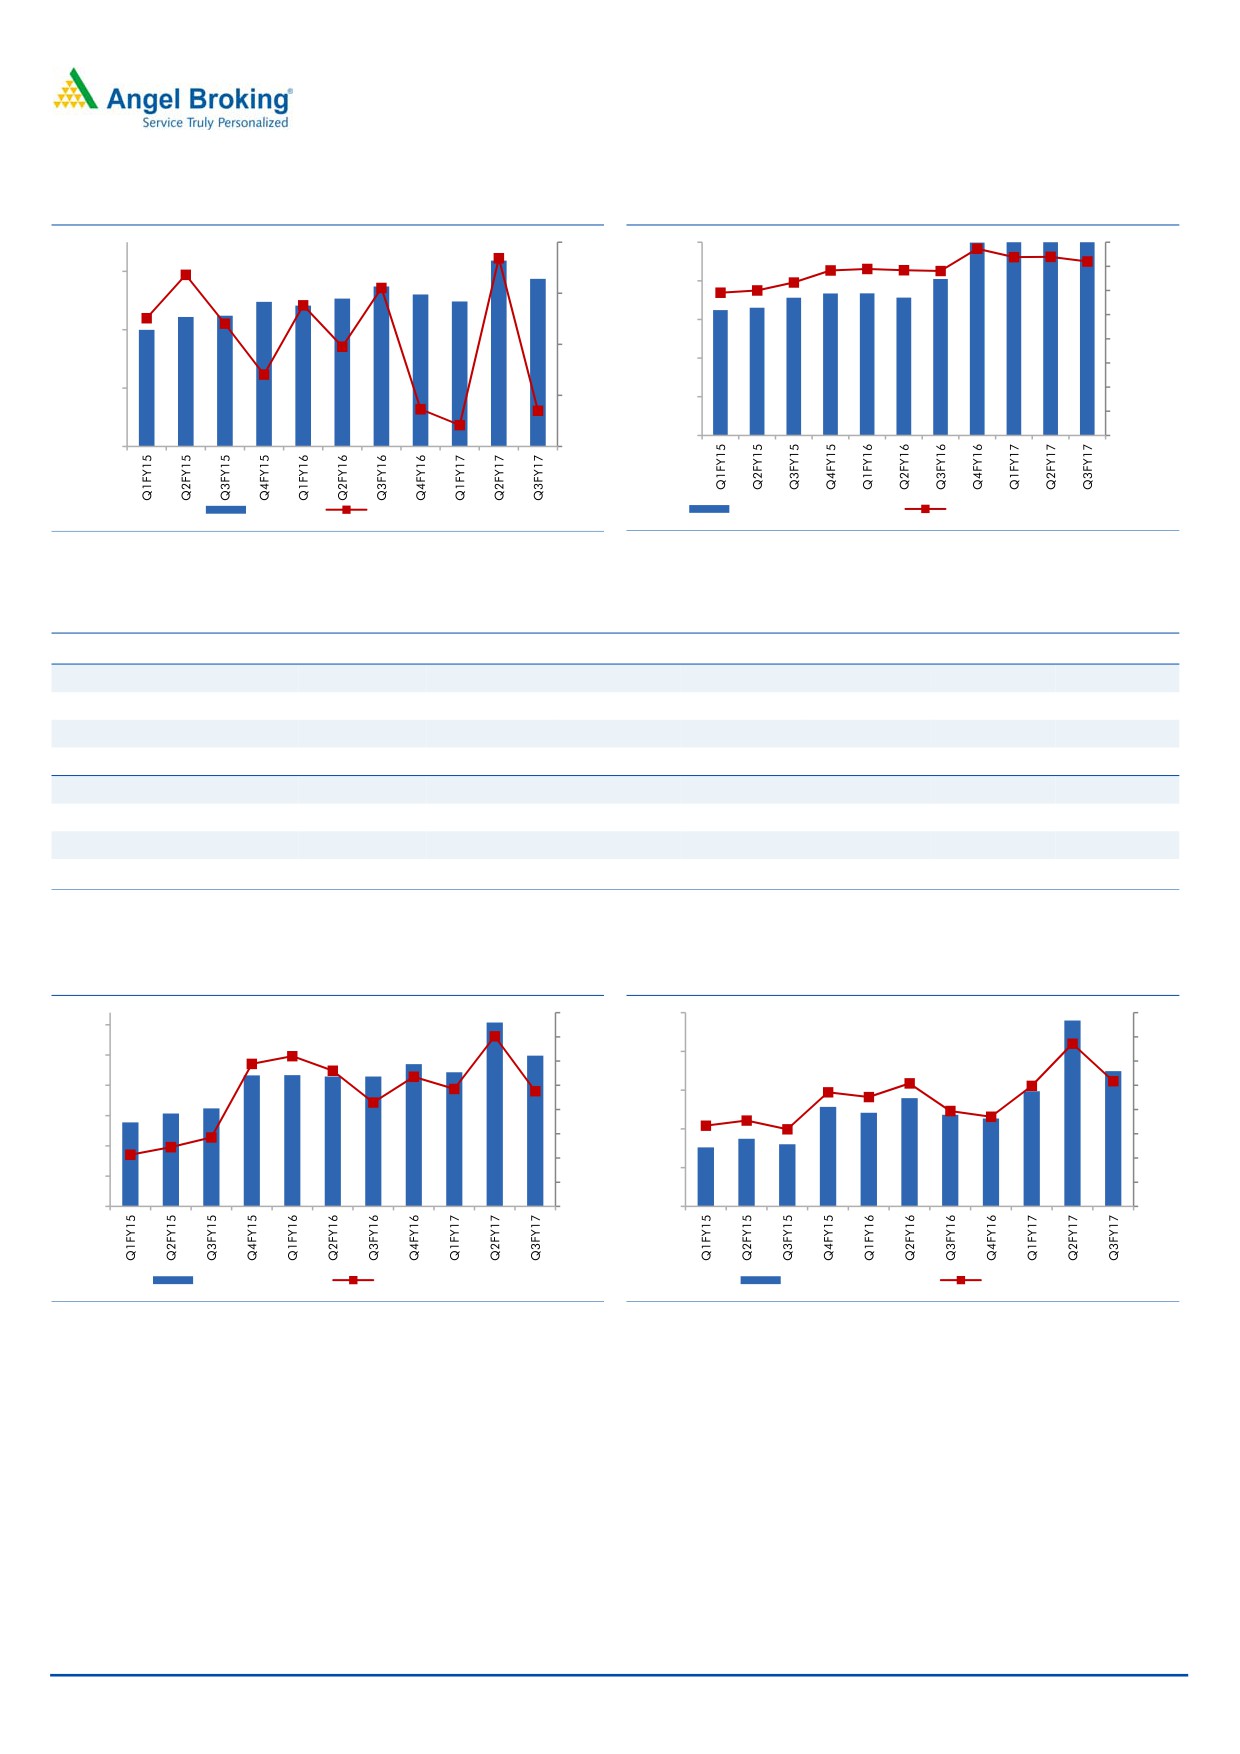
Exhibit 3: Growth slows due to demonetisation
Exhibit 4: Realisation & contribution per vehicle
20.0
425,000
150,000
400,000
130,000
400,000
15.0
110,000
375,000
90,000
300,000
70,000
10.0
350,000
50,000
200,000
30,000
5.0
325,000
10,000
300,000
-10,000
100,000
0.0
Volumes
yoy growth (%)
Net realization (`)
Contribution / Vehicle (`)
Source: Company, Angel Research
Source: Company, Angel Research
Exhibit 5: Quarterly revenue and realization performance
Q1FY16
Q2FY16
Q3FY16
Q4FY16
Q1FY17
Q2FY17
*Q3FY17
Domestic revenue (` cr)
11,698
12,360
13,523
13,548
13,334
16,030
15,242
Change yoy (%)
19.00
16.66
22.50
12.25
13.98
29.69
12.58
Domestic realization (`)
382,680
382,344
394,254
406,352
413,663
418,494
427,547
Change yoy (%)
5.36
3.82
5.43
7.12
8.10
9.45
8.31
Export revenue (` cr)
1,380
1,130
1,245
1,382
1,352
1,565
1,381
Change yoy (%)
11.0
(19.3)
1.7
14.9
(2.0)
38.5
11.0
Export realization (`)
387,260
375,840
399,077
511,681
517,948
441,591
449,272
Change yoy (%)
(8.87)
(8.22)
(6.40)
25.65
33.75
17.49
12.54
Source: Company, Angel Research, * Estimates
Exhibit 6: EBITDA growth at 16%, margins at 14.8%
Exhibit 7: PAT grows despite demonetisation impact
18.0
2,500
16.0
3,000
17.0
14.0
2,500
2,000
16.0
12.0
2,000
15.0
1,500
10.0
14.0
8.0
1,500
13.0
1,000
6.0
1,000
12.0
4.0
500
500
11.0
2.0
0
10.0
0
0.0
EBITDA (`cr)
EBITDA margins (%)
Net profit (`cr)
Net margin (%)
Source: Company, Angel Research
Source: Company, Angel Research
January 27, 2017
4
Maruti Suzuki | 3QFY2017 Result Update
Conference call - Key highlights
Company has indicated that share of diesel vehicles has declined to 40% and
company has 30% market share in the diesel vehicles.
While exports showed flat growth, company expects to reach the target of
124,000 exports by end of the year.
The discount during the quarter was at `19,048 v/s. 21,997 in 3QFY2016
and `16,100 in 2QFY2017.
Company has said that demand scenario remains strong but has ruled out
price increase of its products.
It has also said that recovery in the rural market is on the lines of recovery of
urban markets, implying that rural demand has picked up very strong and that
entry level volumes are likely to show good numbers in 4QFY2017.
The commissioning of the Gujarat plant is around the corner, and it will ease
capacity constraints.
Government employees segment constitute ~20% of MSIL’s sales v/s. 14-15%
in the last quarter. In the last quarter, company had indicated that it had
dedicated a team to cater to this segment and we believe that
20%
contribution from govt. employees is an effect of this.
It also indicated that inquiries are growing form the first time buyers, however,
the sentiment of small business owners remained impacted.
Waiting period for Baleno is 24 weeks while that for Ignis is 8-10 weeks.
Company has indicated that Suzuki will take care of the Gujarat plant capex.
MSIL has guided FY2017E full year capex of `3,500cr.
Company expects higher maintenance capex due to its aging plants (Gurgaon
and Manesar).
January 27, 2017
5
Maruti Suzuki | 3QFY2017 Result Update
Investment arguments
MSIL seeing faster recovery after demonetisation: The automobile demand in
India has seen the impact of demonetization in 3QFY2017 however Maruti
with its strong performance has continued to grow in double digits. We
believe, MSIL is seeing faster recovery than its peers. Further, the low interest
rate is expected to boost the consumer sentiment, which will benefit MSIL due
to its high market share. Overall, we expect resilient demand in 4QFY2017,
which will result in growth in volumes for the Automobile companies.
MSIL expected to gain market share: MSIL is the largest passenger car
manufacturer in the country and enjoys a leadership position. MSIL’s major
product portfolio is towards the petrol cars, where it enjoys highest market
shares among its peers. The lower petrol prices have benefitted the company
and continued weakness in crude prices is expected to benefit the company by
keeping petrol prices at lower levels. In 2QFY2017, MSIL’s share of petrol
vehicles in total passenger vehicle industry stood at 59.2% compared to 53.7%
in 2QFY2016. Strong dealership network and improved product mix is
expected to benefit the company in gaining further market share. We also
expect the passenger vehicle penetration to go up in the country, which will
help MSIL, as it already covers most parts of the country through its robust
dealership network.
Gujarat plant to ease capacity constraints: MSIL is currently seeing capacity
constraints, which have led to company overstretching its existing capacity. In
2QFY2017, MSIL’s capacity utilization was more than 100% and indicates that
it may not be able to cater the strong demand without capacity expansion.
Gujarat capacity is expected to address these constraints by adding additional
capacity of 250,000 vehicles per annum from 4QFY2017 onwards.
Ignis to help MSIL reporting double digit growth: MSIL’s new launch, Ignis - a
hatchback, is likely to take the company’s growth story forward. The last few
launches have been received well by the market and we expect the same to
continue. Ignis is targeted for tech savvy millennial consumers (18-25 age
groups). Company has started booking and has already received ~10,000+
booking and the waiting period is 8-10 weeks.
January 27, 2017
6
Maruti Suzuki | 3QFY2017 Result Update
Outlook and valuation
MSIL has continued to report double digit numbers due to the strong performance
of its utility vehicles. Company expects to launch one model each year, which is
likely to sustain its growth momentum in the near term. MSIL has indicated that
showroom footfalls have come back to normalcy, which were impacted
immediately after the demonetisation announcement.
We believe that 4QFY2017 revenue growth is likely to be better than 3QFY2017.
With the Gujarat plant nearing commissioning, the company will see de-
bottlenecking of capacity constraints. With the strong performance, MSIL is likely to
gain further market share. At CMP, MSIL is trading at P/E of 22.8x and 18.6x its
FY2017E and FY2018E earnings respectively. We value MSIL on 21x of its
FY2018E EPS of `312 with a target price of `6,560 with Accumulate rating on the
stock.
Exhibit 8: Key assumptions
Y/E March
FY2013
FY2014
FY2015
FY2016E
FY2017E
FY2018E
Domestic unit sales
1,050,859
1,053,688
1,170,702
1,305,351
1,424,099
1,575,324
YoY growth (%)
4.4
0.3
11.1
11.5
9.1
10.6
Exports unit sales
120,388
101,352
121,713
123,897
124,000
145,721
YoY growth (%)
(5.5)
(15.8)
20.1
1.8
0.1
17.5
Total volumes
1,171,247
1,155,040
1,292,415
1,429,248
1,548,099
1,721,045
YoY growth (%)
3.3
(1.4)
11.9
10.6
8.3
11.2
Per unit domestic realization
405,502
404,719
415,183
431,688
425,888
466,969
Per unit exports realization
378,784
408,645
380,641
386,797
499,737
590,330
Per unit realisation (blended)
363,822
369,206
376,083
394,266
431,803
477,414
YoY growth (%)
18.8
1.5
1.9
4.8
9.5
10.6
Per unit RM
277,611
271,112
270,873
271,331
297,209
326,934
YoY growth (%)
12.1
(2.3)
(0.1)
0.2
9.5
10.0
Source: Company, Angel Research
Company background
Maruti Suzuki (MSIL), a subsidiary of Suzuki Motor Corporation (SMC), Japan
(which holds a 56% stake in MSIL), is the largest passenger car company in India,
accounting for ~47% of the domestic passenger car market. MSIL operates from
two facilities in India (Gurgaon and Manesar) with an installed capacity of 1.5mn
units. Company is also in process of commissioning production at Gujarat plant,
which will help the company to ease its capacity constraints. Company in the last
two years has moved in premium products with launch of Baleno, Vitara, S-Cross
and Ciaz. Also, MSIL has steadily increased its presence internationally, and
exports now account for ~9% of its overall sales volume and same is expected to
increase going ahead.
January 27, 2017
7
Maruti Suzuki | 3QFY2017 Result Update
Profit and loss statement (post SPIL merger)
Y/E March (` cr)
FY2014
FY2015
FY2016
FY2017E
FY2018E
Total operating income
43,792
49,971
57,746
67,822
83,288
% chg
2.8
14.1
15.6
17.4
22.8
Total Expenditure
38,605
43,258
48,768
56,958
69,635
Cost of Materials
31,315
35,008
38,780
46,011
56,267
Personnel
1,368
1,607
1,989
2,406
3,098
Others Expenses
5,922
6,643
7,999
8,541
10,271
EBITDA
5,187
6,713
8,979
10,865
13,653
% chg
22.6
29.4
33.7
21.0
25.7
(% of Net Sales)
11.8
13.4
15.5
16.0
16.4
Depreciation& Amort.
2,084
2,470
2,824
2,804
3,155
EBIT
3,103
4,243
6,155
8,060
10,498
% chg
122.7
36.7
45.1
31.0
30.2
(% of Net Sales)
7.1
8.5
10.7
11.9
12.6
Interest & other Charges
176
206
82
91
103
Other Income
732
832
462
2,479
2,707
(% of PBT)
20.0
17.1
7.1
23.7
20.7
Recurring PBT
3,659
4,868
6,535
10,448
13,102
% chg
81.5
33.1
34.2
59.9
25.4
Prior Period & Extra. Exp./(Inc.)
-
-
-
-
-
PBT (reported)
3,659
4,868
6,535
10,448
13,102
Tax
876
1,157
1,964
2,784
3,669
(% of PBT)
23.9
23.8
30.0
26.6
28.0
PAT (reported)
2,783
3,711
4,571
7,664
9,433
Add: Share of earnings of asso.
-
-
-
-
-
Less: Minority interest (MI)
-
-
-
-
-
PAT after MI (reported)
2,783
3,711
4,571
7,664
9,433
ADJ. PAT
2,783
3,711
4,571
7,664
9,433
% chg
16.3
33.4
23.2
67.7
23.1
(% of Net Sales)
6.4
7.4
7.9
11.3
11.3
Basic EPS (`)
92.1
122.9
151.4
253.8
312.4
Fully Diluted EPS (`)
92.1
122.9
151.4
253.8
312.4
% chg
16.3
33.4
23.2
67.7
23.1
January 27, 2017
8
Maruti Suzuki | 3QFY2017 Result Update
Balance sheet statement (post SPIL merger)
Y/E March (` cr)
FY2014
FY2015
FY2016
FY2017E
FY2018E
SOURCES OF FUNDS
Equity Share Capital
151
151
151
151
151
Reserves& Surplus
20,827
23,553
26,856
33,218
41,047
Shareholders’ Funds
20,978
23,704
27,007
33,369
41,198
Minority Interest
-
-
-
-
-
Total Loans
1,824
516
231
231
231
Deferred Tax Liability
691
587
625
625
625
Other Liabilities
437
398
424
424
424
Total Liabilities
23,930
25,205
28,288
34,649
42,479
APPLICATION OF FUNDS
Gross Block
22,702
26,462
29,409
32,909
37,209
Less: Acc. Depreciation
11,911
14,202
16,641
19,446
22,601
Net Block
10,790
12,259
12,768
13,463
14,608
Capital Work-in-Progress
2,621
1,883
1,007
1,007
1,007
Investments
10,118
12,814
17,786
22,060
27,936
Current Assets
7,070
6,593
7,635
9,881
13,223
Inventories
1,706
2,686
3,132
3,663
4,502
Sundry Debtors
1,414
1,070
1,299
1,648
2,026
Cash
630
18
39
1,093
1,683
Loans & Advances
1,629
1,426
1,807
1,939
2,876
Other Assets
1,692
1,393
1,359
1,537
2,136
Current liabilities
6,775
8,451
11,059
11,913
14,447
Net Current Assets
295
(1,857)
(3,424)
(2,032)
(1,224)
Deferred Tax Asset
105
106
151
151
151
Mis. Exp. not written off
-
-
-
-
-
Total Assets
23,930
25,205
28,288
34,649
42,479
Note: Cash and bank balance includes term deposits with banks
January 27, 2017
9
Maruti Suzuki | 3QFY2017 Result Update
Cash flow statement (post SPIL merger)
Y/E March (` cr)
FY2014
FY2015
FY2016
FY2017E FY2018E
Profit before tax
3,659
4,868
6,535
10,448
13,102
Depreciation
2,084
2,470
2,824
2,804
3,155
Change in Working Capital
756
746
1,466
(337)
(219)
Interest / Dividend (Net)
(106)
43
(80)
91
103
Direct taxes paid
(832)
(1,041)
(1,910)
(2,784)
(3,669)
Others
(658)
(766)
(401)
-
-
Cash Flow from Operations
4,904
6,321
8,433
10,222
12,473
(Inc.)/ Dec. in Fixed Assets
(3,498)
(3,157)
(2,594)
(3,500)
(4,300)
(Inc.)/ Dec. in Investments
(1,395)
(1,253)
(4,582)
(4,274)
(5,876)
Cash Flow from Investing
(4,893)
(4,410)
(7,176)
(7,774)
(10,176)
Issue of Equity
-
-
1
-
-
Inc./(Dec.) in loans
378
(1,328)
(235)
0
0
Dividend Paid (Incl. Tax)
(242)
(363)
(755)
(1,303)
(1,604)
Interest / Dividend (Net)
(293)
(831)
(246)
(91)
(103)
Cash Flow from Financing
(156)
(2,522)
(1,236)
(1,394)
(1,707)
Inc./(Dec.) in Cash
(145)
(611)
21
1,054
590
Opening Cash balances
775
630
18
39
1,093
Closing Cash balances
630
18
39
1,093
1,683
Note: Closing Cash balances excludes term deposits with banks and unclaimed dividend accounts
January 27, 2017
10
Maruti Suzuki | 3QFY2017 Result Update
Key ratios
Y/E March
FY2014
FY2015
FY2016
FY2017E FY2018E
Valuation Ratio (x)
P/E (on FDEPS)
62.9
47.2
38.3
22.8
18.6
P/CEPS
36.0
28.3
23.7
16.7
13.9
P/BV
8.3
7.4
6.5
5.2
4.2
Dividend yield (%)
0.1
0.2
0.4
0.7
0.9
EV/Sales
3.8
3.3
2.7
2.2
1.7
EV/EBITDA
32.0
24.3
17.5
14.0
10.7
EV / Total Assets
5.4
4.8
4.0
3.3
2.6
Per Share Data (`)
EPS (Basic)
92.1
122.9
151.4
253.8
312.4
EPS (fully diluted)
92.1
122.9
151.4
253.8
312.4
Cash EPS
161.1
204.7
244.9
346.6
416.8
DPS
8.0
12.0
25.0
43.1
53.1
Book Value
694.5
784.7
894.3
1,104.9
1,364.2
Returns (%)
ROCE
13.6
17.5
22.6
24.0
25.3
Angel ROIC (Pre-tax)
25.7
37.3
65.4
77.2
88.9
ROE
13.3
15.7
16.9
23.0
22.9
Turnover ratios (x)
Asset Turnover (Gross Block)
1.9
1.9
2.0
2.1
2.2
Inventory / Sales (days)
15
20
20
20
20
Receivables (days)
12
8
8
9
9
Payables (days)
46
45
49
44
44
WC cycle (ex-cash) (days)
(20)
(17)
(21)
(15)
(15)
January 27, 2017
11
Maruti Suzuki | 3QFY2017 Result Update
Research Team Tel: 022 - 39357800
DISCLAIMER
Angel Broking Private Limited (hereinafter referred to as “Angel”) is a registered Member of National Stock Exchange of India Limited,
Bombay Stock Exchange Limited and Metropolitan Stock Exchange Limited. It is also registered as a Depository Participant with CDSL
and Portfolio Manager with SEBI. It also has registration with AMFI as a Mutual Fund Distributor. Angel Broking Private Limited is a
registered entity with SEBI for Research Analyst in terms of SEBI (Research Analyst) Regulations, 2014 vide registration number
INH000000164. Angel or its associates has not been debarred/ suspended by SEBI or any other regulatory authority for accessing
/dealing in securities Market. Angel or its associates/analyst has not received any compensation / managed or co-managed public
offering of securities of the company covered by Analyst during the past twelve months.
This document is solely for the personal information of the recipient, and must not be singularly used as the basis of any investment
decision. Nothing in this document should be construed as investment or financial advice. Each recipient of this document should
make such investigations as they deem necessary to arrive at an independent evaluation of an investment in the securities of the
companies referred to in this document (including the merits and risks involved), and should consult their own advisors to determine
the merits and risks of such an investment.
Reports based on technical and derivative analysis center on studying charts of a stock's price movement, outstanding positions and
trading volume, as opposed to focusing on a company's fundamentals and, as such, may not match with a report on a company's
fundamentals. Investors are advised to refer the Fundamental and Technical Research Reports available on our website to evaluate the
contrary view, if any.
The information in this document has been printed on the basis of publicly available information, internal data and other reliable
sources believed to be true, but we do not represent that it is accurate or complete and it should not be relied on as such, as this
document is for general guidance only. Angel Broking Pvt. Limited or any of its affiliates/ group companies shall not be in any way
responsible for any loss or damage that may arise to any person from any inadvertent error in the information contained in this report.
Angel Broking Pvt. Limited has not independently verified all the information contained within this document. Accordingly, we cannot
testify, nor make any representation or warranty, express or implied, to the accuracy, contents or data contained within this document.
While Angel Broking Pvt. Limited endeavors to update on a reasonable basis the information discussed in this material, there may be
regulatory, compliance, or other reasons that prevent us from doing so.
This document is being supplied to you solely for your information, and its contents, information or data may not be reproduced,
redistributed or passed on, directly or indirectly.
Neither Angel Broking Pvt. Limited, nor its directors, employees or affiliates shall be liable for any loss or damage that may arise from
or in connection with the use of this information.
Disclosure of Interest Statement
Maruti Suzuki
1. Financial interest of research analyst or Angel or his Associate or his relative
No
2. Ownership of 1% or more of the stock by research analyst or Angel or associates or relatives
No
3. Served as an officer, director or employee of the company covered under Research
No
4. Broking relationship with company covered under Research
No
Ratings (Based on expected returns
Buy (> 15%)
Accumulate (5% to 15%)
Neutral (-5 to 5%)
over 12 months investment period):
Reduce (-5% to -15%)
Sell (< -15)
January 27, 2017
12