3QFY2016 Result Update | Automobile
January 30, 2016
Maruti Suzuki
NEUTRAL
CMP
`4,097
Performance Highlights
Target Price
-
Y/E March (` cr)
3QFY16 3QFY15
% chg (yoy)
2QFY16
% chg (qoq)
Investment Period
-
Net Sales
15,082
12,603
19.7
13,934
8.2
Stock Info
EBITDA
2,170
1,619
34.0
2,269
(4.4)
Sector
Automobile
EBITDA Margin (%)
14.4
12.9
150 bp
16.3
(190 bp)
Market Cap (` cr)
123,776
Net Profit
1,019
802
27.1
1,226
(16.8)
Net Debt (` cr)
(12,652)
Source: Company, Angel Research
Beta
0.8
Operating results meet estimates, lower other income drags profitability: Maruti
52 Week High / Low
4,789/3,362
Suzuki India Ltd (MSIL) 3QFY2016 operating results adjusted for one off items
Avg. Daily Volume
57,323
were in line with our estimates. MSIL revenues, expectedly grew 20% yoy to
Face Value (`)
5
`15,082 cr driven majorly by a robust 16% volume growth. New product
BSE Sensex
24,871
launches coupled with robust festive demand enabled MSIL to clock strong
Nifty
7,564
volumes. Realisation/vehicle grew 4% led by a better product mix. MSIL incurred
Reuters Code
MRTI.BO
one off expenditures to the tune of `175 cr during the quarter (`150 cr on
Bloomberg Code
MSIL@IN
account of inventory decretion and `25 cr due to higher employee expenses due
to higher bonus declared retrospectively for 21 months). Adjusted for the one off
items, operating margins came in at 15.5% which is line with our estimates.
Shareholding Pattern (%)
However, MSIL reported lower other income of `32 cr (as against `102 cr
Promoters
56.2
reported in corresponding quarter last year) which led to the Adjusted Net Profit
MF / Banks / Indian Fls
15.9
coming in at `1,142 cr as against our estimate of `1,270 cr.
FII / NRIs / OCBs
25.2
Indian Public / Others
2.7
Outlook and valuation: The passenger vehicle (PV) industry is well poised to post
double-digit growth over the next two years, given the improved consumer
sentiments, better economic outlook, and softer fuel prices. Given the new
Abs. (%)
3m 1yr
3yr
launches, MSIL is likely to retain its market share despite increased competitive
Sensex
(7.3)
(16.2)
24.4
intensity. However, MSIL margins are likely to tread down in FY2017 from the
Maruti Suzuki
(7.8)
11.1
157.3
record 1HFY2016 levels given the increased sales promotion expenses due to
new launches and the recent appreciation of JPY vis a vis INR which would
increase the raw material and the royalty expenses. At CMP, MSIL is trading at P/E
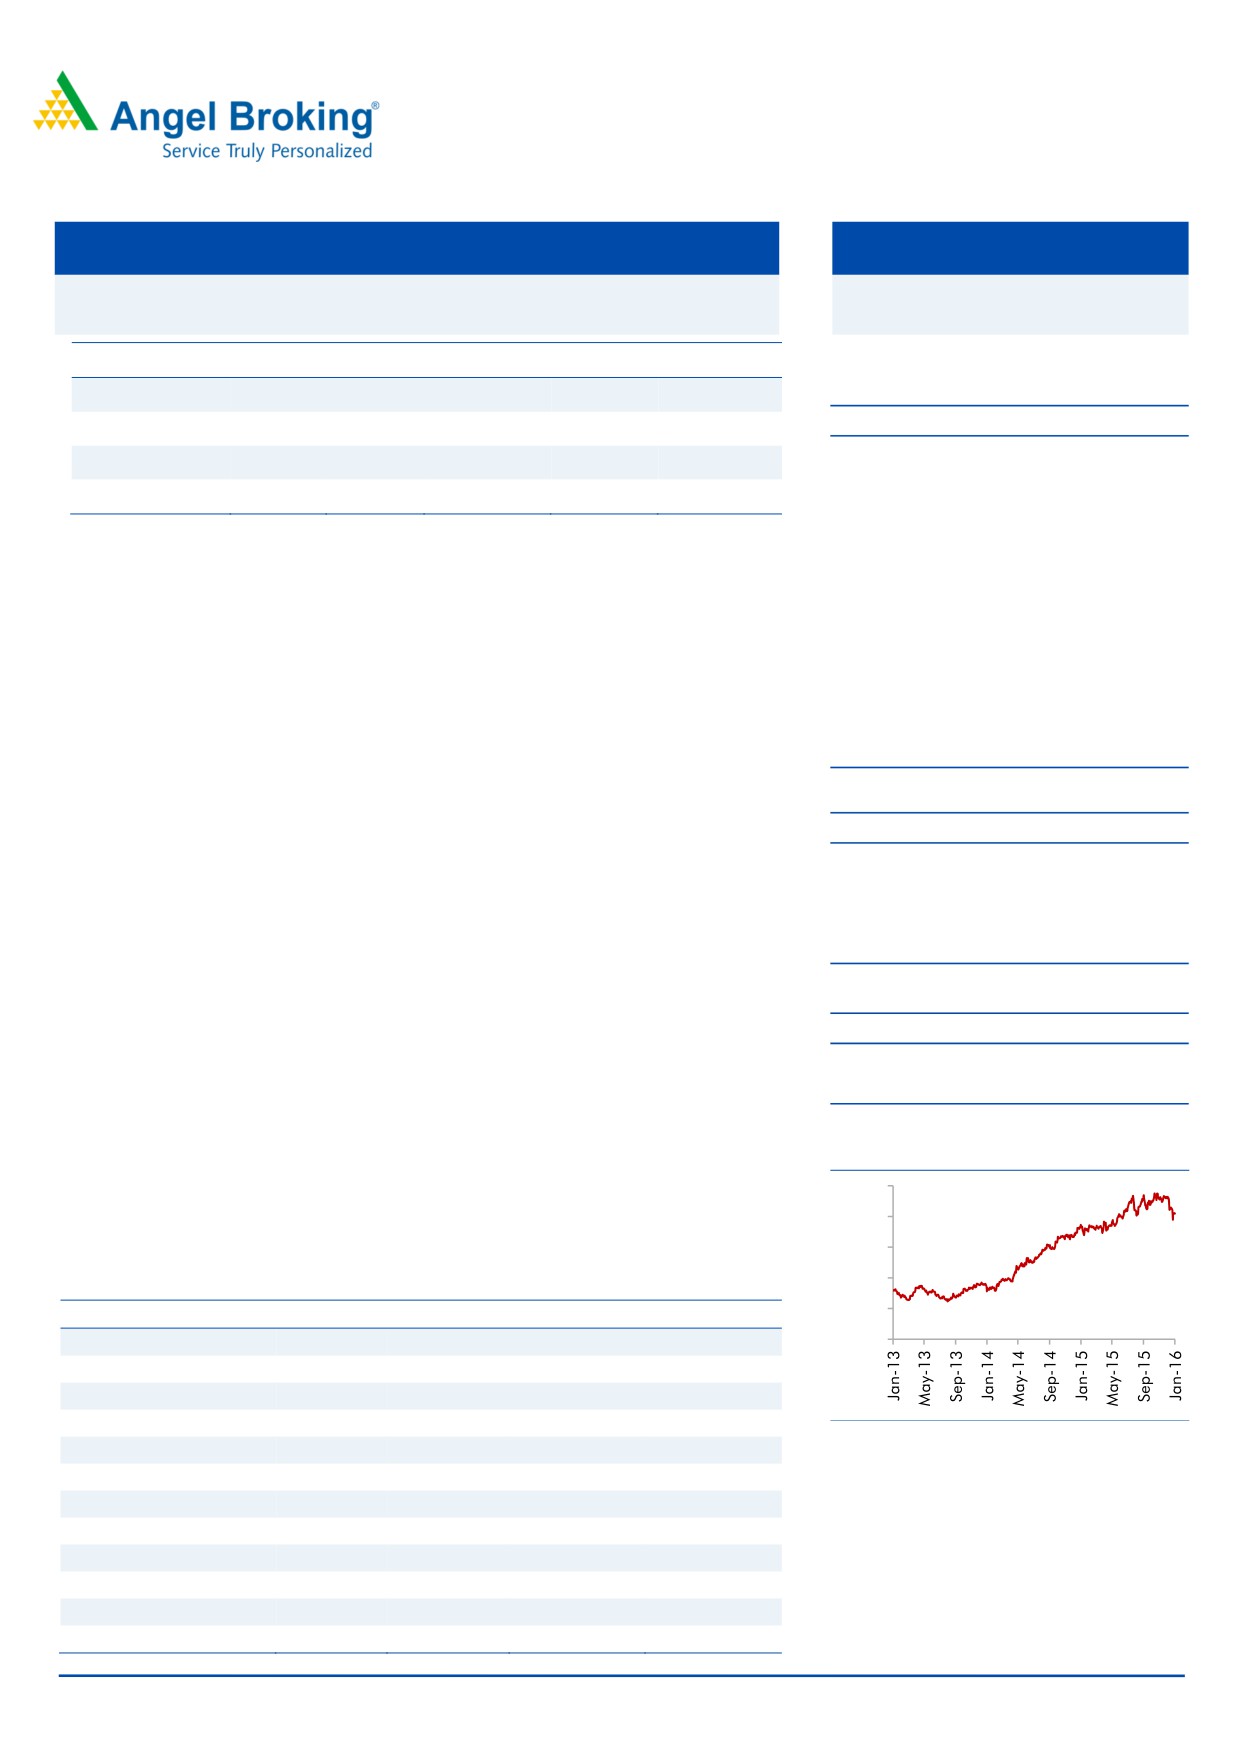
3-year price chart
5,000
of 25.6x and 19.4x its FY2016 and FY2017 earnings respectively, leaving no
scope of meaningful upside from current levels. Hence, we maintain our Neutral
4,000
rating on the stock.
3,000
2,000
Key financials (post SPIL merger)
1,000
Y/E March (` cr)
FY2014
FY2015
FY2016E
FY2017E
Net Sales
43,701
49,971
58,365
69,070
0
% chg
1.4
14.3
16.8
18.3
Net Profit
2,783
3,711
4,838
6,374
% chg
21.0
33.4
30.4
31.8
Source: Company, Angel Research
EBITDA (%)
11.6
13.4
15.5
15.5
EPS (`)
92.1
122.9
160.1
211.0
P/E (x)
44.5
33.3
25.6
19.4
P/BV (x)
5.9
5.2
4.6
3.4
RoE (%)
13.3
15.7
17.9
20.2
RoCE (%)
16.2
20.5
24.4
26.3
Bharat Gianani
EV/Sales (x)
2.7
2.4
1.9
1.6
022-3935 7800 Ext: 6817
EV/EBITDA (x)
22.8
18.0
12.5
10.2
Source: Company, Angel Research; Note: CMP as of January 29, 2016
Please refer to important disclosures at the end of this report
1
Maruti Suzuki | 3QFY2016 Result Update
Exhibit 1: Quarterly financial performance
Y/E March (` cr)
3QFY16
3QFY15
% chg (yoy)
2QFY16
% chg (qoq)
9MFY16
9MFY15
% chg (yoy)
Net Sales
15,082
12,603
19.7
13,934
8.2
42,441
36,346
16.8
Raw-material cost
10,328
8,826
17.0
9,312
10.9
28,685
25,785
11.2
(% of Sales)
68.5
70.0
66.8
67.6
70.9
Staff cost
505
375
34.5
418
20.7
1,386
1,098
26.2
(% of Sales)
3.3
3.0
3.0
3.3
3.0
Other Expenses
2,080
1,782
16.7
1,934
7.5
5,741
4,924
16.6
(% of Sales)
13.8
14.1
13.9
13.5
13.5
Total Expenditure
12,912
10,983
17.6
11,664
10.7
35,812
31,808
12.6
Operating Profit
2,170
1,619
34.0
2,269
(4.4)
6,629
4,538
46.1
OPM (%)
14.4
12.9
16.3
15.6
12.5
Interest
24
30
(18.7)
18
37.2
61
103
(40.8)
Depreciation
722
628
15.0
669
7.9
2,063
1,810
14.0
Other Income
32
102
(69.1)
137
(77.0)
341
522
(34.8)
PBT (excl. Extr. Items)
1,455
1,064
36.8
1,719
(15.4)
4,845
3,147
54.0
Extr. Income/(Expense)
-
-
-
-
-
-
-
-
PBT (incl. Extr. Items)
1,455
1,064
36.8
1,719
(15.4)
4,845
3,147
54.0
(% of Sales)
9.6
8.4
12.3
11.4
8.7
Provision for Taxation
436
262
66.6
494
(11.7)
1,407
720
95.5
(% of PBT)
29.9
24.6
28.7
29.0
22.9
Reported PAT
1,019
802
27.1
1,226
(16.8)
3,438
2,427
41.6
Adj PAT
1,019
802
27.1
1,226
(16.8)
3,438
2,427
41.6
Adj. PATM
6.8
6.4
8.8
8.1
6.7
Equity capital (cr)
151.0
151.0
151.0
151.0
151.0
Reported EPS (`)
33.7
26.6
27.1
40.6
(16.8)
113.8
80.3
41.6
Source: Company, Angel Research
Exhibit 2: 3QFY2016 - Actual vs Angel estimates
Y/E March (` cr)
Actual
Estimates
Variation (%)
Net Sales
15,082
15,115
(0.2)
EBITDA
2,170
2,335
(7.1)
EBITDA margin (%)
14.4
15.4
(100 bp)
Net Profit
1,019
1,270
(19.8)
Source: Company, Angel Research
January 30, 2016
2
Maruti Suzuki | 3QFY2016 Result Update
Exhibit 3: Quarterly volume performance
Volume (units)
3QFY16 3QFY15
% chg (yoy) 2QFY16
% chg (qoq) 9MFY16 9MFY15
% chg (yoy)
A: Mini: Alto, WagonR
110,810
108,124
2.5
110,987
(0.2)
326,598
309,845
5.4
A: Compact: Swift, Ritz, Celerio, Dzire, Baleno
153,423
121,027
26.8
144,439
6.2
435,695
380,726
14.4
A: Mid-Size: Ciaz
14,240
15,308
(7.0)
10,546
35.0
38,160
17,485
118.2
Total Passenger cars
278,473
244,459
13.9
265,972
4.7
800,453
708,056
13.0
B: Utility Vehicles: Gypsy, Ertiga
27,291
17,316
57.6
21,083
29.4
63,924
49,685
28.7
C: Vans: Omni, Eeco
37,231
33,427
11.4
36,214
2.8
107,581
95,791
12.3
Total Domestic
342,995
295,202
16.2
323,269
6.1
971,958
853,532
13.9
Total Exports
31,187
28,709
8.6
30,066
3.7
96,888
92,171
5.1
Total Volume
374,182
323,911
15.5
353,335
5.9
1,068,846
945,703
13.0
Source: Company, Angel Research
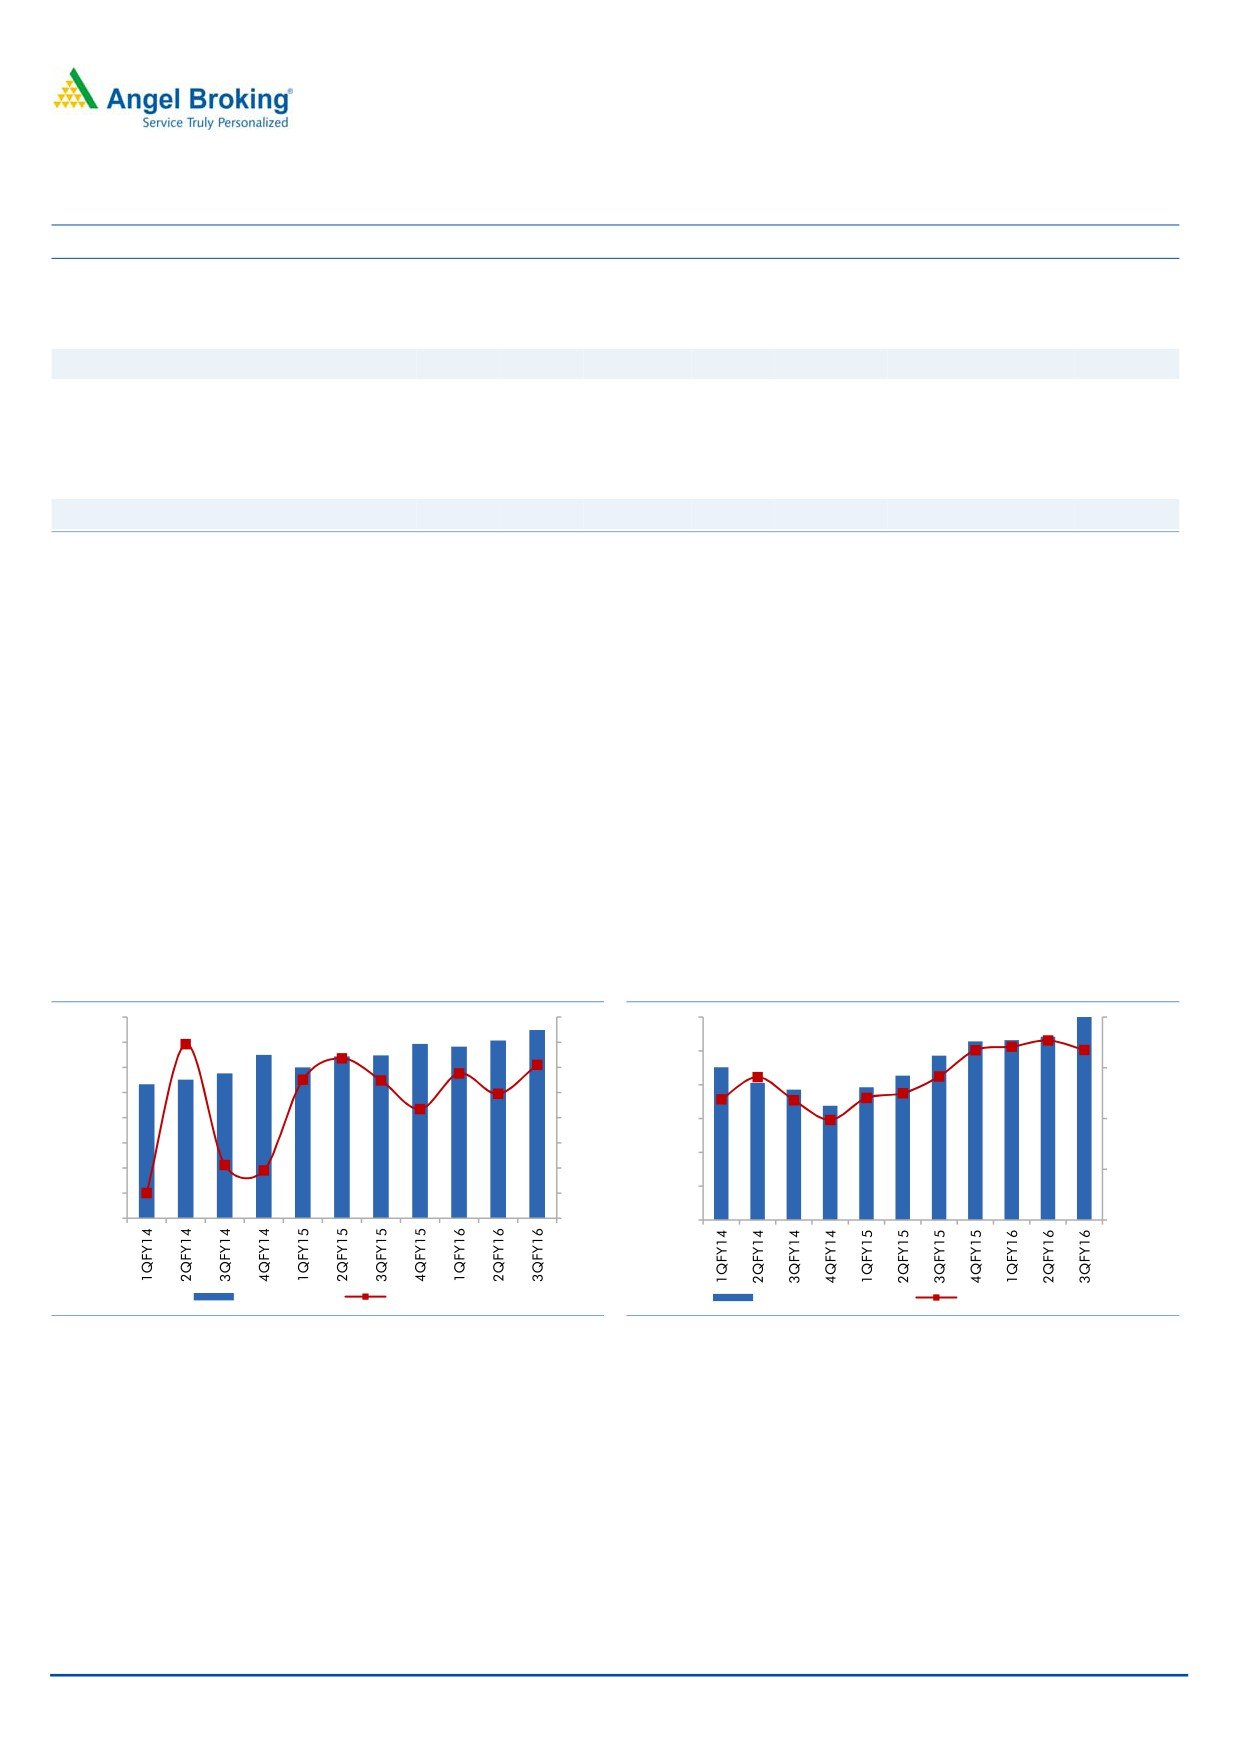
MSIL maintained its outperformance during the quarter, reporting a robust
double-digit volume growth. Improved consumer sentiments, strong festive
demand coupled with declining fuel prices boosted sales.
Realisation/vehicle grew 4% yoy owing to a better product mix with higher
volumes of Baleno, Ertiga and Celerio. Further, the Contribution/vehicle
improved sharply by 9% due to soft commodity prices and a better product
mix.
MSIL continued to outperform the domestic passenger vehicle industry,
registering a growth of 14% yoy in 9MFY2016 as compared to industry growth
of 9%. Consequently, MSIL’s market share improved from 45% in 9MFY2015
to 47% in 9MFY2016.
Exhibit 4: Volumes maintain double-digit growth
Exhibit 5: Realisation & contribution per vehicle
400,000
25
390,000
140,000
350,000
20
380,000
300,000
15
120,000
370,000
250,000
10
200,000
5
360,000
100,000
150,000
0
350,000
100,000
(5)
80,000
340,000
50,000
(10)
0
(15)
330,000
60,000
Volumes (units)
growth yoy (%)
Realisation/vehicle (LHS)
Contribution/vehicle (RHS)
Source: Company, Angel Research
Source: Company, Angel Research
January 30, 2016
3
Maruti Suzuki | 3QFY2016 Result Update
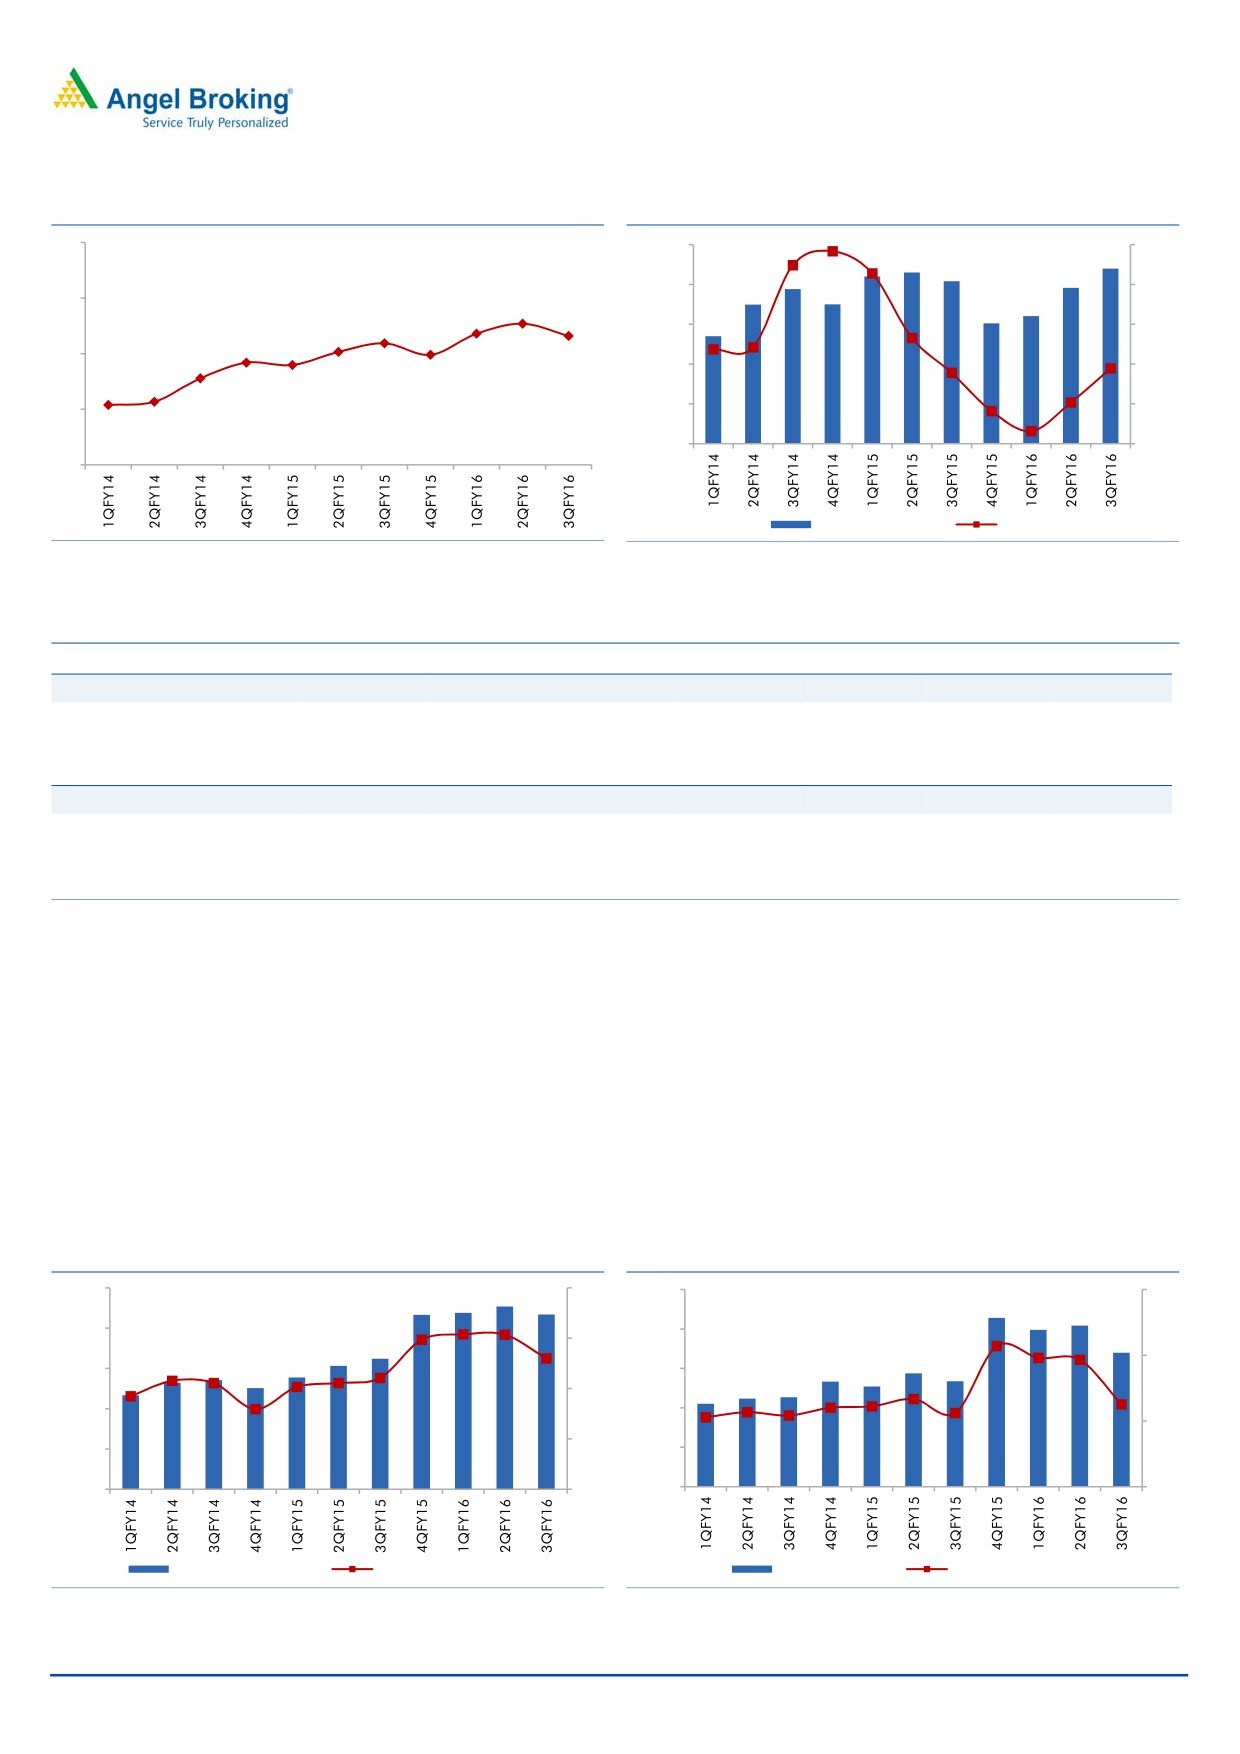
Exhibit 6: Domestic PV market share trend
Exhibit 7: Festive season leads to increased discounts
55
25,000
70
20,000
50
50
47.7
46.8
46.6
45.9
15,000
30
45.2
44.9
44.2
44.0
45
42.8
10,000
10
40.4
40.7
40
5,000
(10)
0
(30)
35
Discounting/vehicle
Growth (%)
Source: SIAM, Angel Research
Source: Company, Angel Research
Exhibit 8: Quarterly revenue and realization performance
1QFY2015
2QFY2015
3QFY2015
4QFY2015 1QFY2016 2QFY2016 3QFY2016
Domestic revenue (` cr)
9,831
10,595
11,039
12,070
11,694
12,447
13,523
Change yoy (%)
8.2
21.9
13.9
12.8
19.0
17.5
22.5
Domestic realization (`)
363,228
368,294
373,952
380,539
382,550
385,029
394,254
Change yoy (%)
(1.9)
2.3
3.5
6.2
5.3
4.5
5.4
Export revenue (` cr)
1,243
1,401
1,224
1,203
1,384
1,128
1,245
Change yoy (%)
37.0
(7.8)
31.8
7.2
11.3
(19.5)
1.7
Export realization (`)
424,943
409,517
426,347
407,217
388,382
375,175
399,205
Change yoy (%)
(1.2)
(8.3)
(8.4)
(4.6)
(8.6)
(8.4)
(6.4)
Source: Company, Angel Research
MSIL margins dipped sequentially by 190 bp yoy to 14.4%. The margins were
impacted by a one off items to the tune of `175 crores (`150 cr on account of
inventory decretion and `25 cr due to higher employee expenses due to
higher bonus declared retrospectively for 21 months). Adjusted for the one off
items, the operating margins stood at 15.5%.
Dip in the operating performance impacted profitability. Also, lower other
income at `32 cr as against `102 cr in the corresponding period last year. The
net profit at `1,019 cr came in lower than our estimate of `1,270 cr.
Exhibit 9: EBITDA margin dips sequentially
Exhibit 10: PAT impacted by margin decline
2,500
20
1,500
12
1,200
2,000
16
9
1,500
900
12
1,000
600
6
8
500
300
0
4
0
3
EBIDTA (`cr; LHS)
EBIDTA Margin (%; RHS)
PAT (`cr; LHS)
PAT Margin (%; RHS)
Source: Company, Angel Research
Source: Company, Angel Research
January 30, 2016
4
Maruti Suzuki | 3QFY2016 Result Update
Conference call - Key highlights
The PV industry is witnessing shift towards the petrol segment given the
narrowing gap between petrol and diesel fuel prices and recent ban on sales
of diesel vehicles with engine capacity above 2,000 cc in the NCR region. The
share of the petrol vehicles has gone up from 54% in 9M FY15 to 56% in
9MFY16. MSIL diesel vehicles form 32% of the overall MSIL portfolio
MSIL continues to gain market share on back of new launches. The recently
launched Baleno and refreshes of Ertiga enabled MSIL to outpace industry
growth. During 9M FY2016, MSIL market share improved to 47% from 45%
levels in 9MFY2015
MSIL discounting per vehicle in 3QFY2016 increased to about
`22,000/vehicle from `19,500/vehicle level in 2QFY2016. Festive season
coupled with higher discounting on diesel vehicles led to increase in the
discounts. MSIL expects the discounting to remain high in the near term
MSIL indicated the currency exposure (Yen to INR) is likely to stay in the 21-
22% of the sales bracket in the near term. Further localization of raw materials
is likely to take time.
MSIL is operating at more than 90% of the capacity utilization currently.
However the management indicated that debottlenecking of the plant can lead
to 8-10% capacity increases before the Gujarat plant comes onstream in
FY2018.
MSIL has witnessed strong acceptance of the AMT technology. AMT is now
available in Alto as well as the Wagon R models. MSIL has increased the AMT
capacity from 4,000/month in FY2015 to about 10,000/month currently and
can further scale up capacity depending on the demand.
MSIL believes that a large chunk of the commodity benefits have already been
accrued. MSIL expects stable commodity prices going ahead and no further
benefits are expected from commodity softness.
MSIL is aggressively expanding the premium distribution network “Nexa”. MSIL
has so far set up 100 Nexa showrooms and aims to reach 200 showrooms by
end of FY2017.
MSIL has guided for overall capex of `3,000 cr for FY2016.
January 30, 2016
5
Maruti Suzuki | 3QFY2016 Result Update
Investment arguments
Per capita car penetration near inflexion point: In FY2012, passenger vehicle
penetration in India was estimated at around 16 vehicles/1,000 people
compared to around 70 vehicles/1,000 people in China. Moreover, India’s
PPP-based per capita is estimated to approach US$7,000 over the next four to
five years, which is expected to be the inflexion point for the country’s car
demand. Further, MSIL has a sizeable competitive advantage over new foreign
entrants due to its widespread distribution network (nearly 3,000 and 1,200
service and sales outlets, respectively), which is not easy to replicate.
Product launches in new segments to help outpace the PV industry: MSIL is
targeting to launch products in new segments in order to outgrow the
passenger vehicle industry. MSIL would introduce products in the compact
utility vehicle space which currently accounts for about 10% of the industry
volumes. Also, MSIL would introduce crossovers (vehicles combining features
of a car and a SUV) which would further enable it to gain market share.
Merger with SPIL to be a positive in the long run: MSIL has merged its
associate company, Suzuki Powertrain India (SPIL) with itself. SPIL
manufactures and supplies diesel engines and transmission components for
vehicles. SPIL currently supplies ~90% of its production to MSIL. We believe
the merger of SPIL with MSIL is a positive for MSIL given that MSIL itself is
setting up a new diesel engine facility (capacity of 300,000 units by FY2015)
in Gurgaon. Further, with increased product introductions in the diesel
segment (LCV and compact utility vehicle), the integration of SPIL will result in
better control over diesel engine sourcing, flexibility in production planning,
and managing fluctuations in market demand. Additionally, single
management control of diesel engine operations will result in better sourcing,
localization, and cost-reduction.
January 30, 2016
6
Maruti Suzuki | 3QFY2016 Result Update
Outlook and valuation
The passenger vehicle (PV) industry is well poised to post double-digit growth over
the next two years, given the improved consumer sentiments, better economic
outlook, and softer fuel prices. Given the new launches, MSIL is likely to retain its
market share despite increased competitive intensity. However, MSIL margins are
likely to tread down in FY2017 from the record 1HFY2016 levels given the
increased sales promotion expenses due to new launches and the recent
appreciation of JPY vis a vis INR which would increase the raw material and the
royalty expenses. At CMP, MSIL is trading at P/E of 25.6x and 19.4x its FY2016
and FY2017 earnings respectively, leaving no scope of meaningful upside from
current levels. Hence, we maintain our Neutral rating on the stock.
Exhibit 11: Volume assumptions
Y/E March
FY2011
FY2012
FY2013
FY2014
FY2015
FY2016E
FY2017E
Mini: M800, Alto, WagonR
573,238
491,389
429,569
436,032
425,742
456,743
484,330
Compact: Swift, Ritz, Celerio, Dzire
369,754
345,886
424,873
450,393
514,638
586,687
657,090
Compact Utility Vehicle
36,000
Mid-Size: Ciaz
23,317
17,997
6,707
4,029
33,151
48,000
54,000
Executive: Kizashi
138
458
188
1
-
-
-
Total passenger cars
966,447
855,730
861,337
890,455
973,531
1,091,430
1,231,420
UV - Gypsy, Vitara, Ertiga, S-Cross
5,666
6,525
79,192
61,119
68,198
88,657
97,523
Vans - Omni, Versa, Eeco
160,626
144,061
110,517
102,115
128,973
141,870
156,057
Total passenger vehicles - domestic
1,132,739
1,006,316
1,051,046
1,053,689
1,170,702
1,321,958
1,485,000
Total passenger vehicles - exports
138,266
127,379
120,388
101,352
121,713
129,888
146,000
Light Commercial Vehicle
21,000
Total sales (domestic + exports)
1,271,005
1,133,695
1,171,434
1,155,041
1,292,415
1,451,846
1,652,000
% chg
24.8
(10.8)
3.3
(1.4)
11.9
12.3
13.8
Source: Company, Angel Research
Company background
Maruti Suzuki (MSIL), a subsidiary of Suzuki Motor Corporation (SMC), Japan
(which holds a 56% stake in MSIL), is the largest passenger car company in India,
accounting for ~50% of the domestic passenger car market. MSIL derives ~60%
of its overall sales from the small car segment and has a dominant position in the
segment with a market share of ~50%, led by popular models like Alto, Wagon R,
Celerio and Swift. The company operates from two facilities in India (Gurgaon and
Manesar) with an installed capacity of 1.5mn units. Also, MSIL has steadily
increased its presence internationally and exports now account for ~10% of its
overall sales volume.
January 30, 2016
7
Maruti Suzuki | 3QFY2016 Result Update
Profit and loss statement (post SPIL merger)
Y/E March (` cr)
FY2012
FY2013
FY2014
FY2015
FY2016E
FY2017E
Total operating income
35,587
43,588
43,701
49,971
58,365
69,070
% chg
(2.8)
22.5
1.4
14.3
16.8
18.3
Total expenditure
33,074
39,358
38,611
43,268
49,324
58,365
Net raw material costs
28,108
32,559
31,314
35,008
39,407
46,324
Employee expenses
844
1,070
1,368
1,607
1,892
2,194
Other expenditure
4,122
5,730
5,928
6,654
8,024
9,847
EBITDA
2,513
4,230
5,090
6,703
9,041
10,706
% chg
(30.9)
68.3
44.8
31.5
34.9
18.4
(% of total op. income)
7.1
9.7
11.6
13.4
15.5
15.5
Depreciation & amort.
1,138
1,861
2,084
2,470
2,813
3,130
EBIT
1,375
2,368
3,834
5,074
6,869
8,599
% chg
(47.6)
72.3
27.7
32.3
35.4
25.2
(% of total op. income)
3.9
5.4
8.8
10.2
11.8
12.4
Interest and other charges
55
190
176
206
106
100
Other income
827
812
829
842
641
1023
Recurring PBT
2,146
2,991
3,659
4,868
6,763
8,499
% chg
(31.0)
39.4
27.7
33.1
38.9
25.7
Extraord. income/ (exp.)
-
-
-
PBT
2,146
2,991
3,659
4,868
6,763
8,499
Tax
511
599
876
1,157
1,925
2,125
(% of PBT)
23.8
20.0
23.9
23.8
28.5
25.0
PAT (reported)
1,635
2,392
2,783
3,711
4,838
6,374
ADJ. PAT
1,635
2,392
2,783
3,711
4,838
6,374
% chg
(28.6)
46.3
21.0
33.4
30.4
31.8
(% of total op. income)
4.6
5.5
6.4
7.4
8.3
9.2
Basic EPS (`)
54.1
79.2
92.1
122.9
160.1
211.0
Adj. EPS (`)
54.1
79.2
92.1
122.9
160.1
211.0
% chg
(28.6)
46.3
15.8
33.4
30.4
31.8
January 30, 2016
8
Maruti Suzuki | 3QFY2016 Result Update
Balance sheet statement (post SPIL merger)
Y/E March (` cr)
FY2012
FY2013
FY2014
FY2015
FY2016E FY2017E
SOURCES OF FUNDS
Equity share capital
145
151
151
151
151
151
Reserves & surplus
15,043
18,428
20,827
23,553
26,940
31,401
Shareholders’ Funds
15,187
18,579
20,978
23,704
27,091
31,552
Total loans
1,078
1,389
1,685
180
200
200
Deferred tax liability
302
409
587
481
587
587
Other long term liabilities
97
104
239
105
105
105
Long term provisions
169
226
198
293
198
198
Total Liabilities
16,834
20,706
23,686
24,763
28,181
32,642
APPLICATION OF FUNDS
Gross block
14,735
19,801
22,702
26,462
29,962
33,712
Less: Acc. depreciation
7,214
10,002
11,911
14,202
17,016
20,146
Net Block
7,521
9,799
10,790
12,259
12,946
13,566
Capital work-in-progress
942
1,942
2,621
1,883
2,500
2,500
Investments
6,147
7,078
10,118
12,814
9,849
10,849
Long term loans and adv.
1,341
1,279
1,638
1,349
1,992
2,353
Other noncurrent assets
26
895
9
44
44
44
Current assets
6,325
5,695
5,359
5,202
8,801
12,491
Cash
2,436
775
630
18
3,238
5,982
Loans & advances
778
1,115
1,251
1,173
1,590
1,870
Other
3,111
3,805
3,478
4,010
3,973
4,639
Current liabilities
5,468
5,982
6,849
8,788
7,951
9,160
Net current assets
857
(287)
(1,491)
(3,586)
850
3,331
Total Assets
16,834
20,706
23,686
24,763
28,181
32,642
Note: Cash and bank balance includes term deposits with banks
January 30, 2016
9
Maruti Suzuki | 3QFY2016 Result Update
Cash flow statement (post SPIL merger)
Y/E March (` cr)
FY2012
FY2013
FY2014
FY2015
FY2016E FY2017E
Profit before tax
2,146
2,991
3,659
4,868
6,763
8,499
Depreciation
1,138
1,861
1,910
2,291
2,813
3,130
Change in working capital
227
512
2,112
1,440
(1,216)
263
Direct taxes paid
(251)
(533)
(876)
(1,157)
(1,925)
(2,125)
Others
(700)
(447)
(242)
154
(631)
(361)
Cash Flow from Operations
2,560
4,384
6,563
7,596
5,803
9,406
(Inc.)/Dec. in fixed assets
(2,963)
(3,810)
(3,580)
(3,021)
(4,117)
(3,750)
(Inc.)/Dec. in investments
(782)
(916)
(3,040)
(2,687)
2,966
(1,000)
Others
649
1,152
-
-
-
-
Cash Flow from Investing
(3,096)
(3,574)
(6,620)
(5,708)
(1,152)
(4,750)
Issue of equity
-
-
-
-
-
-
Inc./(Dec.) in loans
911
(514)
296
(1,505)
20
-
Dividend paid (Incl. Tax)
(217)
(217)
(696)
(884)
(1,451)
(1,912)
Others
(78)
(235)
312
(101)
-
-
Cash Flow from Financing
617
(966)
(88)
(2,388)
(1,432)
(1,912)
Inc./(Dec.) in cash
81
(156)
(145)
(501)
3,220
2,744
Opening Cash balances
96
281
775
630
18
3,238
Closing Cash balances
176
125
630
18
3,238
5,982
Note: Closing Cash balances excludes term deposits with banks and unclaimed dividend accounts
January 30, 2016
10
Maruti Suzuki | 3QFY2016 Result Update
Key ratios
Y/E March
FY2012
FY2013
FY2014
FY2015
FY2016E
FY2017E
Valuation Ratio (x)
P/E (on FDEPS)
75.7
51.5
44.5
33.3
25.6
19.4
P/CEPS
44.6
32.1
25.4
20.0
16.2
11.5
P/BV
8.1
6.4
5.9
5.2
4.6
3.4
Dividend yield (%)
0.2
0.2
0.3
0.6
1.2
1.5
EV/Sales
3.3
2.8
2.7
2.4
1.9
1.6
EV/EBITDA
44.0
33.9
22.8
18.0
12.5
10.2
EV / Total Assets
7.0
5.8
4.9
4.9
4.0
3.3
Per Share Data (`)
EPS (Basic)
54.1
79.6
92.1
122.9
160.1
211.0
EPS (fully diluted)
54.1
79.6
92.1
122.9
160.1
211.0
Cash EPS
91.8
127.5
161.1
204.6
253.3
314.6
DPS
7.5
8.4
12.0
25.0
48.0
63.3
Book Value
502.8
643.1
694.5
784.7
896.8
1,044.5
Returns (%)
ROCE (Pre-tax)
8.8
14.7
16.2
20.5
24.4
26.3
Angel ROIC (Pre-tax)
18.3
15.2
16.6
20.5
27.5
32.3
ROE
11.3
12.4
13.3
15.7
17.9
20.2
Turnover ratios (x)
Asset Turnover (Gross Block)
2.7
2.2
1.9
1.9
1.9
2.0
Inventory / Sales (days)
16
16
14
19
13
12
Receivables (days)
9
12
12
8
11
11
Payables (days)
37
45
52
54
45
43
WC cycle (ex-cash) (days)
(12)
(18)
(26)
(27)
(21)
(20)
Solvency ratios (x)
Net debt to equity
(0.5)
(0.3)
(0.4)
(0.5)
(0.5)
(0.5)
Net debt to EBITDA
(3.0)
(1.8)
(1.8)
(1.9)
(1.4)
(1.6)
Interest Coverage (EBIT / Int.)
24.9
22.0
21.8
24.6
64.7
86.0
January 30, 2016
11
Maruti Suzuki | 3QFY2016 Result Update
Research Team Tel: 022 - 39357800
DISCLAIMER
Angel Broking Private Limited (hereinafter referred to as “Angel”) is a registered Member of National Stock Exchange of India Limited,
Bombay Stock Exchange Limited and Metropolitan Stock Exchange of India Limited. It is also registered as a Depository Participant with
CDSL and Portfolio Manager with SEBI. It also has registration with AMFI as a Mutual Fund Distributor. Angel Broking Private Limited is
a registered entity with SEBI for Research Analyst in terms of SEBI (Research Analyst) Regulations, 2014 vide registration number
INH000000164. Angel or its associates has not been debarred/ suspended by SEBI or any other regulatory authority for accessing
/dealing in securities Market. Angel or its associates including its relatives/analyst do not hold any financial interest/beneficial
ownership of more than 1% in the company covered by Analyst. Angel or its associates/analyst has not received any compensation /
managed or co-managed public offering of securities of the company covered by Analyst during the past twelve months. Angel/analyst
has not served as an officer, director or employee of company covered by Analyst and has not been engaged in market making activity
of the company covered by Analyst.
This document is solely for the personal information of the recipient, and must not be singularly used as the basis of any investment
decision. Nothing in this document should be construed as investment or financial advice. Each recipient of this document should
make such investigations as they deem necessary to arrive at an independent evaluation of an investment in the securities of the
companies referred to in this document (including the merits and risks involved), and should consult their own advisors to determine
the merits and risks of such an investment.
Reports based on technical and derivative analysis center on studying charts of a stock's price movement, outstanding positions and
trading volume, as opposed to focusing on a company's fundamentals and, as such, may not match with a report on a company's
fundamentals.
The information in this document has been printed on the basis of publicly available information, internal data and other reliable
sources believed to be true, but we do not represent that it is accurate or complete and it should not be relied on as such, as this
document is for general guidance only. Angel Broking Pvt. Limited or any of its affiliates/ group companies shall not be in any way
responsible for any loss or damage that may arise to any person from any inadvertent error in the information contained in this report.
Angel Broking Pvt. Limited has not independently verified all the information contained within this document. Accordingly, we cannot
testify, nor make any representation or warranty, express or implied, to the accuracy, contents or data contained within this document.
While Angel Broking Pvt. Limited endeavors to update on a reasonable basis the information discussed in this material, there may be
regulatory, compliance, or other reasons that prevent us from doing so.
This document is being supplied to you solely for your information, and its contents, information or data may not be reproduced,
redistributed or passed on, directly or indirectly.
Neither Angel Broking Pvt. Limited, nor its directors, employees or affiliates shall be liable for any loss or damage that may arise from
or in connection with the use of this information.
Note: Please refer to the important ‘Stock Holding Disclosure' report on the Angel website (Research Section). Also, please refer to the
latest update on respective stocks for the disclosure status in respect of those stocks. Angel Broking Pvt. Limited and its affiliates may
have investment positions in the stocks recommended in this report.
Disclosure of Interest Statement
Maruti Suzuki
1. Analyst ownership of the stock
No
2. Angel and its Group companies ownership of the stock
No
3. Angel and its Group companies' Directors ownership of the stock
No
4. Broking relationship with company covered
No
Note: We have not considered any Exposure below ` 1 lakh for Angel, its Group companies and Directors
Ratings (Based on expected returns
Buy (> 15%)
Accumulate (5% to 15%)
Neutral (-5 to 5%)
over 12 months investment period):
Reduce (-5% to -15%)
Sell (< -15)
January 30, 2016
12