1QFY2018 Result Update | Automobile
July 28, 2017
Maruti Suzuki
ACCUMULATE
CMP
`7,622
Performance Highlights
Target Price
`8,501
Y/E March (` cr)
1QFY18 1QFY17
% chg (yoy)
4QFY17
% chg (qoq)
Investment Period
12 Months
Net Sales
17,546
14,945
17.4
18,333
-4.3
Stock Info
EBITDA
2,331
2,215
5.3
2,560
-8.9
Sector
Automobile
EBITDA Margin (%)
13.3
14.8
-153 bp
14.0
-67 bp
Market Cap (` cr)
230,244
Adj. PAT
1,556
1,491
4.4
1,711
-9.0
Net Debt (` cr)
(1,543)
Source: Company, Angel Research
Beta
1.2
Result impacted due to material cost, compensation: MSIL’s 1QFY18 earnings
52 Week High / Low
7,679/4,570
and margins were below the cons. estimates. Net sales were at `17,546cr while
Avg. Daily Volume
55,788
PAT was at `2,331cr. Net sales, EBITDA and PAT grew by 17.4% / 5.3% 4.4% on
Face Value (`)
5
yoy basis and were 0.3%/-6.8%/-7.9% against the consensus estimates. While
BSE Sensex
32,310
PAT has grown by 4.4% to `1,556 in the quarter, there is `85cr component on
Nifty
10,014
one-off write backs. Adjusted for the one off item PAT could have been higher.
Reuters Code
MRTI.BO
EBITDA margins decline by 153bps: EBITDA was at `2,331cr, up 5.3% yoy
Bloomberg Code
MSIL@IN
however margins came in at 13.3% vs. 14.8% in 1QFY17 which. Staff cost
grew by 12.6% yoy due to the salary revision while other expenses were up
Shareholding Pattern (%)
13.9% yoy. The margin decline mainly occurred as this quarter soaked in the
Promoters
56.2
GST related one time compensation costs (~50bps), higher material costs and
higher promotional expenses (~30bps). If adjusted for these items, actual
MF / Banks / Indian Fls
11.8
margins would be higher than reported margins by ~80bps.
FII / NRIs / OCBs
25.0
Indian Public / Others
7.0
Outlook and valuation: MSIL continues to report double digit numbers due to the
strong performance of utility vehicles. Company expects to launch one model
Abs. (%)
3m 1yr
3yr
each year which is likely to sustain its growth momentum in the near term. The
Sensex
7.9
15.5
23.7
order book for the new vehicles remains strong and company has indicated of
Maruti Suzuki
20.3
70.1
204.4
increasing its NEXA outlets to 300 from current 266. We believe that 1QFY18
results are one-off in nature and will not recur. We expect 22%/ 21% CAGR in
revenue and PAT over next two years. At CMP, MSIL is trading at P/E of 21.5x of
3-year price chart
its FY2019E earnings. We value MSIL on 24x of its FY2019E EPS of `354 with a
8000
target price of `8,501 with Accumulate rating on the stock.
7000
6000
Key financials
5000
4000
Y/E March (` cr)
FY2015
FY2016
FY2017E
FY2018E
3000
Net Sales
57,746
68,009
82,443
100,951
2000
% chg
15.9
18.7
21.2
22.7
1000
0
Net Profit
4,571
7,344
8,629
10,698
% chg
23.2
60.6
17.5
24.0
OPM (%)
15.9
15.4
15.3
15.2
Source: Company, Angel Research
EPS (Rs)
151.4
243.2
285.7
354.2
P/E (x)
50.4
31.3
26.7
21.5
P/BV (x)
8.5
7.2
5.9
4.8
RoE (%)
16.9
22.9
22.0
22.2
RoCE (%)
22.6
23.8
24.1
24.2
EV/Sales (x)
3.7
3.1
2.5
1.9
Shrikant Akolkar
EV/EBITDA (x)
23.7
20.2
16.4
12.8
022-3935 7800 Ext: 6846
Source: Company, Angel Research
Please refer to important disclosures at the end of this report
1
Maruti Suzuki | 1QFY2018 Result Update
Exhibit 1: Quarterly financial performance
Y/E March (` cr)
1QFY18
1QFY17
% chg (yoy)
4QFY17
% chg (qoq)
Net Sales
17,546
14,945
17.4
18,333
-4.3
Raw-material cost
12,288
10,154
21.0
12,767
-3.7
(% of Sales)
70.0
67.9
69.6
Staff cost
652
579
12.6
616
5.9
(% of Sales)
3.7
3.9
3.4
Other Expenses
2,274
1,997
13.9
2,391
-4.9
(% of Sales)
13.0
13.4
13.0
Total Expenditure
15,215
12,730
19.5
15,774
-3.5
Operating Profit
2,331
2,215
5.3
2,560
-8.9
OPM (%)
13.3
14.8
14.0
Interest
31
18
72.9
23
38.5
Depreciation
684
638
7.2
701
-2.4
Other Income
683
488
39.9
449
52.0
PBT (excl. Extr. Items)
2,299
2,047
12.3
2,285
0.6
Extr. Income/(Expense)
0
0
0
PBT (incl. Extr. Items)
2,299
2,047
12.3
2,285
0.6
(% of Sales)
13.1
13.7
12.5
Provision for Taxation
742
556
33.5
575
29.2
(% of PBT)
32.3
27.2
25.1
Reported PAT
1,556
1,491
4.4
1,711
-9.0
Adj PAT
1,556
1,491
4.4
1,711
-9.0
Adj. PATM
8.9
10.0
9.3
Equity capital (cr)
151
151
151
Reported EPS (`)
51.5
49.4
4.4
56.6
-9.0
Source: Company, Angel Research
July 28, 2017
2
Maruti Suzuki | 1QFY2018 Result Update
Exhibit 2: Quarterly volume performance
Volume (units)
Q1FY18
Q1FY17
% chg (yoy)
Q4FY17
% chg (qoq)
A: Mini: Alto, WagonR
103,510
92,723
11.6
101,980
1.5
A: Compact: Swift, Ritz, Celerio, Dzire, Baleno
155,314
140,021
10.9
170,259
-8.8
A: Mid-Size: Ciaz
15,698
13,690
14.7
17,334
-9.4
Total Passenger cars
274,522
246,434
11.4
289,573
-5.2
B: Utility Vehicles: Gypsy, Ertiga
57,125
39,348
45.2
52,487
8.8
C: Vans: Omni, Eeco
35,739
36,558
-2.2
40,002
-10.7
D: LCV
1,045
0
606
Total Domestic (includes LCV)
368,431
322,340
14.3
382,668
-3.7
Total Exports
26,140
26,103
0.1
31,771
-17.7
Total Volume
394,571
348,443
13.2
414,439
-4.8
Source: Company, Angel Research
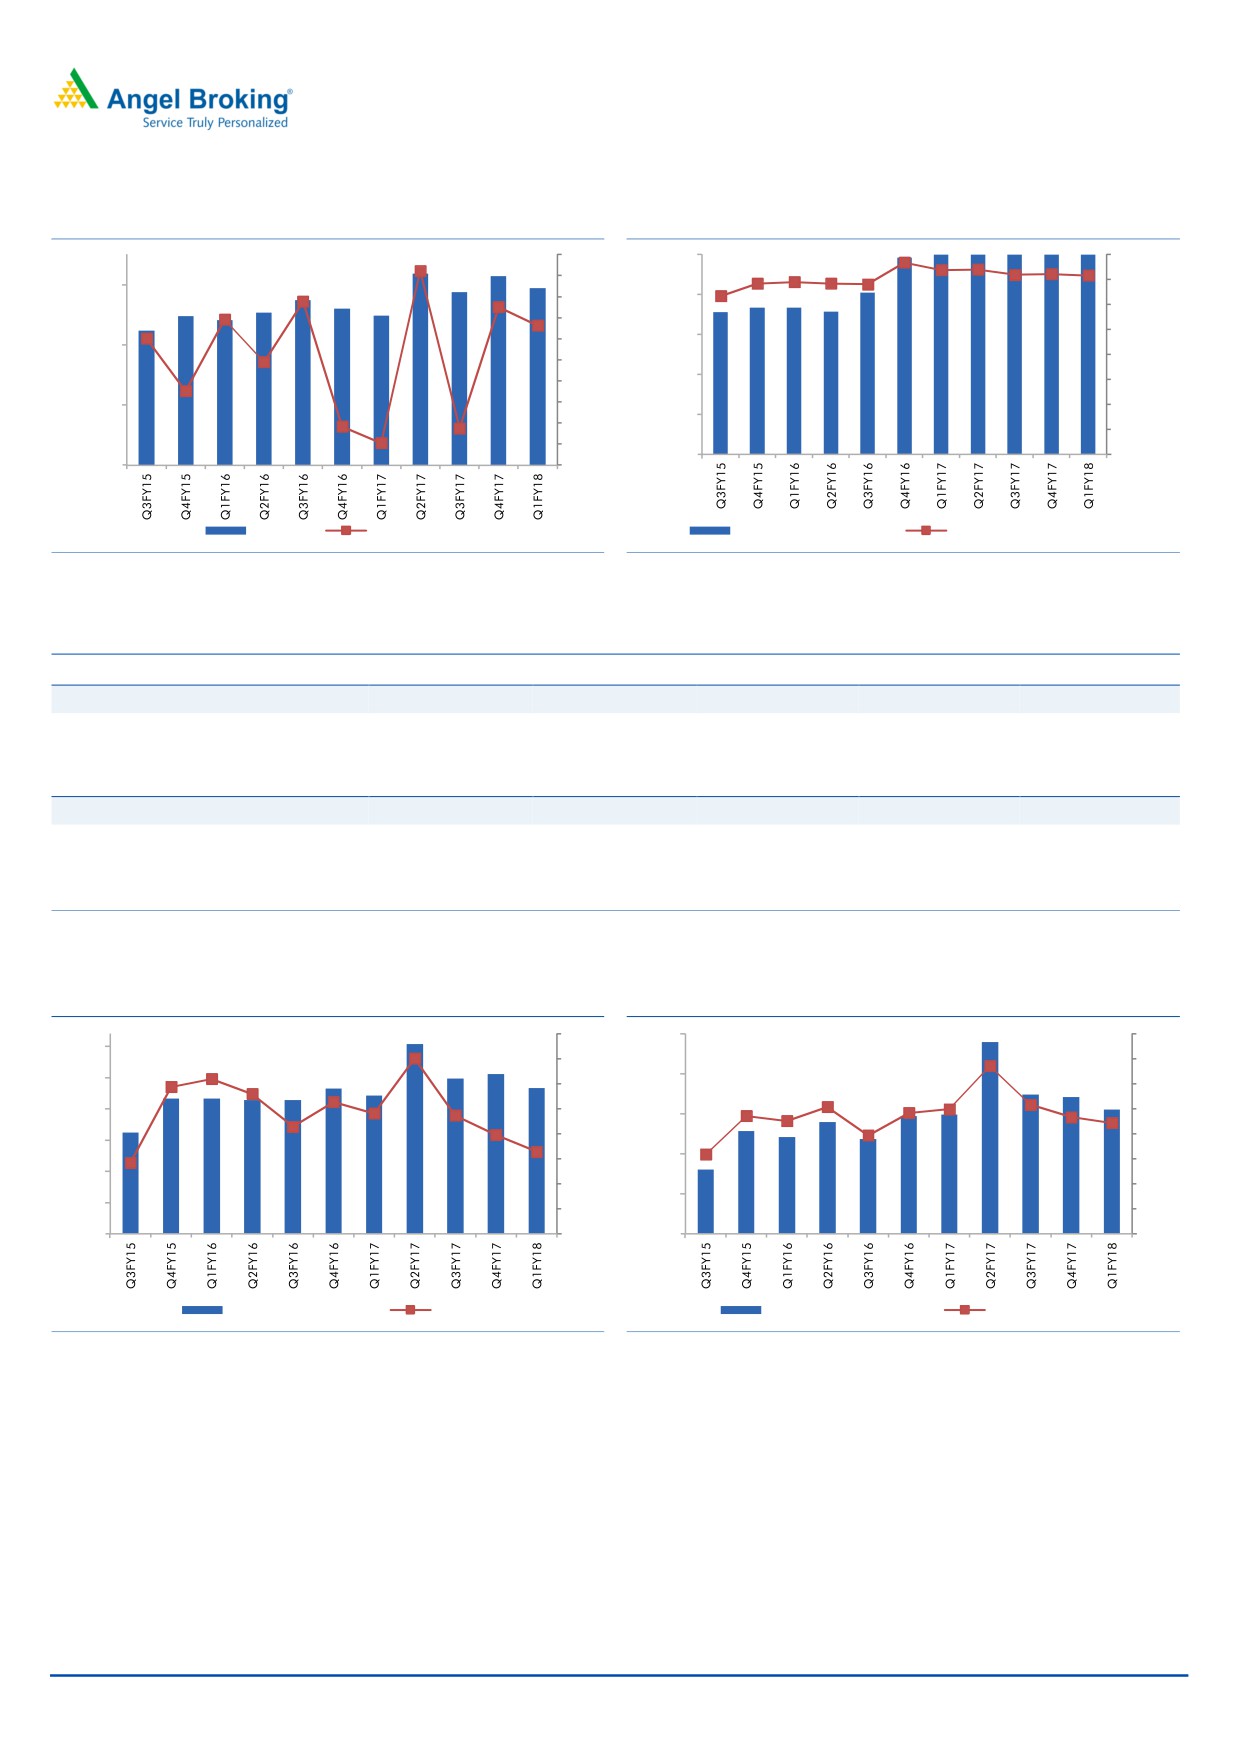
Net realizations during the quarter were at `434,203 vs. `421,475 in
1QFY17 and `434,448 in 4QFY17. Realization growth was 3% on yoy basis.
As a result of increase in the commodity prices, material costs per vehicle
inched up 6.9% yoy which led to decline in the margins.
Domestic volumes grew by 14.3% yoy while exports growth was flat. Total
volumes during the quarter were at 394,571 showing a yoy growth of 13.2%.
Mini/compact/midsize vehicles grew by 11.6%/17.5%/14.7% yoy.
UVs grew by 45.2% yoy, indicating a sustained momentum of growth in this
range.
During the quarter, company sold 1,045 LCVs compared to 606 LCVs in
4QFY17. LCVs sales were started in 2QFY17.
Company continues to outperform the industry growth. During the quarter
industry growth was 4.8% while company growth was at 14.3%.
During the quarter company paid royalty of `886cr, or 5.2% of net sales vs.
6.1% of net sales in Q2FY17.
Company is targeting millennial group (age group 18-28) as potential
customers for newly launched hatchback Ignis
July 28, 2017
3
Maruti Suzuki | 1QFY2018 Result Update
Exhibit 3: Growth slows due to demonetisation
Exhibit 4: Realisation & contribution per vehicle
20.0
425,000
150,000
18.0
130,000
400,000
16.0
400,000
110,000
14.0
375,000
90,000
12.0
300,000
10.0
70,000
350,000
8.0
50,000
200,000
6.0
30,000
325,000
4.0
10,000
2.0
300,000
-10,000
100,000
0.0
Volumes
yoy growth (%)
Net realization (`)
Contribution / Vehicle (`)
Source: Company, Angel Research
Source: Company, Angel Research
Exhibit 5: Quarterly revenue and realization performance
Q1FY17
Q2FY17
Q3FY17
Q4FY17
*Q1FY18
Domestic revenue (` cr)
13,334
16,030
15,041
16,505
15,632
Change yoy (%)
13.98
29.69
11.09
21.52
17.24
Domestic realization (`)
413,663
418,494
421,893
431,319
424,297
Change yoy (%)
8.10
9.45
6.88
5.87
2.57
Export revenue (` cr)
1,352
1,565
1,583
1,500
1,500
Change yoy (%)
-2.0
38.5
27.1
8.5
10.9
Export realization (`)
517,948
441,591
514,830
472,129
573,833
Change yoy (%)
33.75
17.49
28.96
-7.73
10.79
Source: Company, Angel Research, * Estimates
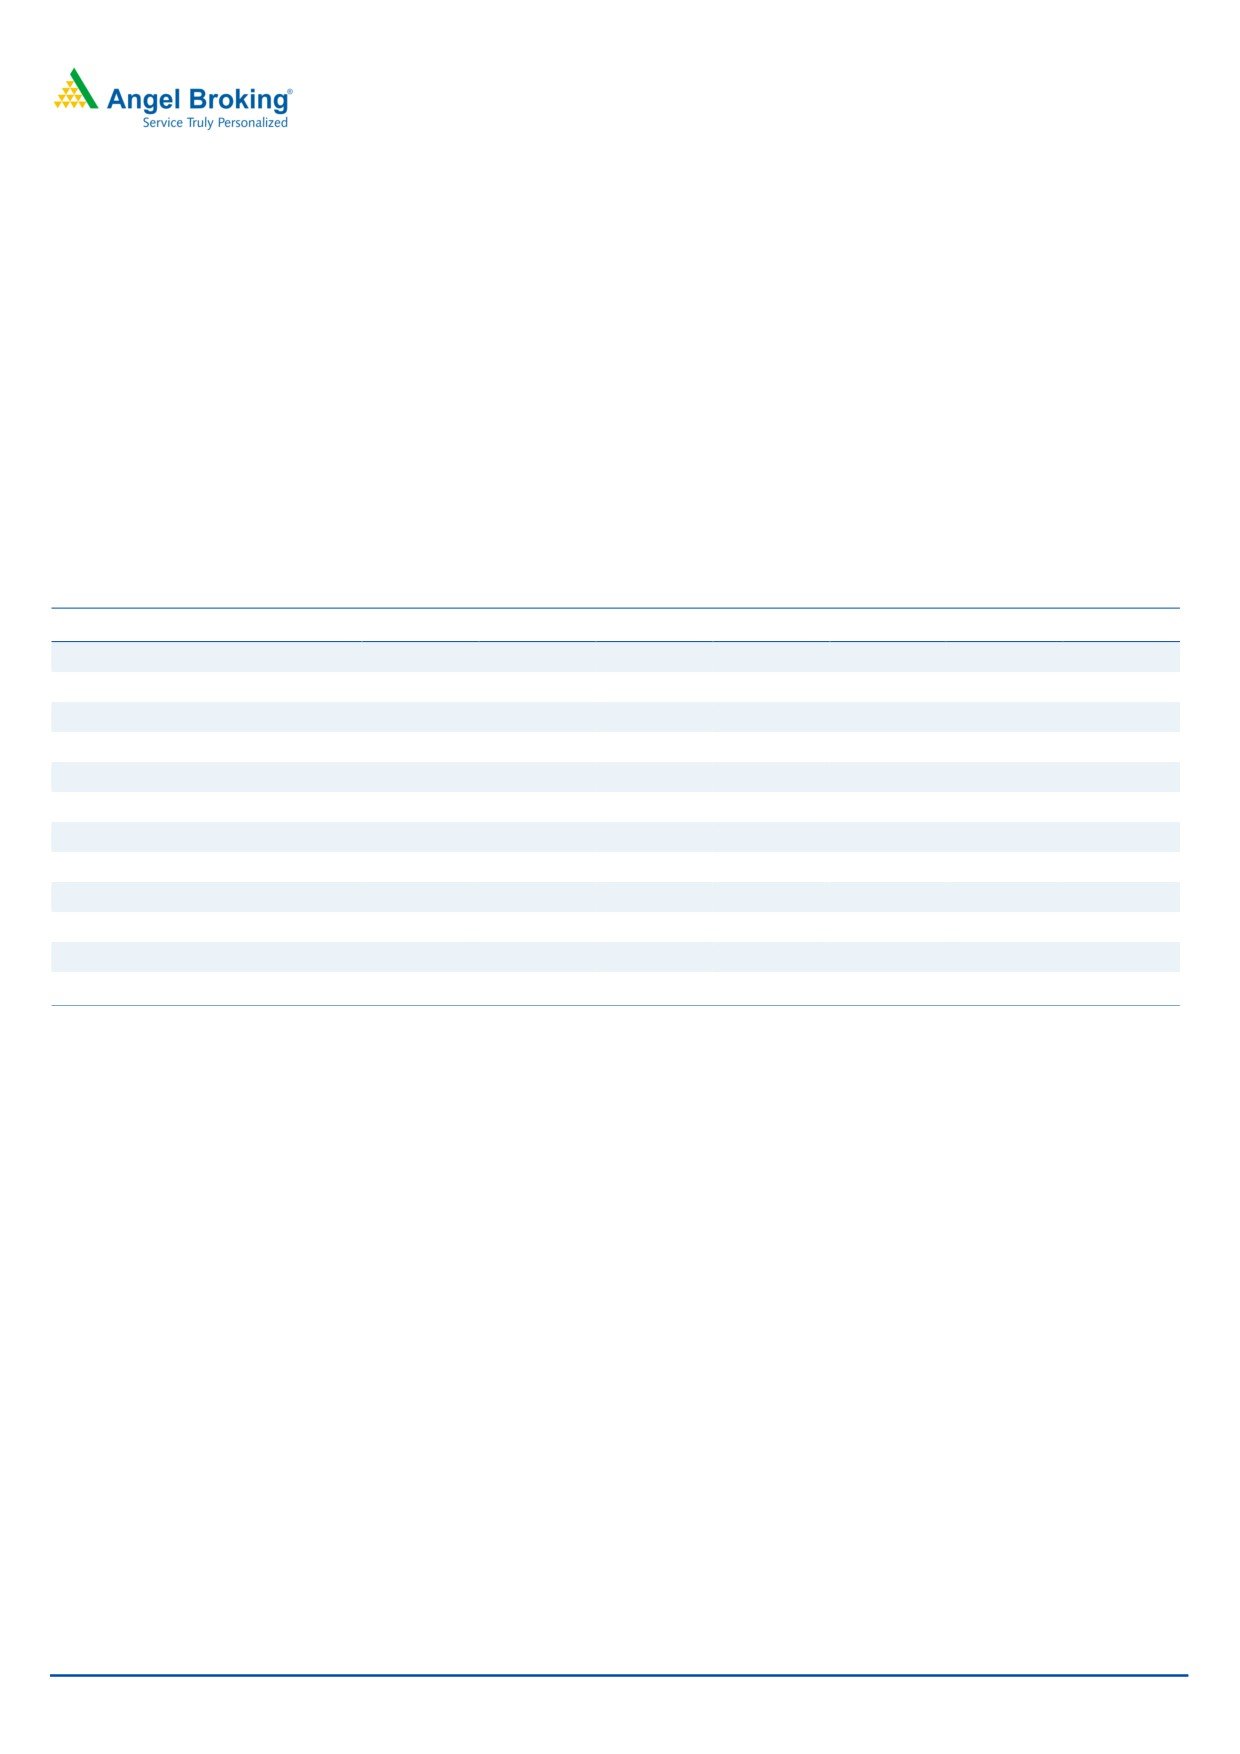
Exhibit 6: EBITDA growth at 16%, margins at 14.8%
Exhibit 7: PAT grows despite demonetisation impact
18.0
2,500
16.0
3,000
17.0
14.0
2,500
2,000
16.0
12.0
2,000
15.0
1,500
10.0
14.0
8.0
1,500
13.0
1,000
6.0
1,000
12.0
4.0
500
500
11.0
2.0
0
10.0
0
0.0
Series1
Series2
Net profit (`cr)
Net margin (%)
Source: Company, Angel Research
Source: Company, Angel Research
July 28, 2017
4
Maruti Suzuki | 1QFY2018 Result Update
Conference call - Key highlights
While the industry grew by 4.8% during the quarter, company grew by 14.3%
implying gain in the market share.
Nexa contributes ~20% of MSIL’s business.
Total discounts during the quarter were at `16,600 vs. 15,194 in 4QFY17 and
`16,800 in 1QFY17.
Company has indicated that demand scenario remains strong and company
will bring more efficiency through cost reduction programs.
During the quarter, company has felt the impact of higher raw material prices,
however expects the steady state of the commodity prices going ahead.
The higher promotional expenses (30bps) and compensation due to the GST
(50bps) contributed in decline in the margins.
The royalty of the new models is still in discussion with Suzuki and company
has not given any clarity at this time.
Company has indicated that the retail sales in June were higher and in the first
ten days of July, there was slowdown in retail sales and demand has see pick
up now.
Company expects ~1.5mn vehicles from the existing two plants and 150,000
vehicles from the Gujarat plant in FY18. It also expects to add second line at
Gujarat plant in 2019.
Company has indicated of ~125,000 export volumes in FY18.
MSIL has guided FY18E full year capex of `4,500cr of which `900cr has been
spend by 1QFY18.
While all vendors have not moved to Gujarat, company expects the same to
change in next three years will all vendors moving to the Gujarat for all the
models that MSIL will assemble at the this plant.
Company has said that Baleno/Dzire /Brezza have 16/16/20 weeks of waiting
period.
July 28, 2017
5
Maruti Suzuki | 1QFY2018 Result Update
Investment arguments
MSIL outperforming the industry: MSIL is the largest passenger car
manufacturer in the country and enjoys a leadership position. MSIL has been
outperforming the industry PV growth. While the industry in volume terms grew
by 3.4% from FY13-FY17, MSIL’s domestic sales grew by 8.3%. Owing to this,
its market share has also grown from ~39% in FY13 to ~50% in early FY18.
With the well timed model launches, entry in premium vehicles, and
nationwide reach, MSIL has achieved this superior growth record. This theme
is likely to continue in our opinion with MSIL maintaining more than 50%
market share.
MSIL expected to gain market share: MSIL’s major product portfolio is more
towards the petrol cars where it enjoys highest market shares among its peers.
The lower petrol prices as well as have benefitted the company and continued
weakness in crude prices is expected to benefit the company by keeping petrol
prices at lower levels. Strong dealership network and improved product mix is
expected to benefit the company in gaining further market share. We also
expect the passenger vehicle penetration to go up in the country which will
help MSIL as it already covers most part of the country through its robust
dealership network.
Easing capacity constraints: MSIL has started production at its Gujarat facility
which currently has a capacity of 150k vehicles per annum. The plant
produced ~24,000 units in the quarter and company expects to increase this
numbers going ahead. It also has plans to add another line at this plant which
will be operational in 2019.
Expansion of Nexa: MSIL launched NEXA a few years ago in order to sales the
premium cars like S-Cross, Baleno, Ciaz, etc. The Nexa dealership has since
grown to 266 outlets and company expects to increase Nexa dealerships to
300. The new cars launched by the company are offered through the Nexa
and the ramp of the same is expected to be positive on its business.
July 28, 2017
6
Maruti Suzuki | 1QFY2018 Result Update
Outlook and valuation
MSIL continues to report double digit numbers due to the strong performance of its
utility vehicles. Company expects to launch one model each year which is likely to
sustain its growth momentum in the near term. The order book for the new
vehicles remains strong and company has indicated of increasing its NEXA outlets
to 300 from current 266. We believe that 1QFY18 results are one off in nature due
to the one-off events. We expect 22%/ 21% CAGR in revenue and PAT over next
two years. At CMP, MSIL is trading at P/E of 21.5x of its FY2019E earnings. We
value MSIL on 24x of its FY2019E EPS of `354 with a target price of `8,501 with
Accumulate rating on the stock.
Exhibit 8: Key assumptions
Y/E March
FY2013
FY2014
FY2015
FY2016
FY2017
FY2018E
FY2019E
Domestic unit sales
1,050,859
1,053,688
1,170,702
1,305,351
1,444,542
1,681,872
1,972,281
YoY growth (%)
4.4
0.3
11.1
11.5
10.7
16.4
17.3
Exports unit sales
120,388
101,352
121,713
123,897
124,062
128,994
135,439
YoY growth (%)
-5.5
-15.8
20.1
1.8
0.1
4.0
5.0
Total volumes
1,171,247
1,155,040
1,292,415
1,429,248
1,568,604
1,810,866
2,107,720
YoY growth (%)
3.3
-1.4
11.9
10.6
9.8
15.4
16.4
Per unit domestic realization
405,502
404,719
415,183
431,688
421,652
440,606
462,749
Per unit exports realization
378,784
408,645
380,641
386,797
483,629
540,016
604,818
Per unit realisation (blended)
363,822
369,206
376,083
394,266
426,554
447,688
471,878
YoY growth (%)
18.8
1.5
1.9
4.8
8.2
5.0
5.4
Per unit RM
277,611
271,112
270,873
271,331
297,742
315,081
332,384
YoY growth (%)
12.1
-2.3
-0.1
0.2
9.7
5.8
5.5
Source: Company, Angel Research
Company background
Maruti Suzuki (MSIL), a subsidiary of Suzuki Motor Corporation (SMC), Japan
(which holds a 56% stake in MSIL), is the largest passenger car company in India,
accounting for ~50% of the domestic passenger car market. MSIL operates from
two facilities in India (Gurgaon and Manesar) with an installed capacity of 1.5mn
units. Company has commissioned production at Gujarat plant which will help
company ease its capacity constraints. Company in the last two years has moved in
premium products with launch of Baleno, Vitara, S-Cross and Ciaz. Also, MSIL has
steadily increased its presence internationally and exports now account for ~9% of
its overall sales and same is expected to increase going ahead.
July 28, 2017
7
Maruti Suzuki | 1QFY2018 Result Update
Profit and loss statement
Y/E March (` cr)
FY2016
FY2017E
FY2018E
FY2019E
Total operating income
57,746
68,009
82,443
100,951
% chg
15.6
17.8
21.2
22.4
Total Expenditure
48,768
57,709
70,073
85,812
Cost of Materials
38,780
46,704
57,057
70,057
Personnel
1,989
2,331
2,813
3,443
Others Expenses
7,999
8,674
10,202
12,312
EBITDA
8,979
10,300
12,370
15,138
% chg
33.7
14.7
20.1
22.4
(% of Net Sales)
15.5
15.1
15.0
15.0
Depreciation& Amort.
2,824
2,603
2,864
3,424
EBIT
6,155
7,697
9,506
11,714
% chg
45.1
25.1
23.5
23.2
(% of Net Sales)
10.7
11.3
11.5
11.6
Interest & other Charges
82
89
117
120
Other Income
462
2,342
2,733
3,264
(% of PBT)
7.1
23.5
22.5
22.0
Recurring PBT
6,535
9,949
12,122
14,858
% chg
34.2
52.2
21.8
22.6
Prior Period & Extra. Exp./(Inc.)
-
-
-
-
PBT (reported)
6,535
9,949
12,122
14,858
Tax
1,964
2,605
3,493
4,160
(% of PBT)
30.0
26.2
28.8
28.0
PAT (reported)
4,571
7,344
8,629
10,698
Add: Share of earnings of asso.
-
-
-
-
Less: Minority interest (MI)
-
-
0
0
PAT after MI (reported)
4,571
7,344
8,629
10,698
ADJ. PAT
4,571
7,344
8,629
10,698
% chg
23.2
60.6
17.5
24.0
(% of Net Sales)
7.9
10.8
10.5
10.6
Basic EPS (`)
151.4
243.2
285.7
354.2
Fully Diluted EPS (`)
151.4
243.2
285.7
354.2
% chg
23.2
60.6
17.5
24.0
July 28, 2017
8
Maruti Suzuki | 1QFY2018 Result Update
Balance sheet statement
Y/E March (` cr)
FY2016
FY2017E
FY2018E
FY2019E
SOURCES OF FUNDS
Equity Share Capital
151
151
151
151
Reserves& Surplus
26,856
31,934
39,096
47,975
Shareholders’ Funds
27,007
32,085
39,247
48,126
Minority Interest
-
-
-
-
Total Loans
231
231
231
231
Deferred Tax Liability
625
625
625
625
Other Liabilities
424
424
424
424
Total Liabilities
28,288
33,366
40,528
49,407
APPLICATION OF FUNDS
Gross Block
29,409
32,609
37,109
41,609
Less: Acc. Depreciation
16,641
19,244
22,109
25,533
Net Block
12,768
13,365
15,000
16,076
Capital Work-in-Progress
1,007
1,007
1,007
1,007
Investments
17,786
22,080
26,753
32,821
Current Assets
7,635
8,758
11,915
16,835
Inventories
3,132
3,666
4,442
5,450
Sundry Debtors
1,299
1,467
1,777
2,180
Cash
39
146
994
3,735
Loans & Advances
1,807
1,940
2,837
3,183
Other Assets
1,359
1,539
1,865
2,288
Current liabilities
11,059
11,995
14,299
17,484
Net Current Assets
(3,424)
(3,237)
(2,384)
(649)
Deferred Tax Asset
151
151
151
151
Mis. Exp. not written off
-
-
-
-
Total Assets
28,288
33,366
40,528
49,407
Note: Cash and bank balance includes term deposits with banks
July 28, 2017
9
Maruti Suzuki | 1QFY2018 Result Update
Cash flow statement
Y/E March (` cr)
FY2016
FY2017E
FY2018E
FY2019E
Profit before tax
6,535
9,949
12,122
14,858
Depreciation
2,824
2,603
2,864
3,424
Change in Working Capital
1,466
(80)
(6)
1,007
Interest / Dividend (Net)
(80)
89
117
120
Direct taxes paid
(1,910)
(2,605)
(3,493)
(4,160)
Others
(401)
-
-
-
Cash Flow from Operations
8,433
9,957
11,605
15,249
(Inc.)/ Dec. in Fixed Assets
(2,594)
(3,200)
(4,500)
(4,500)
(Inc.)/ Dec. in Investments
(4,582)
(4,294)
(4,673)
(6,068)
Cash Flow from Investing
(7,176)
(7,494)
(9,173)
(10,568)
Issue of Equity
1
-
-
-
Inc./(Dec.) in loans
(235)
0
0
0
Dividend Paid (Incl. Tax)
(755)
(2,266)
(1,467)
(1,819)
Interest / Dividend (Net)
(246)
(89)
(117)
(120)
Cash Flow from Financing
(1,236)
(2,355)
(1,584)
(1,939)
Inc./(Dec.) in Cash
21
107
847
2,742
Opening Cash balances
18
39
146
994
Closing Cash balances
39
146
994
3,735
Note: Closing Cash balances excludes term deposits with banks and unclaimed dividend accounts
July 28, 2017
10
Maruti Suzuki | 1QFY2018 Result Update
Key ratios
Y/E March
FY2016
FY2017E
FY2018E
FY2019E
Valuation Ratio (x)
P/E (on FDEPS)
50.4
31.3
26.7
21.5
P/CEPS
31.1
23.1
20.0
16.3
P/BV
8.5
7.2
5.9
4.8
Dividend yield (%)
0.5
1.0
0.6
0.8
EV/Sales
3.7
3.1
2.5
1.9
EV/EBITDA
23.7
20.2
16.4
12.8
EV / Total Assets
5.4
4.6
3.7
2.9
Per Share Data (`)
EPS (Basic)
151.4
243.2
285.7
354.2
EPS (fully diluted)
151.4
243.2
285.7
354.2
Cash EPS
244.9
329.4
380.6
467.6
DPS
35.0
75.0
48.6
60.2
Book Value
894.3
1,062.4
1,299.6
1,593.6
Returns (%)
ROCE
22.6
23.8
24.1
24.2
Angel ROIC (Pre-tax)
65.4
76.3
81.0
99.3
ROE
16.9
22.9
22.0
22.2
Turnover ratios (x)
Asset Turnover (Gross Block)
2.0
2.1
2.2
2.4
Inventory / Sales (days)
20
20
20
20
Receivables (days)
8
8
8
8
Payables (days)
49
44
44
44
WC cycle (ex-cash) (days)
(21)
(16)
(16)
(16)
July 28, 2017
11
Maruti Suzuki | 1QFY2018 Result Update
Research Team Tel: 022 - 39357800
DISCLAIMER
Angel Broking Private Limited (hereinafter referred to as “Angel”) is a registered Member of National Stock Exchange of India Limited,
Bombay Stock Exchange Limited and Metropolitan Stock Exchange Limited. It is also registered as a Depository Participant with CDSL
and Portfolio Manager with SEBI. It also has registration with AMFI as a Mutual Fund Distributor. Angel Broking Private Limited is a
registered entity with SEBI for Research Analyst in terms of SEBI (Research Analyst) Regulations, 2014 vide registration number
INH000000164. Angel or its associates has not been debarred/ suspended by SEBI or any other regulatory authority for accessing
/dealing in securities Market. Angel or its associates/analyst has not received any compensation / managed or co-managed public
offering of securities of the company covered by Analyst during the past twelve months.
This document is solely for the personal information of the recipient, and must not be singularly used as the basis of any investment
decision. Nothing in this document should be construed as investment or financial advice. Each recipient of this document should
make such investigations as they deem necessary to arrive at an independent evaluation of an investment in the securities of the
companies referred to in this document (including the merits and risks involved), and should consult their own advisors to determine
the merits and risks of such an investment.
Reports based on technical and derivative analysis center on studying charts of a stock's price movement, outstanding positions and
trading volume, as opposed to focusing on a company's fundamentals and, as such, may not match with a report on a company's
fundamentals. Investors are advised to refer the Fundamental and Technical Research Reports available on our website to evaluate the
contrary view, if any.
The information in this document has been printed on the basis of publicly available information, internal data and other reliable
sources believed to be true, but we do not represent that it is accurate or complete and it should not be relied on as such, as this
document is for general guidance only. Angel Broking Pvt. Limited or any of its affiliates/ group companies shall not be in any way
responsible for any loss or damage that may arise to any person from any inadvertent error in the information contained in this report.
Angel Broking Pvt. Limited has not independently verified all the information contained within this document. Accordingly, we cannot
testify, nor make any representation or warranty, express or implied, to the accuracy, contents or data contained within this document.
While Angel Broking Pvt. Limited endeavors to update on a reasonable basis the information discussed in this material, there may be
regulatory, compliance, or other reasons that prevent us from doing so.
This document is being supplied to you solely for your information, and its contents, information or data may not be reproduced,
redistributed or passed on, directly or indirectly.
Neither Angel Broking Pvt. Limited, nor its directors, employees or affiliates shall be liable for any loss or damage that may arise from
or in connection with the use of this information.
Disclosure of Interest Statement
Maruti Suzuki
1. Financial interest of research analyst or Angel or his Associate or his relative
No
2. Ownership of 1% or more of the stock by research analyst or Angel or associates or relatives
No
3. Served as an officer, director or employee of the company covered under Research
No
4. Broking relationship with company covered under Research
No
Ratings (Based on expected returns
Buy (> 15%)
Accumulate (5% to 15%)
Neutral (-5 to 5%)
over 12 months investment period):
Reduce (-5% to -15%)
Sell (< -15)
July 28, 2017
12