2QFY2017 Result Update | Automobile
November 7, 2016
Maruti Suzuki
ACCUMULATE
CMP
`5,715
Performance Highlights
Target Price
`6,006
Y/E March (` cr)
2QFY17 2QFY16
% chg (yoy)
1QFY17
% chg (qoq)
Investment Period
12 Months
Net Sales
17,843
13,751
29.8
14,920
19.6
Stock Info
EBITDA
3,037
2,145
41.6
2,216
37.1
Sector
Automobile
EBITDA Margin (%)
17.0
15.6
142 bp
14.9
217 bp
Market Cap (` cr)
172,628
Adj. PAT
2,398
1,397
71.7
1,485
61.5
Net Debt (` cr)
(17,555)
Source: Company, Angel Research
Beta
0.8
Strong Operating results, aided by improvement in CV demand: MSIL reported
52 Week High / Low
5,974/3,193
strong Q2FY2017 results with 30% yoy growth in topline to `17,823cr. Company
Avg. Daily Volume
60,020
during the quarter reported 18.5% yoy growth in its domestic volumes while
Face Value (`)
5
17.9% yoy growth in its exports. Total vehicle sales stood at 4.18 lakh vehicles vs.
BSE Sensex
27,274
3.53 lakh vehicles in Q2FY2017 and 3.48 lakh vehicles in Q1FY2017. The
Nifty
8,434
strong volume growth was due to the recovery in the domestic CV demand and
Reuters Code
MRTI.BO
better product mix offered by the company. EBITDA was at `3,037cr showing a
Bloomberg Code
MSIL@IN
yoy growth of 41.6%; EBITDA margins stood at 17.1% vs. 15.6% in Q2FY2016.
The improvement in the EBITDA margins was aided by decline in the other
Shareholding Pattern (%)
expenses which stood at12.4% of sales in Q2FY2017 against
14.0% in
Promoters
56.2
Q2FY2016. During the quarter, other income grew by 71% yoy to `813cr.
MF / Banks / Indian Fls
12.3
Outlook and valuation: We assume double digit revenue growth in our forecast
FII / NRIs / OCBs
25.0
over strong demand in domestic markets and high production abilities after
Indian Public / Others
6.5
commissioning of Gujarat plant in Q4FY2017E. Given the new launches, lower
petrol prices and its strong brand, MSIL is expected to gain market share due to
Abs. (%)
3m 1yr
3yr
product mix favoring Petrol as fuel. However, MSIL’s margins are likely to show
Sensex
(1.6)
3.7
30.0
some weakness in next two years due to the higher fixed costs arising after
Maruti Suzuki
16.9
26.3
251.8
commissioning of Gujarat plant as well as logistics expenses as its vendors are yet
to move to Gujarat. Rising commodity prices are also expected to show some
negative effects on its margins. At CMP, MSIL is trading at P/E of 27x and 22x its
3-year price chart
FY2017E and FY2018E earnings respectively. We value MSIL on 23x of its
7,000
6,000
FY2018E EPS of `261 with a target price of `6,006 with Accumulate rating on the
5,000
stock.
4,000
3,000
Key financials (post SPIL merger)
2,000
Y/E March (` cr)
FY2015
FY2016
FY2017E
FY2018E
1,000
Net Sales
48,606
56,350
68,058
82,958
0
% chg
14.0
15.9
20.8
21.9
Net Profit
3,711
4,571
6,405
7,887
% chg
33.4
23.2
40.1
23.1
Source: Company, Angel Research
OPM (%)
13.8
15.9
16.0
15.7
EPS (Rs)
122.9
151.4
212.1
261.2
P/E (x)
46.5
37.8
26.9
21.9
P/BV (x)
7.3
6.4
5.3
4.4
RoE (%)
9.9
11.8
16.8
17.4
RoCE (%)
11.9
17.5
16.6
18.9
Amarjeet S Maurya
EV/Sales (x)
3.3
2.8
2.2
1.7
022-3935 7800 Ext: 6846
EV/EBITDA (x)
30.0
20.4
15.2
12.1
Source: Company, Angel Research, stock price taken as of November 4, 2016
Please refer to important disclosures at the end of this report
1
Maruti Suzuki | 2QFY2017 Result Update
Exhibit 1: Quarterly financial performance
Y/E March (` cr)
2QFY17
2QFY16
% chg (yoy)
1QFY17
% chg (qoq)
6MFY17
6MFY16
% chg (yoy)
Net Sales
17,843
13,751
29.8
14,920
19.6
32,763
27,128
20.8
Raw-material cost
12,074
9,272
30.2
10,125
19.2
22,200
18,286
21.4
(% of Sales)
67.7
67.4
67.9
67.8
67.4
Staff cost
519
411
26.2
579
(10.3)
1,098
879
24.9
(% of Sales)
2.9
3.0
3.9
3.4
3.2
Other Expenses
2,212
1,923
15.0
2,000
10.6
4,213
3,651
15.4
(% of Sales)
12.4
14.0
13.4
12.9
13.5
Total Expenditure
14,805
11,606
27.6
12,705
16.5
27,510
22,815
20.6
Operating Profit
3,037
2,145
41.6
2,216
37.1
5,253
4,313
21.8
OPM (%)
17.0
15.6
14.9
16.0
15.9
Interest
20
18
10.7
19
3.1
38.8
37
5.4
Depreciation
630
669
(5.9)
639
(1.4)
1,269
1,341
-5.4
Other Income
813
474
71.6
483
68.1
1295.9
680
90.5
PBT (excl. Extr. Items)
3,200
1,932
65.7
2,041
56.8
5,241
3,615
45.0
Extr. Income/(Expense)
-
-
-
-
-
-
-
-
PBT (incl. Extr. Items)
3,200
1,932
65.7
2,041
56.8
5,241
3,615
45.0
(% of Sales)
17.9
14.0
13.7
16.0
13.3
Provision for Taxation
802
535
50.0
556
44.4
1,358
1,010
34.5
(% of PBT)
25.1
27.7
27.2
25.9
27.9
Reported PAT
2,398
1,397
71.7
1,485
61.5
3,883
2,605
49.1
Adj PAT
2,398
1,397
71.7
1,485
61.5
3,883
2,605
49.1
Adj. PATM
13.4
10.2
10.0
11.9
9.6
Equity capital (cr)
151
151
151
151
151
Reported EPS (`)
79.38
46.25
71.7
49.17
61.5
128.55
86.24
49.1
Source: Company, Angel Research
November 7, 2016
2
Maruti Suzuki | 2QFY2017 Result Update
Exhibit 2: Quarterly volume performance
Volume (units)
2QFY17
2QFY16
% chg (yoy) 1QFY17
% chg (qoq) 6MFY17 6MFY16
% chg (yoy)
A: Mini: Alto, WagonR
114,936
110,987
3.6
92,723
24.0
207,659
215,788
-3.8
A: Compact: Swift, Celerio, Dzire, Baleno
156,284
144,439
8.2
140,021
11.6
296,305
282,272
5.0
A: Mid-Size: Ciaz
17,920
10,546
69.9
13,690
30.9
31,610
23,920
32.1
Total Passenger cars
289,140
265,972
8.7
246,434
17.3
535,574
521,980
2.6
B: Utility Vehicles: Gypsy, Ertiga
52,611
36,214
45.3
39,348
33.7
91,959
51,764
77.7
C: Vans: Omni, Eeco
41,197
21,083
95.4
36,558
12.7
77,755
55,219
40.8
D: LCV
83
0
0
83
0
Total Domestic (includes LCV)
383,031
323,269
18.5
322,340
18.8
705,371
628,963
12.1
Total Exports
35,440
30,066
17.9
26,103
35.8
61,543
65,701
-6.3
Total Volume
418,471
353,335
18.4
348,443
20.1
766,914
694,664
10.4
Source: Company, Angel Research
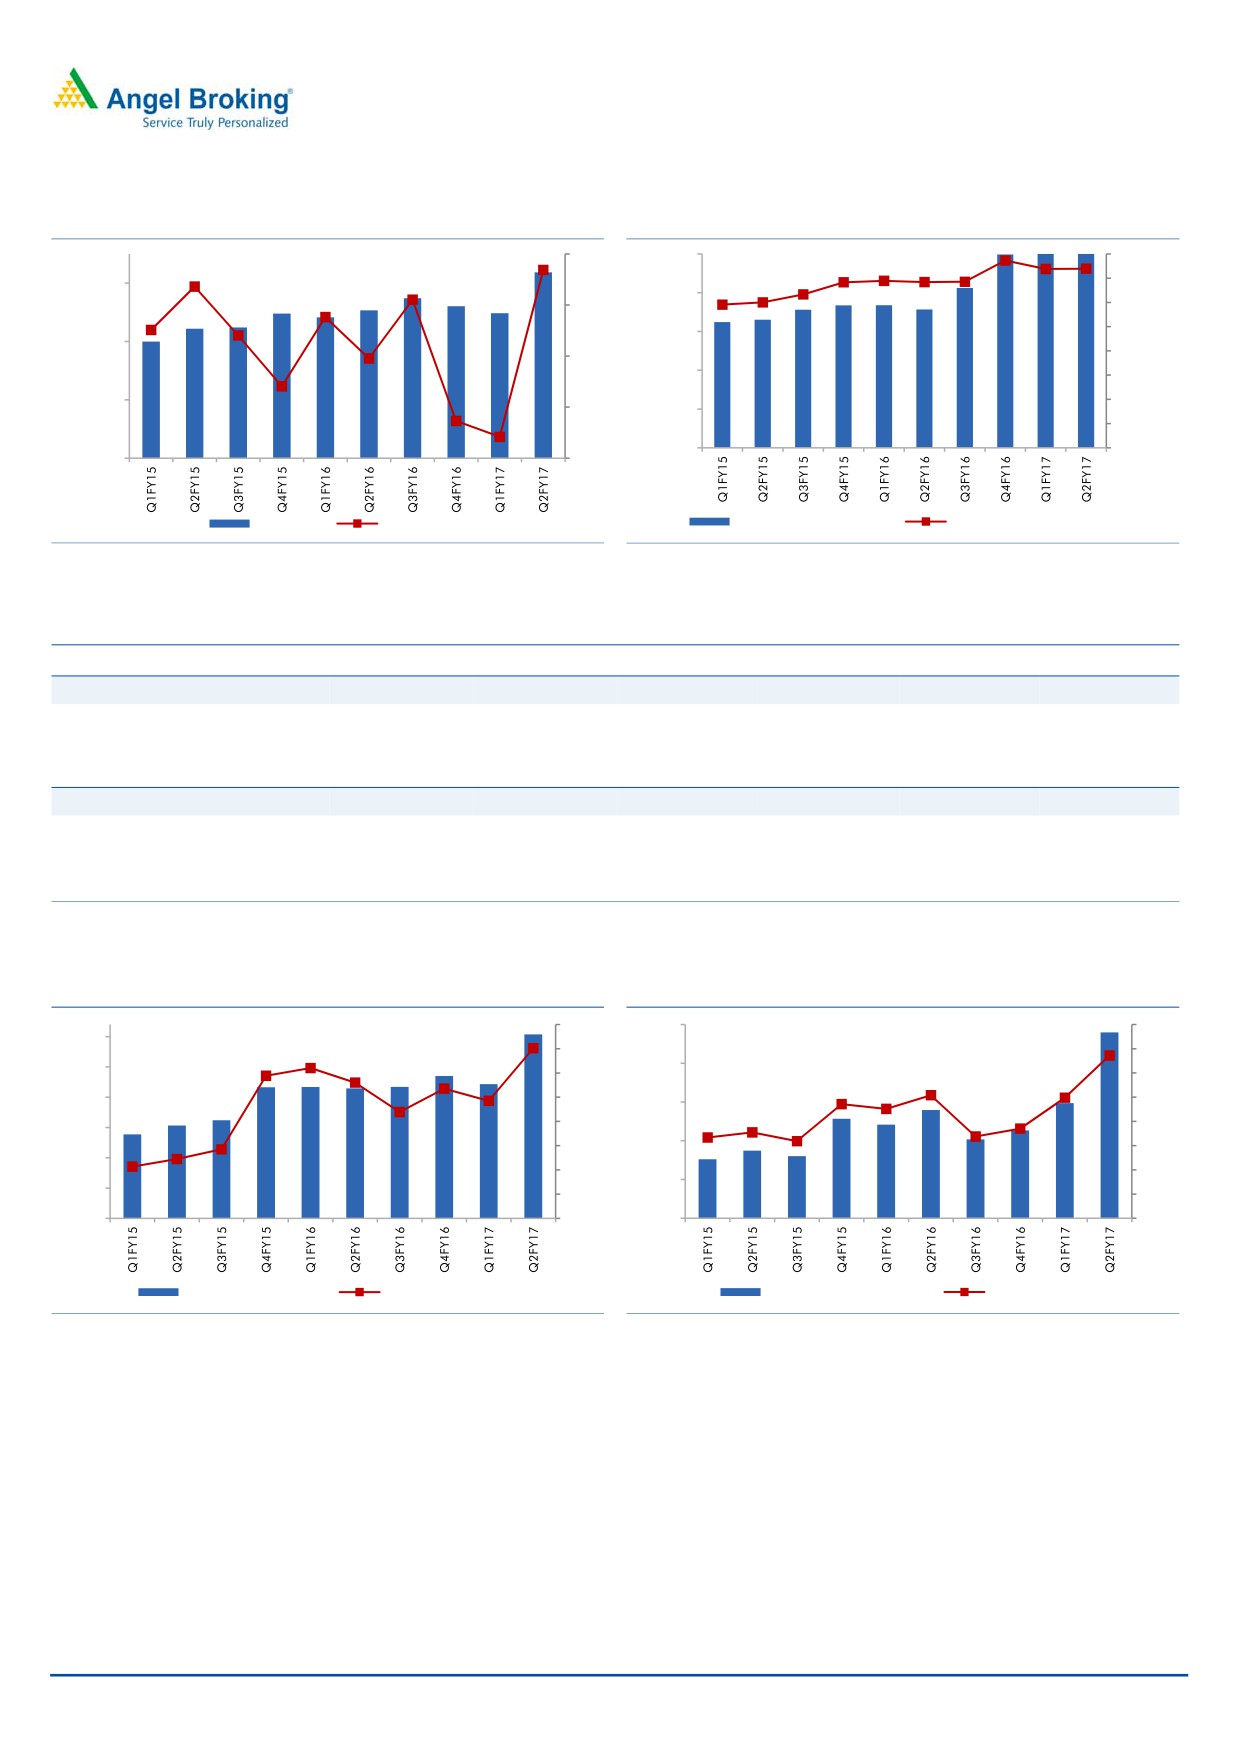
MSIL reported a strong performance during the quarter, reporting a robust
double-digit volume growth in its domestic and exports business. Improved
consumer sentiments, strong festive demand coupled with declining fuel prices
boosted the sales.
Domestic vehicle sales growth is highest in the last 8 quarters while exports
growth is highest in the last five quarters.
At 18.5% yoy growth in domestic volumes, MSIL outperformed the domestic
passenger vehicle industry which posted a growth of 17.8% in Q2FY2017.
During the quarter, MSIL reported ~70% yoy growth in its mid size vehicle
segment. Sales of vans segments grew by 95% yoy while sales of utility
vehicles grew by 45% yoy over strong recovery in the automobile demand.
Realisation per vehicle grew 10% yoy owing to a better product mix with
higher volumes of utility and mid size vehicles. The Contribution/vehicle also
improved by ~9% due to better product mix.
Domestic realizations were at `4.18 lakh showing a yoy growth of 9.45%.
Export realizations were at `4.41 lakh showing yoy growth of 17.49%.
During the quarter company paid royalty of `1,078cr (6.1% of net sales) vs.
`801cr (6.0% of net sales) in Q2FY2016.
Overall company reported a strong performance in its models in segments like
compact, utility vehicles, mid-size and vans.
Baleno, Vitara Brezza, Ertiga and Ciaz attained leadership positions in their
respective segments.
November 7, 2016
3
Maruti Suzuki | 2QFY2017 Result Update
Exhibit 3: Volumes have shown sharp recovery
Exhibit 4: Realisation & contribution per vehicle
20
425,000
150,000
130,000
400,000
400,000
15
110,000
90,000
375,000
300,000
70,000
10
350,000
50,000
200,000
30,000
5
325,000
10,000
300,000
-10,000
100,000
0
Volumes
yoy growth (%)
Net realization (`)
Contribution / Vehicle (`)
Source: Company, Angel Research
Source: Company, Angel Research
Exhibit 5: Quarterly revenue and realization performance
Q1FY16
Q2FY16
Q3FY16
Q4FY16
Q1FY17
Q2FY17
Domestic revenue (` cr)
11,698
12,360
13,523
13,548
13,334
16,030
Change yoy (%)
19.00
16.66
22.50
12.25
13.98
29.69
Domestic realization (`)
382,680
382,344
394,254
406,352
413,663
418,494
Change yoy (%)
5.36
3.82
5.43
7.12
8.10
9.45
Export revenue (` cr)
1,380
1,130
1,245
1,382
1,352
1,565
Change yoy (%)
11.0
-19.3
1.7
14.9
-2.0
38.5
Export realization (`)
387,260
375,840
399,077
511,681
517,948
441,591
Change yoy (%)
(8.87)
(8.22)
(6.40)
25.65
33.75
17.49
Source: Company, Angel Research
Exhibit 6: Highest ever EBITDA
Exhibit 7: PAT crossed `2,000cr mark
18.0
2,500
16.0
3,000
17.0
14.0
2,500
2,000
16.0
12.0
2,000
15.0
10.0
1,500
14.0
8.0
1,500
1,000
13.0
6.0
1,000
12.0
4.0
500
500
11.0
2.0
0
10.0
0
0.0
EBITDA (`cr)
EBITDA margins (%)
Net profit (`cr)
Net margin (%)
Source: Company, Angel Research
Source: Company, Angel Research
November 7, 2016
4
Maruti Suzuki | 2QFY2017 Result Update
Conference call - Key highlights
Baleno has now crossed accumulative domestic sale of one lakh units.
Company has shown strong rise in exports despite economic slowdown in
most export markets
Capacity utilization was more than 100% deriving strong operating leverage in
the quarter which saw company posting margins in excess of 17%, its highest
ever. The company also offered lower discounts compared to last year helping
to boost profitability.
Current capacity for Baleno is ~15,000 a month which is expected to increase
once Gujarat plant commissions. Capacity for Brezza is ~9,000 a month
currently.
The steep rise in its other income was due to the fair value of the investments
which is required as per the accounting standards n Ind-AS. This led to capital
gains of ~`300cr in the quarter.
The commissioning of the Gujarat plant will help company in exports due to its
proximity from the port.
Company is seeing recovery in the rural markets and expects the same to
accelerate in the harvest season.
Government employees segment constitute ~13-14% of MSIL’s sales and
company has dedicated a team to cater this segment.
The company has indicated of higher costs going ahead as Gujarat plant will
lead to 1) increase in logistics as large vendors are yet to move to Gujarat and
2) higher depreciation. It expects stabilization of costs after a couple of years.
Company has indicated that phase 1 of Gujarat plant (250k capacity) will start
production in 4QFY2017 and the rest capacity will commission in six months
from the commissioning of the plant. It is also in planning stage of adding
another line in Gujarat plant.
MSIL has guided FY17E capex of `4,500cr.
November 7, 2016
5
Maruti Suzuki | 2QFY2017 Result Update
Investment arguments
Strong recovery in the domestic vehicle demand: The automobile demand in
India is seeing a strong traction due improvement in the consumer sentiment
as well as recovery in the rural economy. The lowering the interest rate is
expected to further boost the consumer sentiment. Overall the demand
scenario is likely to remain strong over next few quarters which will result in
growth in volumes for the Automobile companies.
MSIL expected to gain market share: MSIL is the largest passenger car
manufacturer in the country and enjoys a leadership position. MSIL’s major
product portfolio is towards the petrol cars where it enjoys highest market
shares among its peers. The lower petrol prices have benefitted the company
and continued weakness in crude prices is expected to benefit the company by
keeping petrol prices at lower levels. In Q2FY2017, MSIL’s share of petrol
vehicles in total passenger vehicle industry stood at 59.2% compared to 53.7%
in Q2FY2016. Diesel volume during the quarter were 1,25,339 units which
grew by 24.2% yoy vs. The diesel vehicles market in the country during this
period declined by 5.8% yoy indicating strong fillip in its market share in diesel
category. Strong dealership network and improved product mix is expected to
benefit the company in gaining further market share. We also expect the
passenger vehicle penetration to go up in the country which will help MSIL as it
already covers most part of the country through its robust dealership network.
Gujarat plant to ease capacity constraints: MSIL is currently seeing capacity
constraints which have led to company overstretching its existing capacity. In
Q2FY2017, MSIL’s capacity utilization was more than 100% and indicates that
it may not be able to cater the strong demand without capacity expansion.
Gujarat capacity is expected to address these constraints by adding additional
capacity of 250,000 vehicles per annum from Q4FY2017.
November 7, 2016
6
Maruti Suzuki | 2QFY2017 Result Update
Outlook and valuation
The passenger vehicle (PV) industry is showing a strong signs of growth this year as
consumer spending has shown good recovery. This year’s normal monsoon and
payout of 7th pay commission have also helped to revive the automobile demand
in the country which is expected to benefit all automobile companies and MSIL
especially due to its 47% market share in the domestic PV segment. Company has
also started to offer premium product which has widened its offerings. Better
product mix, strong economic growth, high market share and foray in premium
products, these are the growth drivers which will benefit MSIL going forward.
We assume double digit revenue growth in our forecast over strong demand in
domestic markets and high production abilities after commissioning of Gujarat
plant in Q4FY2017E. Given the new launches, lower petrol prices and its strong
brand, MSIL is expected to gain market share due to product mix favoring Petrol as
fuel. However, MSIL’s margins are likely to show some weakness in next two years
due to the higher fixed costs arising after commissioning of Gujarat plant as well
as logistics expenses as its vendors are yet to move to Gujarat. Rising commodity
prices are also expected to show some negative effects on its margins. At CMP,
MSIL is trading at P/E of 27x and 22x its FY2017E and FY2018E earnings
respectively. We value MSIL on 23x of its FY2018E EPS of `261 with a target price
of `6,006 with Accumulate rating on the stock.
Exhibit 8: Key assumptions
Y/E March
FY2013
FY2014
FY2015
FY2016E
FY2017E
FY2018E
Domestic unit sales
1,050,859
1,053,688
1,170,702
1,305,351
1,438,633
1,572,383
YoY growth (%)
4.4
0.3
11.1
11.5
10.2
9.3
Exports unit sales
120,388
101,352
121,713
123,897
130,453
157,847
YoY growth (%)
(5.5)
-15.8
20.1
1.8
5.3
21.0
Total volumes
1,171,247
1,155,040
1,292,415
1,429,248
1,569,086
1,730,230
YoY growth (%)
3.3
(1.4)
11.9
10.6
9.8
10.3
Per unit domestic realization
405,502
404,719
415,183
431,688
427,462
468,016
Per unit exports realization
378,784
408,645
380,641
386,797
502,981
593,517
Per unit realisation (blended)
363,822
369,206
376,083
394,266
433,741
479,465
YoY growth (%)
18.8
1.5
1.9
4.8
10.0
10.5
Per unit RM
277,611
271,112
270,873
271,331
297,821
327,567
YoY growth (%)
12.1
-2.3
-0.1
0.2
9.8
10.0
Source: Company, Angel Research
Company background
Maruti Suzuki (MSIL), a subsidiary of Suzuki Motor Corporation (SMC), Japan
(which holds a 56% stake in MSIL), is the largest passenger car company in India,
accounting for ~47% of the domestic passenger car market. MSIL operates from
two facilities in India (Gurgaon and Manesar) with an installed capacity of 1.5mn
units. Company is also in process of commissioning production at Gujarat plant
which will help company ease its capacity constraints. Company in the last two
years has moved in premium products with launch of Baleno, Vitara, S-Cross and
Ciaz. Also, MSIL has steadily increased its presence internationally and exports
now account for ~9% of its overall sales volume and same is expected to increase
going ahead.
November 7, 2016
7
Maruti Suzuki | 2QFY2017 Result Update
Profit and loss statement (post SPIL merger)
Y/E March (` cr)
FY2014
FY2015
FY2016
FY2017E
FY2018E
Total operating income
42,645
48,606
56,350
68,058
82,958
% chg
0.1
14.0
15.9
20.8
21.9
Total Expenditure
38,605
43,258
48,768
58,152
71,068
Cost of Materials
31,315
35,008
38,780
46,731
56,677
Personnel
1,368
1,607
1,989
2,504
3,109
Others Expenses
5,922
6,643
7,999
8,917
11,282
EBITDA
4,040
5,348
7,583
9,905
11,891
% chg
22.6
29.4
33.7
21.3
19.6
(% of Net Sales)
9.5
11.0
13.5
14.6
14.3
Depreciation& Amort.
2,084
2,470
2,824
4,500
4,500
EBIT
1,956
2,878
4,759
5,405
7,391
% chg
40.4
47.1
65.4
13.6
36.7
(% of Net Sales)
4.6
5.9
8.4
7.9
8.9
Interest & other Charges
176
206
82
78
94
Other Income
732
832
462
2,384
2,523
(% of PBT)
29.1
23.7
9.0
30.9
25.7
Recurring PBT
2,512
3,503
5,139
7,712
9,819
% chg
24.6
39.5
46.7
50.1
27.3
Prior Period & Extra. Exp./(Inc.)
-
-
-
-
PBT (reported)
2,512
3,503
5,139
7,712
9,819
Tax
876
1,157
1,964
2,291
3,067
(% of PBT)
34.9
33.0
38.2
29.7
31.2
PAT (reported)
1,636
2,346
3,176
5,421
6,752
Add: Share of earnings of asso.
-
-
-
-
-
Less: Minority interest (MI)
-
-
-
-
-
PAT after MI (reported)
1,636
2,346
3,176
5,421
6,752
ADJ. PAT
1,636
2,346
3,176
5,421
6,752
% chg
16.3
33.4
23.2
40.1
23.1
(% of Net Sales)
3.8
4.8
5.6
8.0
8.1
Basic EPS (`)
92.1
122.9
151.4
212.1
261.2
Fully Diluted EPS (`)
92.1
122.9
151.4
212.1
261.2
% chg
16.3
33.4
23.2
40.1
23.1
November 7, 2016
8
Maruti Suzuki | 2QFY2017 Result Update
Balance sheet statement (post SPIL merger)
Y/E March (` cr)
FY2014
FY2015
FY2016
FY2017E
FY2018E
SOURCES OF FUNDS
Equity Share Capital
151
151
151
151
151
Reserves& Surplus
20,827
23,553
26,856
32,172
38,718
Shareholders’ Funds
20,978
23,704
27,007
32,323
38,869
Minority Interest
-
-
-
-
-
Total Loans
1,824
516
231
231
231
Deferred Tax Liability
691
587
625
625
625
Other Liabilities
437
398
424
424
424
Total Liabilities
23,930
25,205
28,288
33,604
40,150
APPLICATION OF FUNDS
Gross Block
22,702
26,462
29,409
33,909
38,409
Less: Acc. Depreciation
11,911
14,202
16,641
21,141
25,641
Net Block
10,790
12,259
12,768
12,768
12,768
Capital Work-in-Progress
2,621
1,883
1,007
1,007
1,007
Investments
10,118
12,814
17,786
21,778
28,206
Current Assets
7,070
6,593
7,635
9,538
12,143
Inventories
1,706
2,686
3,132
3,543
4,318
Sundry Debtors
1,414
1,070
1,299
1,678
2,046
Cash
630
18
39
302
470
Loans & Advances
1,629
1,426
1,807
2,382
3,318
Other Assets
1,692
1,393
1,359
1,633
1,991
Current liabilities
6,775
8,451
11,059
11,639
14,125
Net Current Assets
295
(1,857)
(3,424)
(2,101)
(1,982)
Deferred Tax Asset
105
106
151
151
151
Mis. Exp. not written off
-
-
-
-
-
Total Assets
23,930
25,205
28,288
33,604
40,150
Note: Cash and bank balance includes term deposits with banks
November 7, 2016
9
Maruti Suzuki | 2QFY2017 Result Update
Cash flow statement (post SPIL merger)
Y/E March (` cr)
FY2014E FY2015E FY2016 FY2017E FY2018E
Profit before tax
3,659
4,868
6,535
8,695
10,954
Depreciation
2,084
2,470
2,824
4,500
4,500
Change in Working Capital
756
746
1,466
(1,061)
50
Interest / Dividend (Net)
(106)
43
(80)
78
94
Direct taxes paid
(832)
(1,041)
(1,910)
(2,291)
(3,067)
Others
(658)
(766)
(401)
-
-
Cash Flow from Operations
4,904
6,321
8,433
9,922
12,530
(Inc.)/ Dec. in Fixed Assets
(3,498)
(3,157)
(2,594)
(4,500)
(4,500)
(Inc.)/ Dec. in Investments
(1,395)
(1,253)
(4,582)
(4,673)
(6,576)
Cash Flow from Investing
(4,893)
(4,410)
(7,176)
(9,173)
(11,076)
Issue of Equity
-
-
1
-
-
Inc./(Dec.) in loans
378
(1,328)
(235)
0
0
Dividend Paid (Incl. Tax)
(242)
(363)
(755)
(1,089)
(1,341)
Interest / Dividend (Net)
(293)
(831)
(246)
(78)
(94)
Cash Flow from Financing
(156)
(2,522)
(1,236)
(1,167)
(1,435)
Inc./(Dec.) in Cash
(145)
(611)
21
(418)
19
Opening Cash balances
775
630
18
39
(379)
Closing Cash balances
630
18
39
(379)
(360)
Note: Closing Cash balances excludes term deposits with banks and unclaimed dividend accounts
November 7, 2016
10
Maruti Suzuki | 2QFY2017 Result Update
Key ratios
Y/E March
FY2014E FY2015E FY2016 FY2017E FY2018E
Valuation Ratio (x)
P/E (on FDEPS)
62.0
46.5
37.8
26.9
21.9
P/CEPS
35.5
27.9
23.3
15.8
13.9
P/BV
8.2
7.3
6.4
5.3
4.4
Dividend yield (%)
0.1
0.2
0.4
0.6
0.8
EV/Sales
3.8
3.3
2.8
2.2
1.7
EV/EBITDA
40.5
30.0
20.4
15.2
12.1
EV / Total Assets
5.3
4.8
3.9
3.3
2.7
Per Share Data (`)
EPS (Basic)
92.1
122.9
151.4
212.1
261.2
EPS (fully diluted)
92.1
122.9
151.4
212.1
261.2
Cash EPS
161.1
204.7
244.9
361.1
410.2
DPS
8.0
12.0
25.0
36.1
44.4
Book Value
694.5
784.7
894.3
1,070.3
1,287.1
Returns (%)
ROCE
8.6
11.9
17.5
16.6
18.9
Angel ROIC (Pre-tax)
16.2
25.3
50.6
51.6
70.9
ROE
7.8
9.9
11.8
16.8
17.4
Turnover ratios (x)
Asset Turnover (Gross Block)
1.9
1.8
1.9
2.0
2.2
Inventory / Sales (days)
15
20
20
19
19
Receivables (days)
12
8
8
9
9
Payables (days)
46
45
49
44
44
WC cycle (ex-cash) (days)
(20)
(17)
(21)
(16)
(16)
November 7, 2016
11
Maruti Suzuki | 2QFY2017 Result Update
Research Team Tel: 022 - 39357800
DISCLAIMER
Angel Broking Private Limited (hereinafter referred to as “Angel”) is a registered Member of National Stock Exchange of India Limited,
Bombay Stock Exchange Limited and Metropolitan Stock Exchange Limited. It is also registered as a Depository Participant with CDSL
and Portfolio Manager with SEBI. It also has registration with AMFI as a Mutual Fund Distributor. Angel Broking Private Limited is a
registered entity with SEBI for Research Analyst in terms of SEBI (Research Analyst) Regulations, 2014 vide registration number
INH000000164. Angel or its associates has not been debarred/ suspended by SEBI or any other regulatory authority for accessing
/dealing in securities Market. Angel or its associates/analyst has not received any compensation / managed or co-managed public
offering of securities of the company covered by Analyst during the past twelve months.
This document is solely for the personal information of the recipient, and must not be singularly used as the basis of any investment
decision. Nothing in this document should be construed as investment or financial advice. Each recipient of this document should
make such investigations as they deem necessary to arrive at an independent evaluation of an investment in the securities of the
companies referred to in this document (including the merits and risks involved), and should consult their own advisors to determine
the merits and risks of such an investment.
Reports based on technical and derivative analysis center on studying charts of a stock's price movement, outstanding positions and
trading volume, as opposed to focusing on a company's fundamentals and, as such, may not match with a report on a company's
fundamentals. Investors are advised to refer the Fundamental and Technical Research Reports available on our website to evaluate the
contrary view, if any.
The information in this document has been printed on the basis of publicly available information, internal data and other reliable
sources believed to be true, but we do not represent that it is accurate or complete and it should not be relied on as such, as this
document is for general guidance only. Angel Broking Pvt. Limited or any of its affiliates/ group companies shall not be in any way
responsible for any loss or damage that may arise to any person from any inadvertent error in the information contained in this report.
Angel Broking Pvt. Limited has not independently verified all the information contained within this document. Accordingly, we cannot
testify, nor make any representation or warranty, express or implied, to the accuracy, contents or data contained within this document.
While Angel Broking Pvt. Limited endeavors to update on a reasonable basis the information discussed in this material, there may be
regulatory, compliance, or other reasons that prevent us from doing so.
This document is being supplied to you solely for your information, and its contents, information or data may not be reproduced,
redistributed or passed on, directly or indirectly.
Neither Angel Broking Pvt. Limited, nor its directors, employees or affiliates shall be liable for any loss or damage that may arise from
or in connection with the use of this information.
Disclosure of Interest Statement
Maruti Suzuki
1. Financial interest of research analyst or Angel or his Associate or his relative
No
2. Ownership of 1% or more of the stock by research analyst or Angel or associates or relatives
No
3. Served as an officer, director or employee of the company covered under Research
No
4. Broking relationship with company covered under Research
No
Ratings (Based on expected returns
Buy (> 15%)
Accumulate (5% to 15%)
Neutral (-5 to 5%)
over 12 months investment period):
Reduce (-5% to -15%)
Sell (< -15)
November 7, 2016
12