Initiating coverage | Real Estate
August 22, 2016
Mahindra Lifespace Developers
BUY
CMP
`432
New launches and strong sales velocity to drive growth…
Target Price
`522
Mahindra Lifespace Developers (MLF) is the Real Estate company of Mahindra
Investment Period
12 Months
group. The company benefits from the strong pedigree, brand name, trust and
reputation of the Mahindra group. We also believe that over last few years, the
company has shaped and executed its business strategy very well, positioning it for strong
Stock Info
revenue and earnings growth, as well as market share gains over the coming years.
Sector
Real Estate
Speedy execution & even speedier sales: The company has diversified its portfolio
Market Cap (` cr)
1,773
well by taking-up multiple small to mid-sized residential projects across multiple
Net debt (` cr)
1,325
cities (currently 11 projects are under implementation in cities like, Chennai, Delhi
Beta
0.4
NCR, Nagpur, Pune, Hyderabad, Bangalore, Mumbai). The company’s project-
52 Week High / Low
559/415
wise data shows that it has maintained a consistent and relatively fast completion
of the projects (4-4.5 years in Mumbai, other-wise 3-3.5 years across other cities),
Avg. Daily Volume
16,422
compared to other listed/ unlisted developers. More positively, the sales cycle has
Face Value (`)
10
in 83% of the projects been even faster than execution cycle, contrary to industry
BSE Sensex
27,986
trends. Even in a market like Delhi NCR, the company’s Luminare P-I project has
Nifty
8,629
sold 73% since 6 quarters of launch, ahead of completed 41%. This strategy of fast
execution and sales in our view is the optimal strategy, as it helps the company in revenue
Reuters Code
MALD.BO
recognition, inventory cycle (better than Oberoi, DLF), cash flows and profitability. Even
Bloomberg Code
MLIFE IN
more importantly, it helps in consolidation of the company’s brand image and create
virtuous cycle of continuous fast growth and translate to market share gains.
Strong revenue growth visibility in short-to-long run: MLF as of 1QFY2017 is
Shareholding Pattern (%)
pursuing sale of ~4.0mn sq. ft. of total ~20.3mn sq. ft. of its saleable area.
Promoters
50.8
Having sold ~56% of the ongoing projects, we expect MLF to launch 1.48mn
MF / Banks / Indian Fls
1.2
sq.ft. of saleable area (includes, Banerghatta project- 0.23 mn sq.ft., Vivante
FII / NRIs / OCBs
25.6
project- 0.23 mn sq.ft., Palghar project- 0.36 mn sq.ft.) in a rational way during
3QFY2017-2QFY2018E, across 4 cities. Maturity from existing projects, new
Indian Public / Others
22.4
launches give better revenue visibility for the medium-term. We expect MLF to
report an impressive 25.5% consol. adj. sales CAGR during FY2016-18E to
`1,300cr. In line with the top-line growth, given the unlevered balance sheet, we
Abs. (%)
3m
1yr
3yr
expect consol. profits to grow to `147cr in FY2018E. Further, MLF is sitting on a
Sensex
3.6
8.7
51.1
land bank of 11.4mn sq.ft across 3 cities (majorly from Chennai), which allays
Mahindra Lifespace
(5.4)
0.2
(1.5)
any concern over the long-term revenue growth visibility. Further, in our view,
over longer-term organized, professional run and well funded players which enjoy
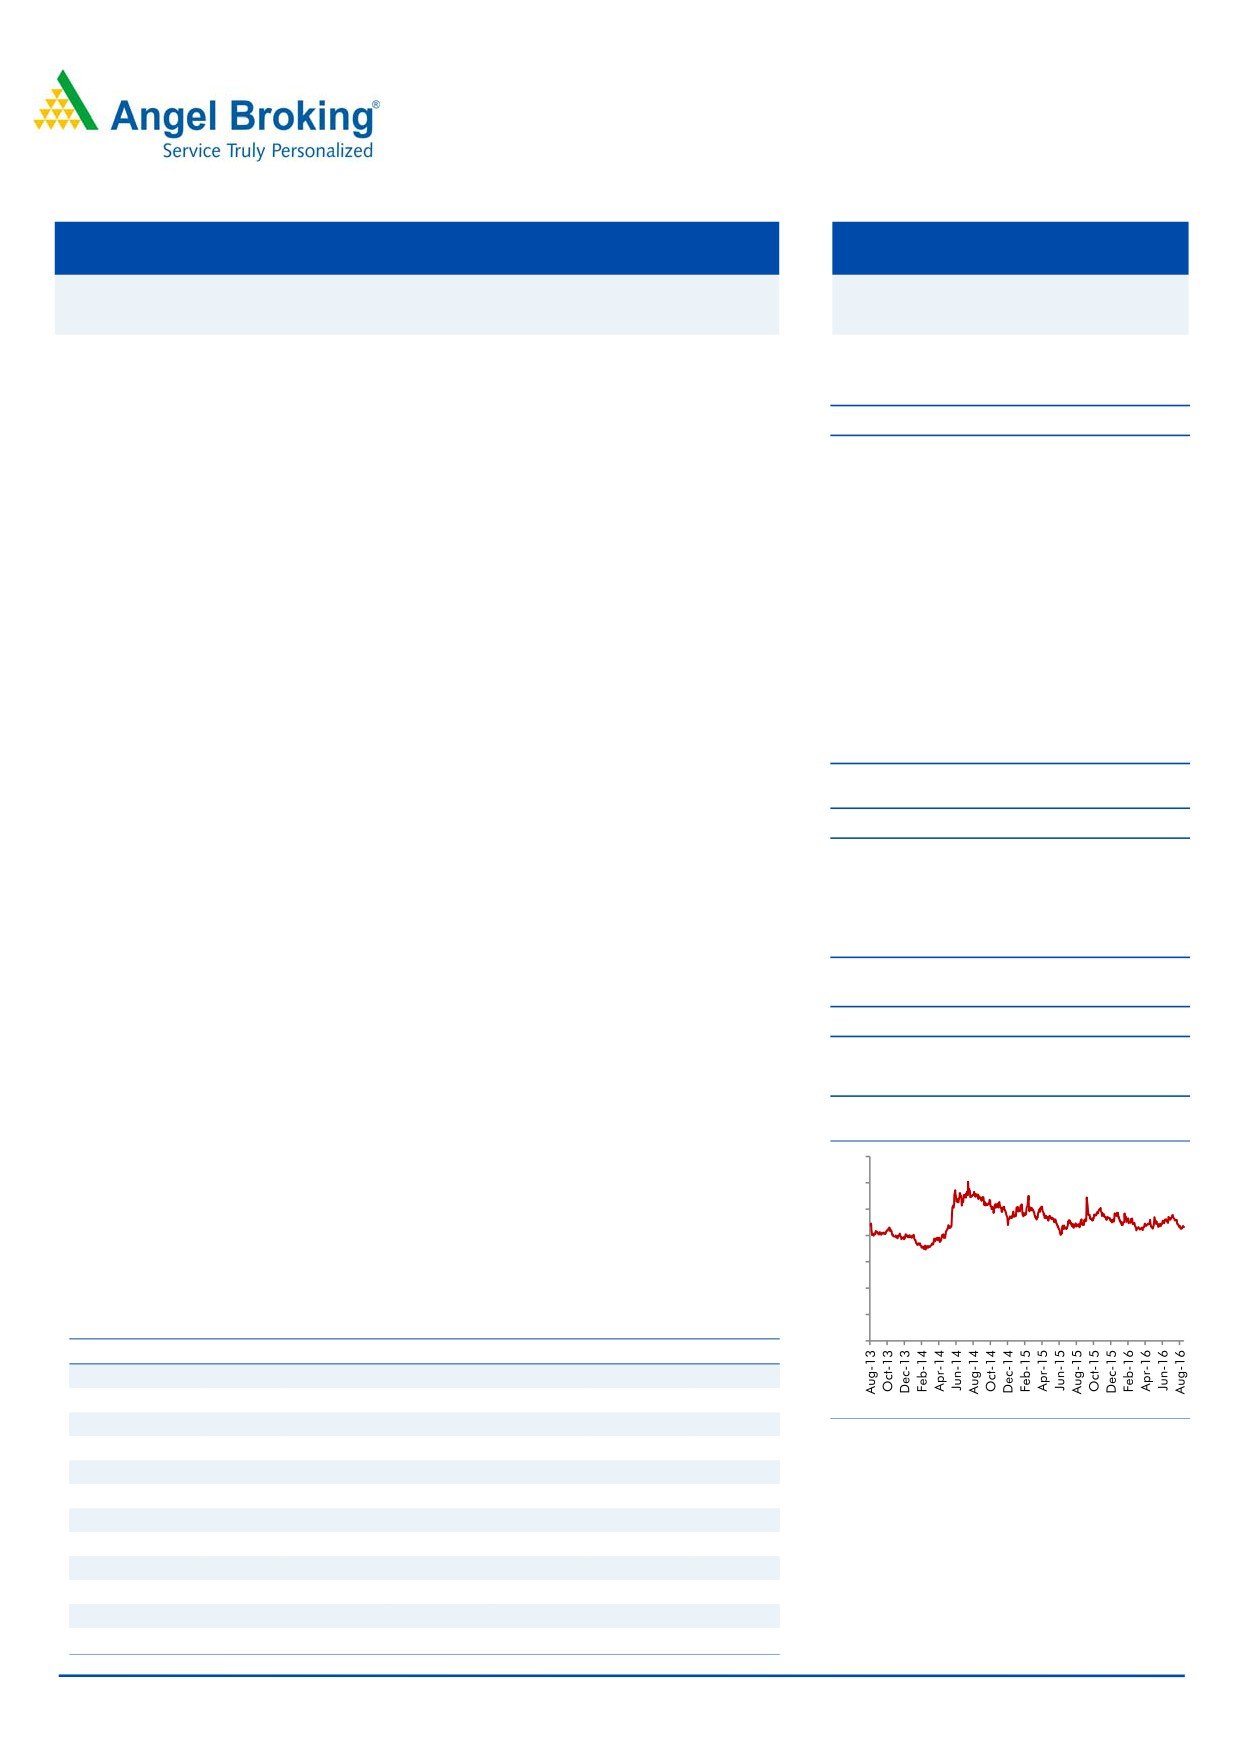
3-Year Daily price chart
strong trust due to reliable and fast execution strategy, will gain market share. This
would be further amplified once the real estate bill is implemented, as players with
700
already good business practices like MLF would stand to gain the most.
600
500
Attractive valuations: Given the ongoing improvement in company’s
400
fundamentals, strong earnings growth visibility and the long-term growth outlook,
we believe at current valuations of 1.0x FY2018E P/BV, MLF stock looks attractive.
300
We initiate coverage on MLF with a BUY recommendation and target price of `522.
200
100
Key Financials
0
Y/E Mar (` cr)
FY13
FY14
FY15
FY16
FY17E
FY18E
Net Sales
738
705
1,086
826
1,152
1,300
% chg
5.3
(4.5)
54.0
(23.9)
39.5
12.8
Net Profit
141
101
266
93
123
147
Source: Company, Angel Research
% chg
18.7
(28.8)
164.5
(65.0)
31.8
19.9
EBITDA (%)
32.8
24.1
39.1
20.1
22.7
24.6
EPS (`)
35
25
65
23
29.9
35.8
P/E (x)
12.5
17.5
6.7
19.0
14.4
12.1
P/BV (x)
1.4
1.4
1.2
1.1
1.1
1.0
RoE (%)
10.9
7.9
19.5
6.1
7.6
8.6
RoCE (%)
11.4
6.5
15.3
5.1
8.1
10.0
Yellapu Santosh
EV/Sales (x)
3.5
4.4
2.7
3.7
2.2
1.9
022 - 3935 7800 Ext: 6811
EV/EBITDA (x)
10.7
18.2
6.9
18.6
9.9
7.7
Source: Company, Angel Research; CMP as of August 22, 2016
Please refer to important disclosures at the end of this report
1
Initiating coverage | Mahindra Lifespace Developers
Investment Rationale
Focus on sales and project execution velocity
MLF unlike its peers does not pursue the strategy of building land banks. Most
developers execute a project in 8-10 years; they block their capital for long periods
and look to benefit from an appreciation in property prices. Instead, MLF looks to
buy a land parcel, get fast approvals and execute the entire project in 3-5 years.
MLF is able to drive sales velocity by (1) leveraging on the strong brand value of
the parent, (2) implementing attractive pricing strategies (most of the times, pricing
is at par with competitors in nearby areas), and (3) purchasing relatively smaller
land parcels of ~0.5/1.0mn sq.ft. and launching them in a phased manner.
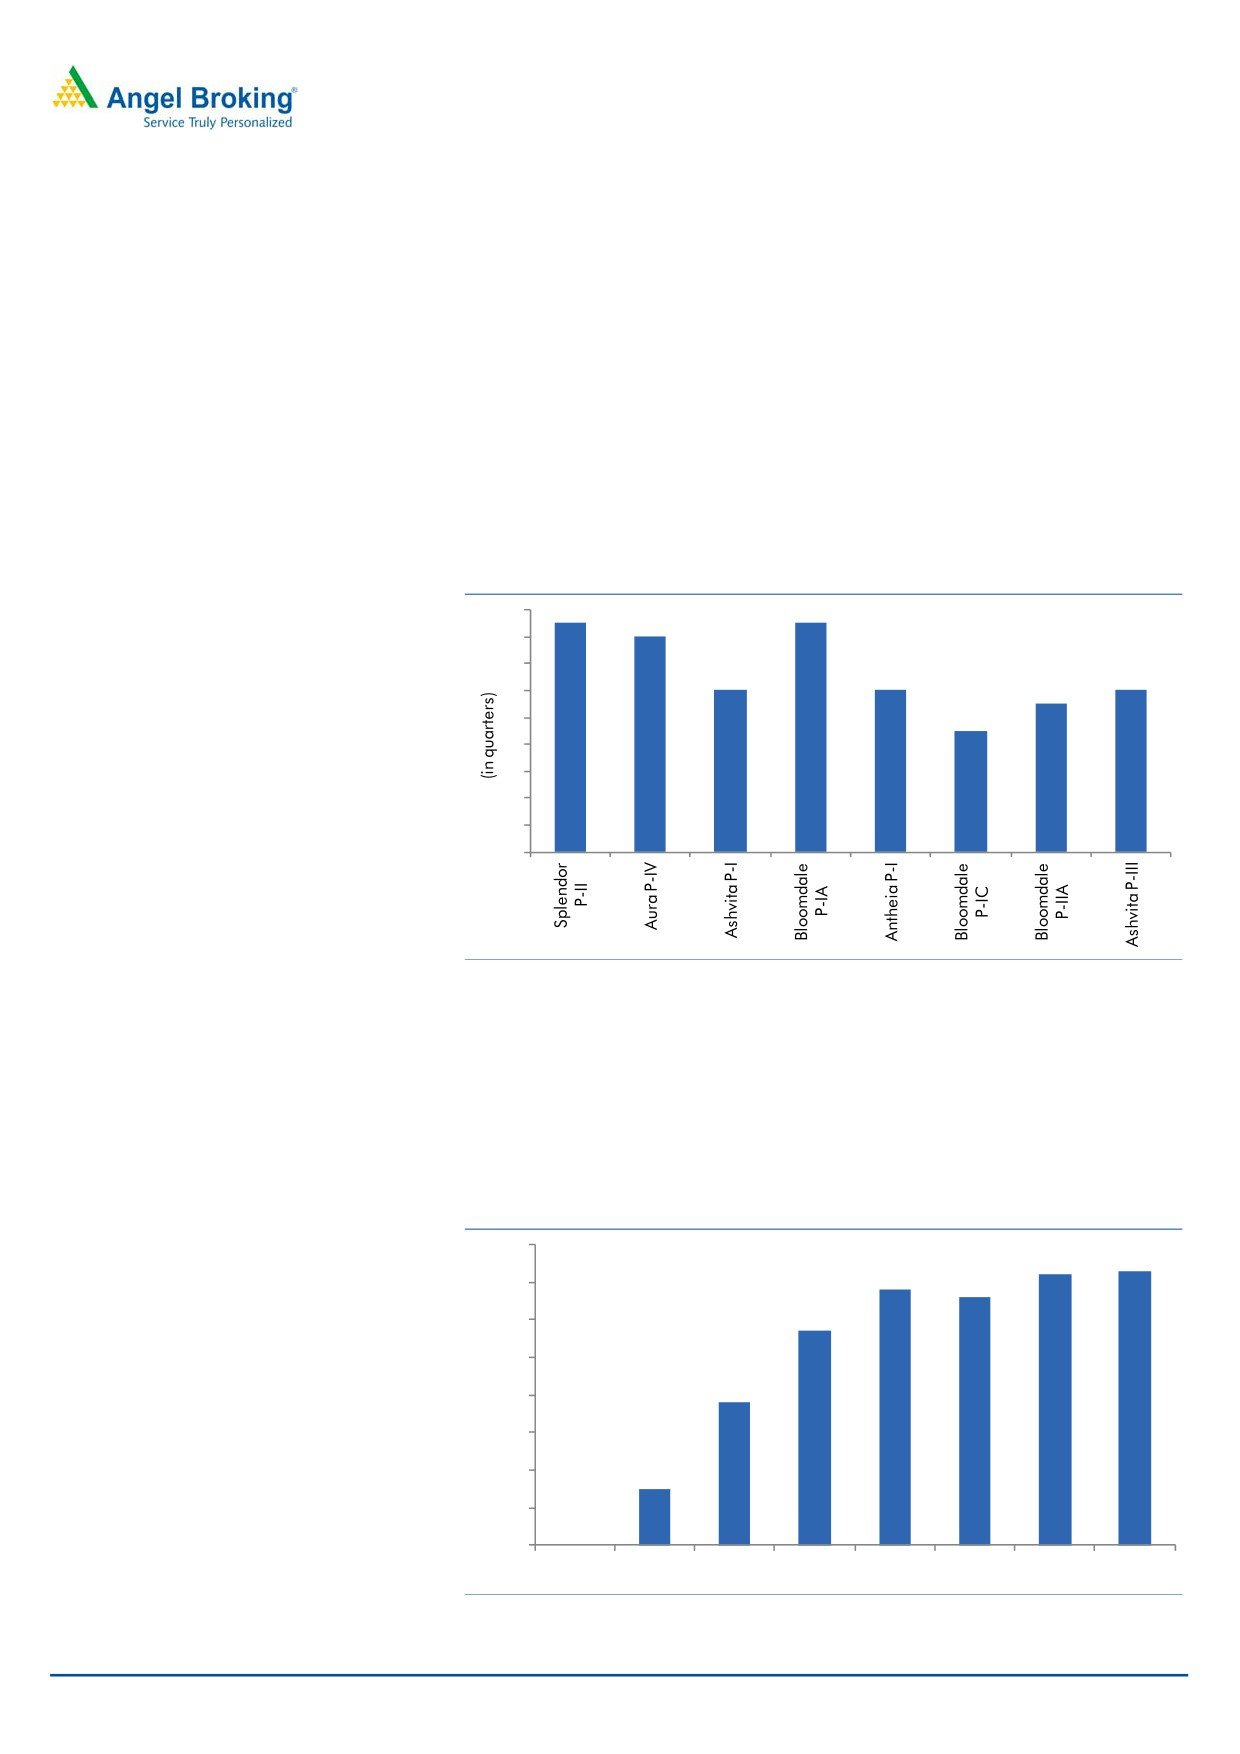
Exhibit 1: Faster sales churn
18
17
17
16
16
14
12
12
12
11
12
10
9
8
6
4
2
0
Source: Company, Angel Research; Note: Exc. time period from land parcel acquisition to getting
approvals, which in our view could stretch the project by another 1-2 years.
The table above clearly highlights that MLF has been able to deliver projects in 3-5
years. What impresses us is that 2 phases of the completed projects were from
inventory overhang markets like Delhi NCR/Mumbai, which got completed in
~16/17 quarters time, respectively. Luminare P-I, their ongoing project in Delhi
has already reported 73% of sales in the 7 quarters since launch.
Exhibit 2: Luminare P-I (% sold)
80%
72%
73%
68%
70%
66%
57%
60%
50%
38%
40%
30%
20%
15%
10%
0%
0%
2QFY15
3QFY15
4QFY15
1QFY16
2QFY16
3QFY16
4QFY16
1QFY17
Source: Company, Angel Research
August 22, 2016
2
Initiating coverage | Mahindra Lifespace Developers
In line with the sales booking cycle, MLF unlike some of its peers, also focuses on
prompt execution of its projects. The company usually executes the project with a
lag of just 4-5 quarters of sales booking, which allows it in following an optimal
cash flow cycle.
MLF follows prudent strategy of depending on advances/collections from its
home-buyers to fund its projects, rather than depending on stop-gap financing
arrangements, a strategy followed by most of the peers. Many developers follow a
land bank strategy, thus putting stress on their cash flow cycles, which is not the
case with MLF. The following charts depict the same.
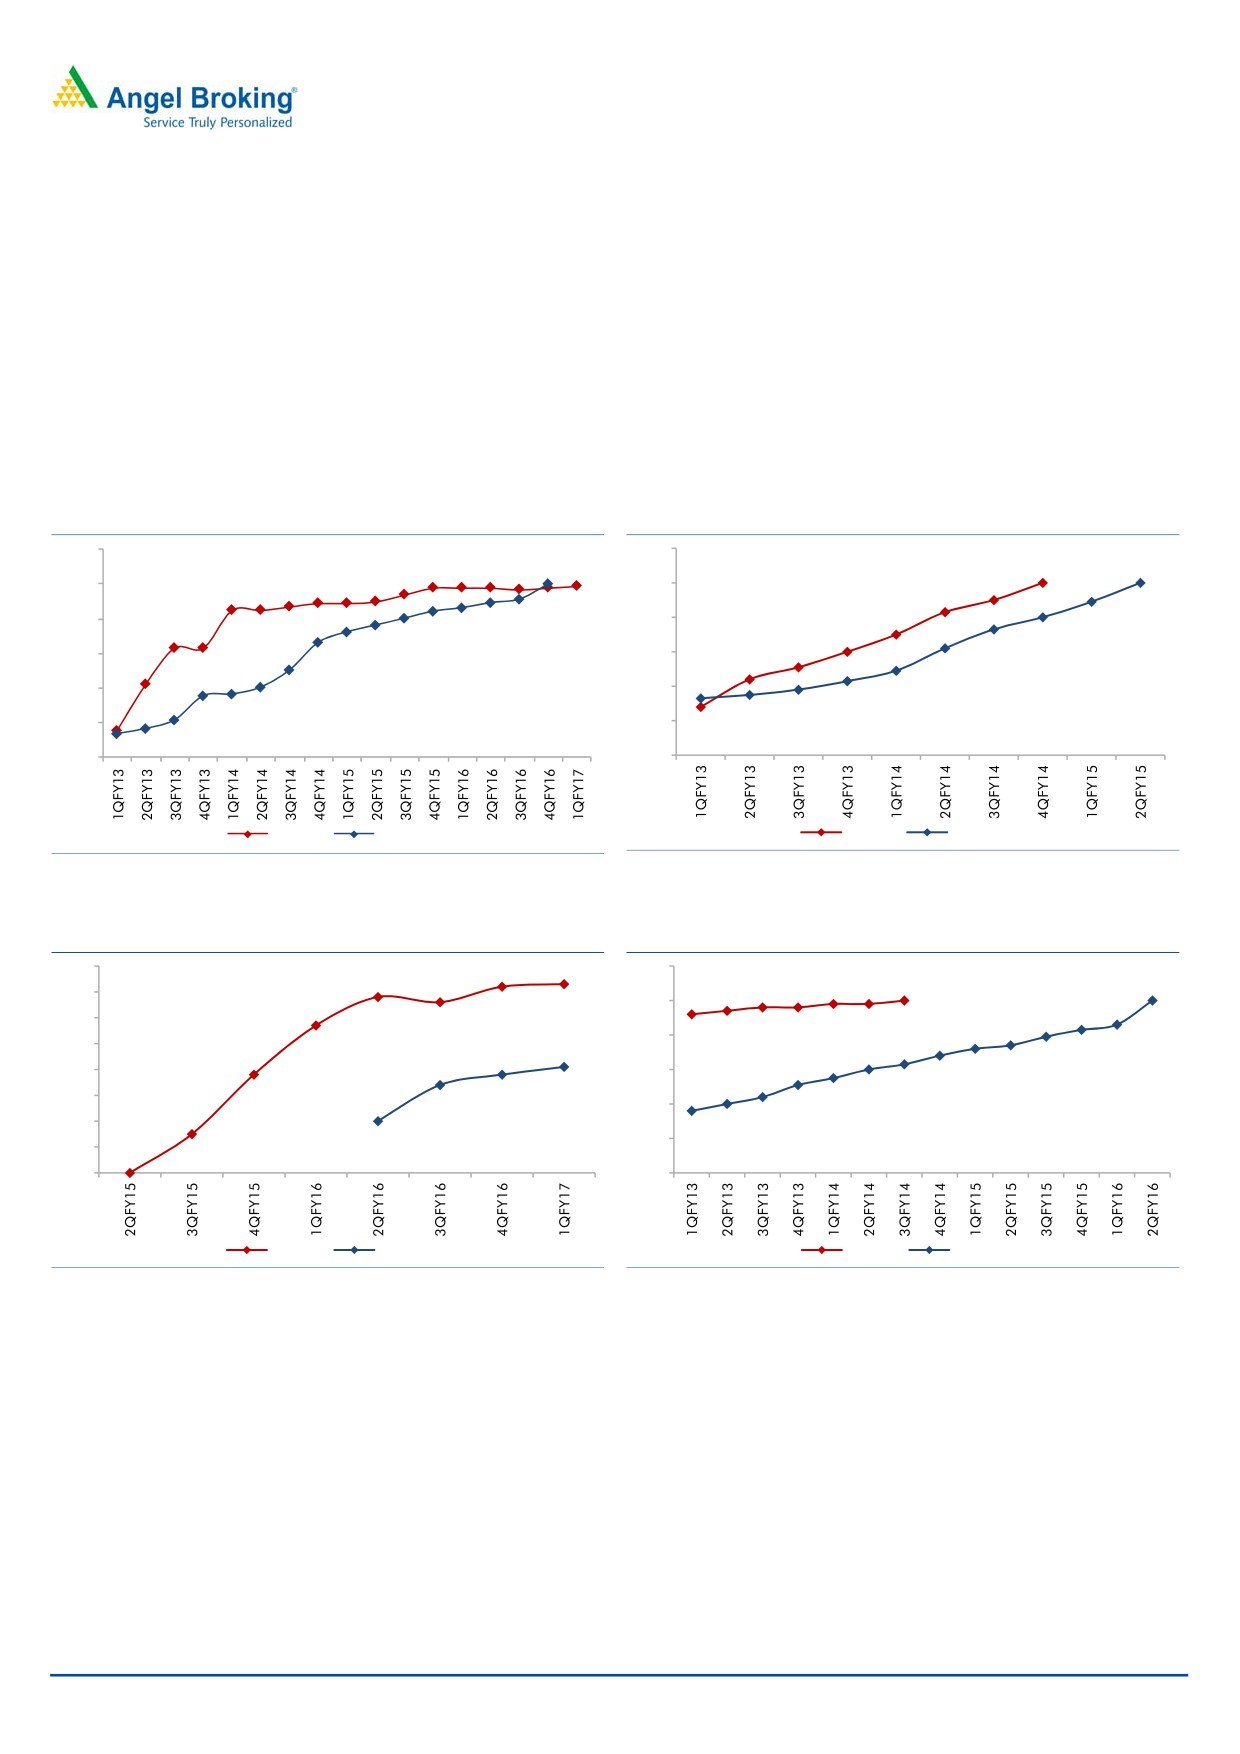
Exhibit 3: Bloomdale P-IB
Exhibit 4: Aqualily Villas P-III
120
120
98
98
98
97
98
99
100
94
90
87
89
89
90
100
100
85
85
83
100
70
100
80
80
63
63
89
91
60
89
84
86
80
51
80
76
60
73
60
72
44
42
66
62
40
40
28
50
49
15
43
40
33
35
38
20
35
36
20
21
13
16
0
0
% sold
% completed
% sold
% completed
Source: Company, Angel Research
Source: Company, Angel Research
Exhibit 5: Luminare P-I
Exhibit 6: Aura P-IV
80
72
73
120
68
100
66
96
96
98
98
70
92
94
57
100
60
100
80
50
86
38
83
79
40
60
72
74
68
41
63
30
38
60
40
55
15
34
51
20
36
40
44
20
10
20
0
0
0
% sold
% completed
% sold
% completed
Source: Company, Angel Research
Source: Company, Angel Research
Revenue recognition from a project happens when 25% of construction costs, 25%
of sales and 10% of collections from customers is achieved. The above tables
highlight that as MLF books 35%+ of its project sales, 25%+ of construction costs
in first 3-5 quarters of launch. Thus, this enables the company to recognise
revenues from a project in 3-5 quarters of launch, which is not the case with most
of the other developers.
Focus on launching smaller projects in phases across cities
Another differentiating factor for MLF is that it focuses on launching smaller
projects in phases across cities. MLF takes up projects of up to 0.5mn sq.ft. in
Mumbai and up to 1 mn sq.ft. in non-Mumbai areas. Despite the smaller project
August 22, 2016
3
Initiating coverage | Mahindra Lifespace Developers
size, MLF launches the project in a phased manner. This strategy when coupled
with focus on driving the sales velocity helps it attain revenue recognition threshold
levels in 3-5 quarters of launch across most of its projects.
Strong project launch pipeline visibility
MLF as of 1QFY2017 is sitting on land parcels with total saleable area of
~20.3mn sq.ft. Of this, MLF is pursuing projects covering ~4.0mn sq.ft. of
saleable area (Delhi NCR-20%, Pune-20% and Mumbai-17%). As of 1QFY2017,
MLF has sold ~56% of the total ~4.0mn sq.ft. saleable area, which leaves no
option for the company but to launch new projects sooner.
We expect MLF to launch ~1.48mn sq. ft. of saleable area during 3QFY2017-
2QFY2018E. A major 0.98mn sq. ft. of the launches planned are in the Mumbai
and surrounding markets.
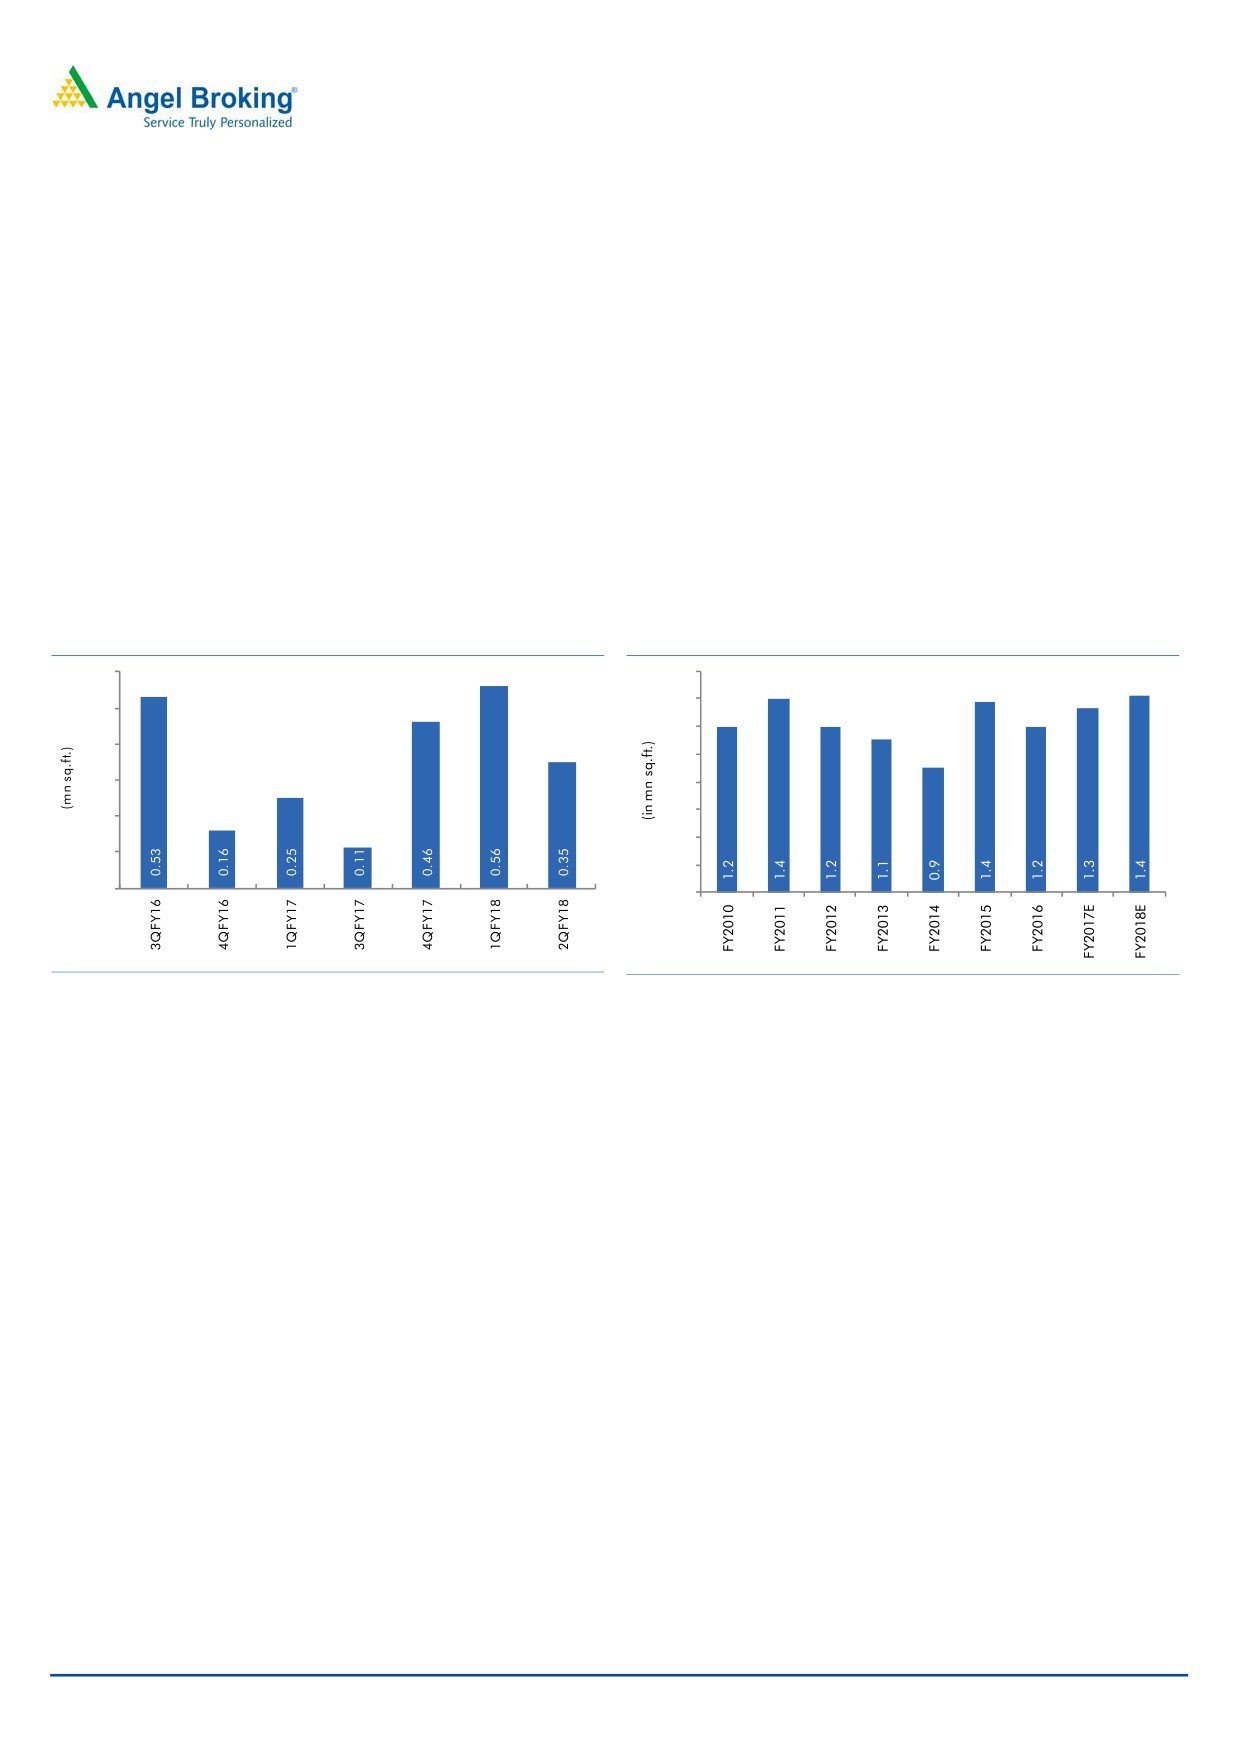
Exhibit 7: Pipeline of projects to be launched
Exhibit 8: Sale volumes trends
0.6
1.6
1.4
0.5
1.2
0.4
1.0
0.3
0.8
0.6
0.2
0.4
0.1
0.2
0.0
0.0
Source: Company, Angel Research
Source: Company, Angel Research
Historically, MLF has seen yearly sales of ~1-1.2mn sq.ft. At the backdrop
of
~1.48mn sq.ft. of saleable area planned to be launched during
3QFY2017-2QFY2018E, when coupled with company’s focus on sales velocity,
comforts us that the yearly sales volume would gradually catch-up from here on.
We expect sale volumes to increase from 0.9mn sq.ft. in FY2014 to 1.4mn sq.ft. in
FY2018E.
Standalone business to drive profits during FY2015-18E
During 1QFY2015 MLF completed sale of its 5-acre land parcel at Byculla,
Mumbai, for which it fetched `325cr. On adjusting for the same, MLF reported
FY2015 consol. sales of `761cr. In absence of any such one-time transactions, in
FY2016 M-Life reported consol. sales of `826cr, reflecting 8.6% yoy growth. As
highlighted above, we expect sale volumes to increase from 0.9mn sq.ft. in
FY2014 to 1.4mn sq.ft. in FY2018E. Uptick in sale volumes coupled with expected
increase in blended sale realizations (led by higher contribution kicking-in from
Mumbai, Bangalore and Delhi based projects) would lead to strong top-line
growth at standalone level. Led by strong growth across the standalone business,
we expect adj. consol. sales to report 25.5% CAGR during FY2016-18E to
`1,300cr.
August 22, 2016
4
Initiating coverage | Mahindra Lifespace Developers
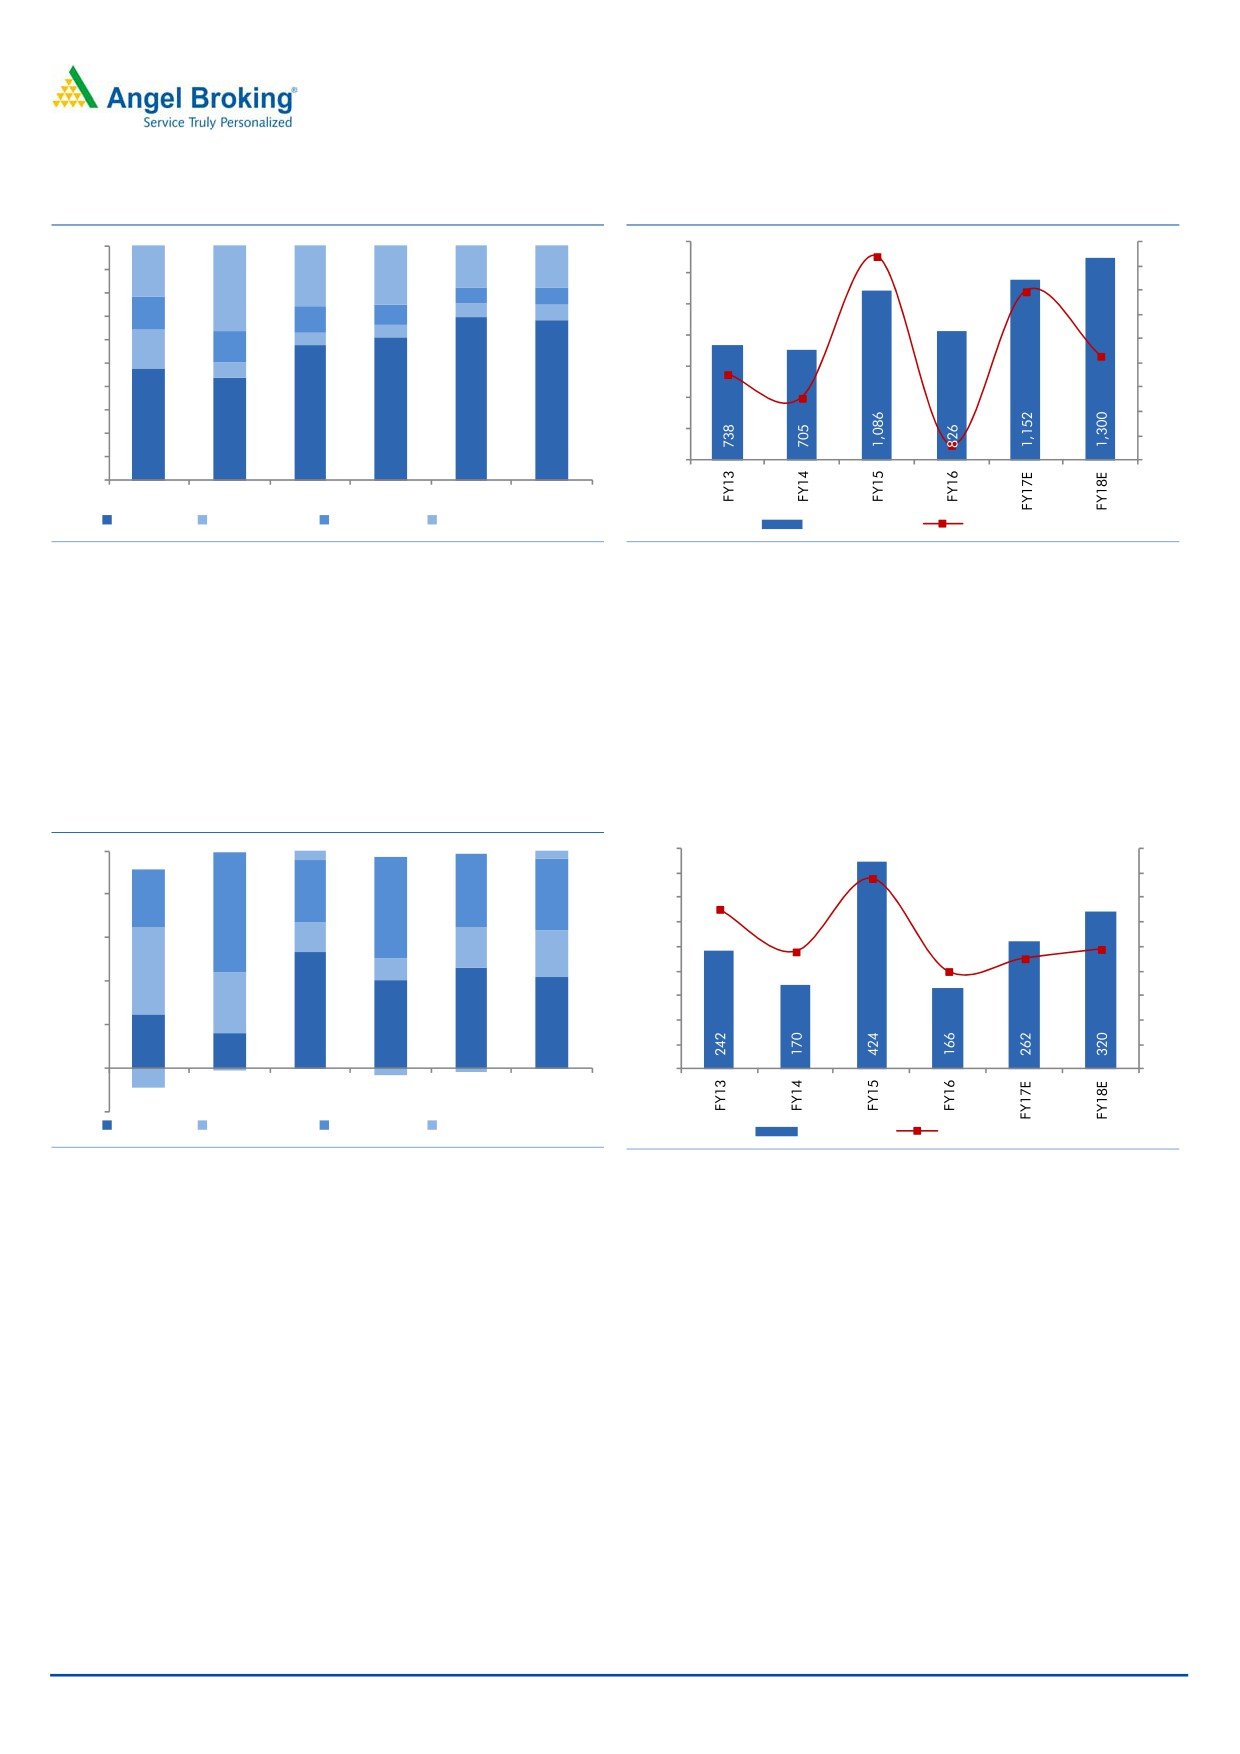
Exhibit 9: Std. revenues contribution to increase
Exhibit 10: Consolidated revenues set to grow
100%
1,400
54.0
39.5
60
90%
18%
18%
50
22%
26%
25%
1,200
80%
37%
40
7%
7%
12.8
1,000
14%
9%
6%
7%
30
70%
11%
5%
800
(4.5)
60%
6%
5.3
(23.9)
20
17%
13%
50%
600
10
7%
40%
0
69%
68%
400
30%
57%
61%
(10)
48%
44%
200
20%
(20)
10%
0
(30)
0%
FY2013
FY2014
FY2015
FY2016
FY2017E FY2018E
Standalone
MWC, Chennai MWC, Jaipur MRDL, MITL & Others
Revenues (` cr)
yoy growth (%)
Source: Company, Angel Research
Source: Company, Angel Research
With shift further getting skewed towards residential business mix (standalone
financials) when coupled with increased contribution from Tier-1 cities (Mumbai,
Delhi and Bangalore), there exists scope for EBITDA margin expansion. We expect
adj. EBITDA to report an impressive 38.7% CAGR during FY2016-18E to `320cr.
In-line with EBITDA growth, we expect overall profitability to report strong growth
to `147cr in FY2018E.
Exhibit 11: Std. business to drive consol. EBITDA
Exhibit 12: Consolidated EBITDA% to be at ~25% levels
100%
450
45
4%
3%
39.1
400
40
28%
34%
32.8
80%
32%
33%
350
24.6
35
56%
49%
300
30
24.1
60%
14%
22.7
20%
250
20.1
25
22%
48%
11%
200
20
40%
150
15
28%
53%
48%
100
10
20%
43%
42%
30%
50
5
17%
0%
-1%
-3%
-2%
0
0
-10%
FY2013
FY2014
FY2015
FY2016
FY2017E FY2018E
-20%
Standalone
MWC, Chennai MWC, Jaipur MRDL, MITL & Others
EBITDA (` cr)
EBITDA Margin (%)
Source: Company, Angel Research
Source: Company, Angel Research
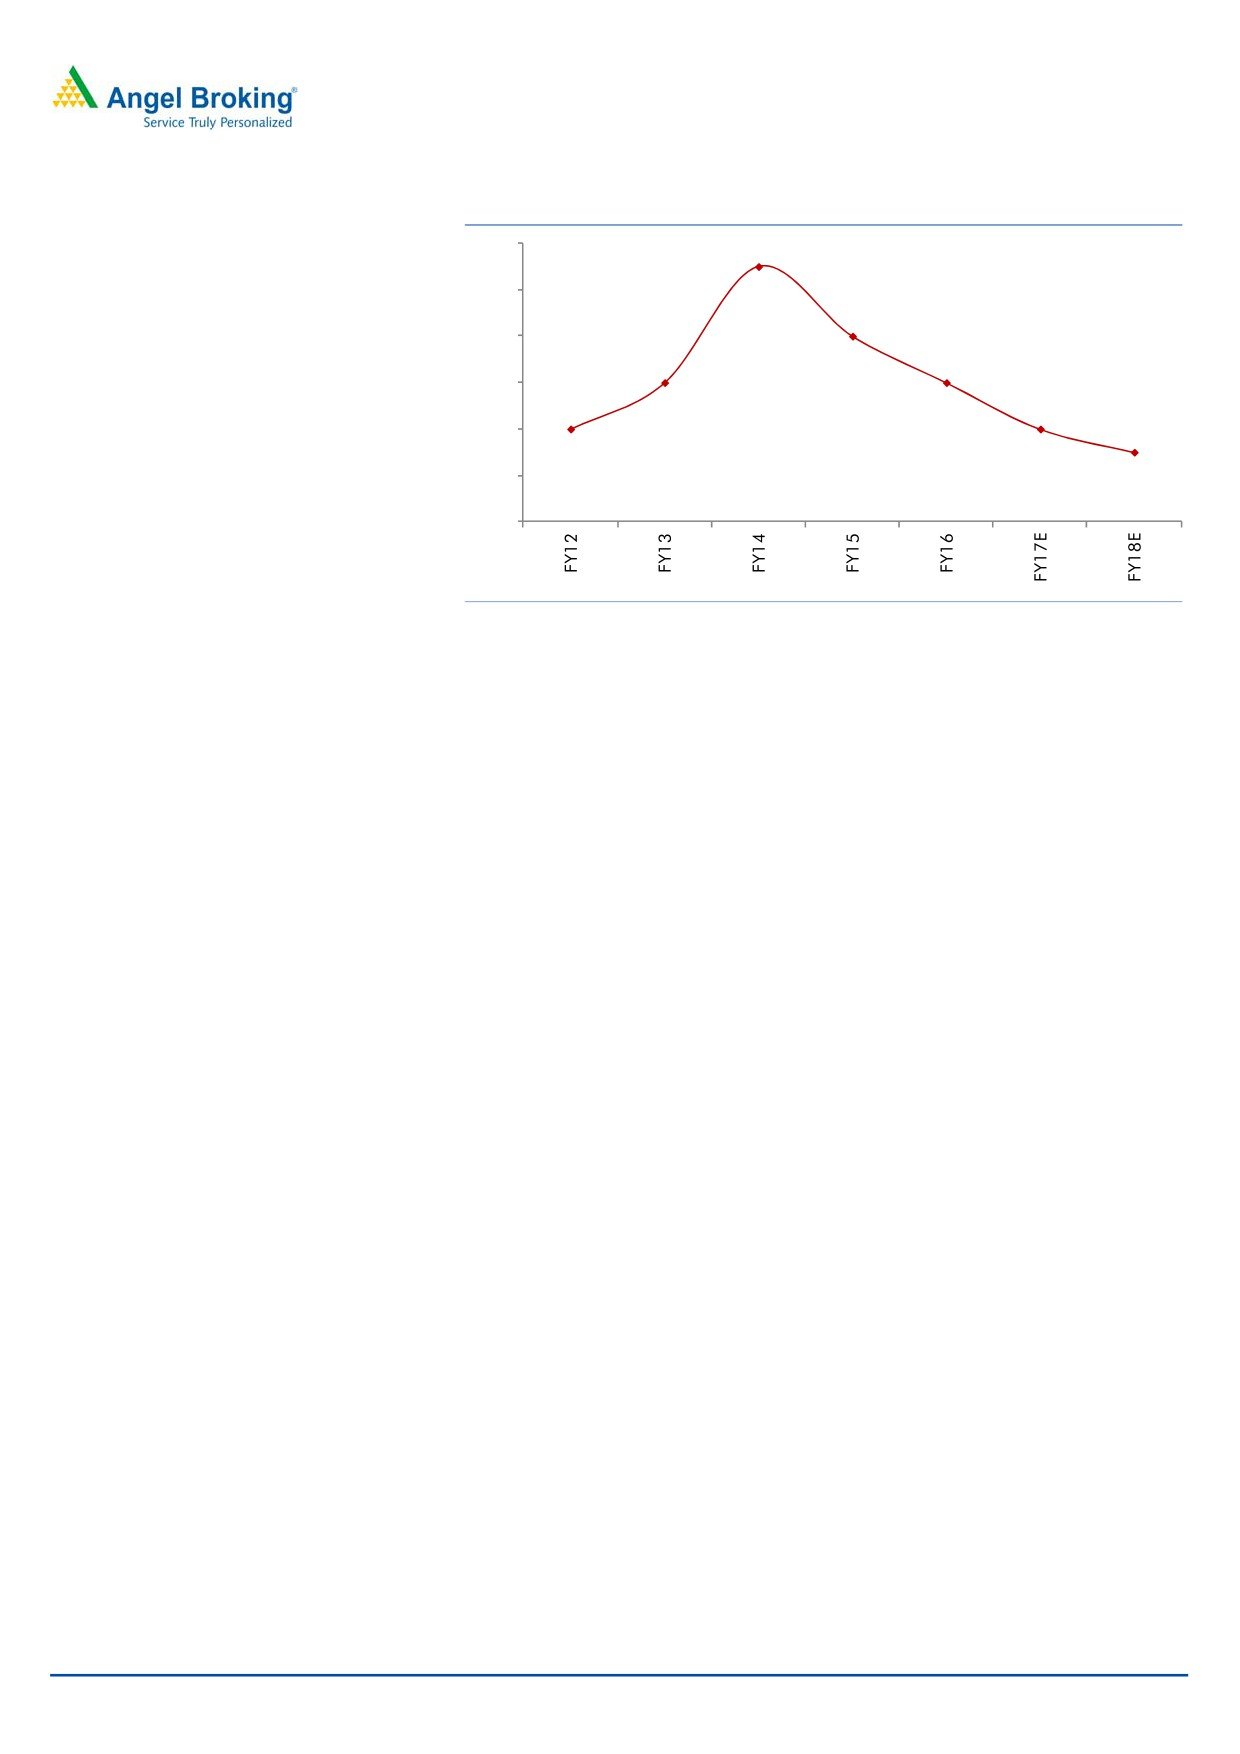
Better Net debt to equity ratio…
MLF reported comfortable consol. net debt to equity ratio of 0.8x as of 4QFY2016.
We expect it to come down to 0.4x by FY2018E, as we believe cash flows
generated from residential and SEZ sales would compensate for the capex. At the
standalone level, MLF has a strong balance sheet and is currently sitting on net
debt of `476cr, reflecting net D/E ratio of 0.3x. We believe focus on collections
from home buyers, and lower dependency on external borrowings has led MLF in
maintaining unlevered balance sheet. We expect the company’s unlevered balance
sheet and unique business strategies help it to continue reporting growth, going
forward.
August 22, 2016
5
Initiating coverage | Mahindra Lifespace Developers
Exhibit 13: Net D/E ratio at comfortable levels
1.2x
1.1x
1.0x
0.8x
0.8x
0.6x
0.6x
0.6x
0.4x
0.4x
0.4x
0.3x
0.2x
0.0x
Source: Company, Angel Research
Management’s impressive track record
MLF is a subsidiary of the Mahindra Group, which has a well diversified presence
across automobile, defense, financial services, and IT services sectors. Considering
the group’s track record of emerging as one of the top player within the sector it
enters, we are of the view that MLF would continue to focus on growing its
business. Also, their parent’s brand name, unique business strategies have helped
them deliver projects in a timely manner, which has created the trust factor with its
home buyers.
The new Real Estate bill augurs well for MLF’s growth
Central Government having passed the new Real Estate regulatory bill in both the
houses, now it is the turn of respective state governments to implement this bill.
Tamil Nadu has emerged as the first state to implement this bill in their state, with
states like Andhra Pradesh following the implementation of the bill. This bill is being
perceived negative by some of the industry participants. Some of the key features
include- (1) adherence to declared plans, (2) deposit 50% of the amounts realized
from home-buyers towards project level escrow account,
(3) mandatory
registration and public disclosure of real estate projects, (4) functions of real estate
agents, as well as regulatory authority.
MLF is a professionally run organization, with defined processes in place. This
when coupled with the company’s business strategy, where sales cycle is ahead of
the execution cycle, leads us to anticipate that it would face minimal impact on the
day-to-day business operations.
Further, many of the smaller developers in our view are not professionally run and
do not follow ideal industry practices. As a result, they are exposed to higher
business risks in the case of the bill getting passed. This unearths huge potential
for MLF to scale up its business at the cost of unorganized small developers, which
would eventually lose business. The reason for we forming a view that MLF should
be a key beneficiary is owing to its financially strong position, professionally well
run management, and ideal industry practices being put in to place.
August 22, 2016
6
Initiating coverage | Mahindra Lifespace Developers
On the whole, we see the passage of this bill to be positive for MLF in the long run
given that it is well placed to see minimal changes to the conduct of its business
and huge business opportunities emerging.
SEZ business a long-term story
MLF is developing two integrated business cities “Mahindra World City (MWC)”, ie
one each in Chennai (~1,600 acres) and Jaipur (~3,000 acres) with total area of
~4,600 acres on lines of work-live-plug-n-play infrastructure. These cities are
meticulously planned and have been divided into zones for business and lifestyle.
These comprise of Special Economic Zone (SEZ) and Domestic Tariff Area (DTA).
The lifestyle zone, located in close proximity to the Business Zone, offers residential
units, school, medical centers, retail malls, business hotels, and recreation and
leisure facilities amidst wide open green spaces.
Mahindra World City Chennai has been in existence for the last 13 years, with
3 broad sectors functioning- IT Services, Apparel & Fashion Accessories, and Auto
Ancillaries (which is a domestic tariff area, DTA). The entire business zone has
64 customers (51 operational) and provides employment to ~38,000 people. 804
acres of the total 848 acres of industrial area and 257 acres of the total 289 acres
of residential and social area have been leased, indicating that the project has
attained maturity.
MLF expects to leverage on its MWC success and is in the process of launching
~300 acres of integrated development project in North Chennai, home to large
industries in the engineering and automobile sector. It expects to invest `375cr
towards the development of this property. In 1QFY2016, MLF announced a tie-up
with Sumitomo Corp in 60/40 ratio to execute this project.
With 95% of the industrial area and 89% of residential areas being leased at MWC
Chennai, we expect the revenues to be stagnant for FY2017-18E. With likely
commencement of operations at North Chennai development project, we expect
FY2018E revenues to see 30% yoy revenue growth to `30cr. On the same lines, we
expect EBITDA also to be flat in FY2017E, and see strong yoy growth in FY2018E
to `70cr.
Exhibit 14: MWC Chennai business performance
Exhibit 15: MWC Jaipur business performance
140
140
120
120
100
100
80
80
60
60
40
40
20
20
0
0
FY2013
FY2014
FY2015
FY2016
FY2017
FY2018
FY2013
FY2014
FY2015
FY2016
FY2017
FY2018
Revenues
EBITDA
Revenues
EBITDA
Source: Company, Angel Research
Source: Company, Angel Research
August 22, 2016
7
Initiating coverage | Mahindra Lifespace Developers
Trying to replicate its MWC Chennai’s success, MLF entered the Jaipur SEZ market
through its 74% subsidiary MWC, Jaipur. Of the total ~2,061 acres of saleable
area, the SEZ accounts for 1,026 acres, DTA accounts for 349 acres and the
remaining 686 acres are residential. ~366 acres of SEZ area (36% of SEZ area)
and 316 acres of DTA area (91% of DTA area) has been leased. Given the better
than expected absorption of DTA, MWC Jaipur applied for conversion of
residential land to DTA and it recently got all approvals for the 500 acres land
parcel. As a result, now DTA area stands at 793 acres and the residential areas
stands at 186 acres. The residential area is yet to be launched. We expect that on
attaining more maturity from DTA space, the company would announce launch of
its residential project.
Even though the Jaipur SEZ has a long-way to turn successful, we expect the
following favorable reasons to contribute to its growth, (1) proximity to Delhi NCR’s
industrial cluster and ports on the west coast, (2) as per our estimate, over a third
of the Delhi-Mumbai freight corridor would pass through Rajasthan, (3) incentives/
tax benefits for SEZ/DTA. Even though the current capex cycle is slow, we expect all
the above factors to gradually contribute to MWC Jaipur’s growth from here on.
We expect MWC Jaipur to report 16.1% top-line and 13.0% EBITDA CAGR during
FY2016-18E, to `97.3cr and `104.6cr, respectively.
August 22, 2016
8
Initiating coverage | Mahindra Lifespace Developers
Valuation
At the current market price of `432, the stock is trading at 1.0x FY2018E P/BV.
Considering the quality of Management and better leverage position, we believe
the current valuations are attractive. We are initiating coverage on MLF with a BUY
recommendation and target price of `522, using the NAV methodology, as it
captures the true and long-term value of the SEZ and real estate business. To
arrive at NAV value, (1) we have considered discounting rate of 15% for SEZ and
real estate business, (2) valued commercial property at 9% cap rate.
In terms of vertical wise break-up, the residential segment contributes 75% to our
target price valuation, followed by SEZ contributing 20% to our target valuation.
Exhibit 16: NAV based valuation
FY2017E
MLD
Stake
Value/
Project Details
FCFE Value
Stake (%)
Value (` cr)
share (`)
(` cr)
MWC, Chennai &
72
89
64
16
N-Chennai SEZ
MITL
39
97
38
9
MRDL
73
100
73
18
Avadi
51
100
51
12
MWC Jaipur SEZ
492
74
364
89
MWC Jaipur (Residential)
90
74
67
16
Andheri
289
100
289
70
Sakinaka
260
100
260
63
Kandivalli
74
100
74
18
Boisar
30
100
30
7
Alibaug
74
100
74
18
Thane
114
100
114
28
Palghar
121
100
121
29
Bengaluru
179
50
90
22
Aura- Delhi NCR
29
100
29
7
Luminare- Delhi NCR
537
50
269
66
Pune
334
100
334
81
Hyderabad
71
100
71
17
Nagpur
90
70
63
15
Land Parcel (paid) & Others
420
100
420
102
Gross Totals
3,439
2,895
703
Net Debt (Std.)
(89)
NAV /share
614
Discount to NAV- @15%
522
CMP
432
Upside (%)
20.8
Source: Company, Angel Research
August 22, 2016
9
Initiating coverage | Mahindra Lifespace Developers
Risk & Concerns
Delays in getting project as well as land approvals across cities could delay the
projects. These delays could act as a major risk to our execution estimates.
Removal of MAT exemption or Rajasthan government exemptions, may impact SEZ
demand outlook, which in-turn could affect our revenue growth assumptions.
August 22, 2016
10
Initiating coverage | Mahindra Lifespace Developers
Profit & Loss Statement
Y/E March (` cr)
FY13
FY14
FY15
FY16
FY17E
FY18E
Net Sales
738
705
1,086
826
1,152
1,300
% Chg
5.3
(4.5)
54.0
(23.9)
39.5
12.8
Total Expenditure
496
535
662
660
890
980
Operating Expenses
398
426
501
502
718
791
Employee benefits Expense
35
40
55
67
74
83
Admin. & Other Expenses
63
69
106
91
98
106
EBITDA
242
170
424
166
262
320
% Chg
26.4
(29.6)
149.2
(60.8)
57.4
22.3
EBIDTA %
32.8
24.1
39.1
20.1
22.7
24.6
Depreciation
9
10
13
19
21
22
EBIT
233
160
411
147
241
298
% Chg
28.1
(31.3)
156.5
(64.2)
63.9
23.5
Interest and Fin. Charges
31
50
51
51
47
42
Other Income
34
51
61
51
39
42
PBT
236
161
421
147
233
298
Exceptional Item
0
0
0
0
0
0
PBT after Exceptional Item
236
161
421
147
233
298
Tax Expenses
80
51
138
50
76
97
% of PBT
33.9
31.6
32.7
34.1
32.8
32.5
PAT before Minority Interest
156
110
283
97
156
201
Minority Interest
(15)
(9)
(17)
(4)
(34)
(54)
Rep. PAT
141
101
266
93
123
147
% Chg
18.7
(28.8)
164.5
(65.0)
31.8
19.9
PAT %
19.1
14.3
24.5
11.3
10.6
11.3
Diluted EPS
35
25
65
23
29.9
35.8
% Chg
18.7
(28.8)
163.4
(65.0)
31.8
19.9
August 22, 2016
11
Initiating coverage | Mahindra Lifespace Developers
Balance Sheet
Y/E March (` cr)
FY13
FY14
FY15
FY16 FY17E FY18E
Sources of Funds
Equity Capital
41
41
41
41
41
41
Reserves & Surplus
1,252
1,221
1,434
1,522
1,619
1,724
Networth
1,293
1,262
1,475
1,563
1,660
1,765
Total Debt
966
1,401
1,238
1,505
1,260
1,288
Minority Interest
86
84
97
170
204
258
Deferred Tax Liability
37
43
56
40
40
40
Total Liabilities
2,382
2,790
2,866
3,279
3,165
3,352
Application of Funds
Gross Block
256
276
317
337
432
475
Accumulated Depreciation
47
56
66
85
106
128
Net Block & C-WIP
216
236
259
255
330
350
Goodwill
95
102
102
102
102
102
Investments
133
301
222
382
382
382
Current Assets
2,414
2,787
3,026
3,635
3,207
3,465
Inventories
1,631
1,776
1,970
2,423
1,946
2,077
Sundry Debtors
90
109
59
74
161
178
Cash and Bank Balance
144
67
77
181
440
609
Loans & Advances
433
693
694
632
319
318
Other Current Asset
115
142
225
326
341
283
Current Liabilities
476
637
743
1,096
856
947
Net Current Assets
1,937
2,150
2,283
2,540
2,351
2,518
Total Assets
2,382
2,790
2,866
3,279
3,165
3,352
August 22, 2016
12
Initiating coverage | Mahindra Lifespace Developers
Cash Flow Statement
Y/E March (` cr)
FY13
FY14
FY15
FY16
FY17E
FY18E
Profit after tax
141
101
266
93
123
147
Depreciation
9
10
13
19
21
22
Change in Working Capital
(407)
(360)
(54)
(263)
525
98
Net Interest & Fin. Charges
(3)
(1)
(10)
(0)
8
0
Direct taxes & Other Adj.
16
(4)
11
(67)
(76)
(97)
Cash Flow from Operations
(244)
(255)
226
(217)
600
171
(Inc)/ Dec in Fixed Assets
(22)
(30)
(49)
(16)
(95)
(42)
(Inc)/ Dec in Investments
191
(165)
92
51
39
42
Cash Flow from Investing
169
(195)
42
36
(56)
(0)
Dividend & oth. Adj.
(3)
(132)
(53)
(5)
(26)
(42)
Inc./ (Dec.) in Loans
284
575
(158)
341
(211)
82
Goodwill on consolidation
(66)
(7)
0
0
0
0
Interest Expenses
(31)
(50)
(51)
(51)
(48)
(42)
Cash Flow from Financing
184
386
(263)
285
(285)
(3)
Inc./(Dec.) in Cash
109
(64)
6
104
259
168
Opening Cash balances
150
122
58
77
181
440
Closing Cash balances
259
58
64
181
440
608
August 22, 2016
13
Initiating coverage | Mahindra Lifespace Developers
Key Ratios
Y/E March
FY13
FY14
FY15
FY16
FY17E FY18E
Valuation Ratio (x)
P/E (on FDEPS)
12.5
17.5
6.7
19.0
14.4
12.1
P/CEPS
11.8
15.9
6.3
15.8
12.4
10.5
Dividend yield (%)
1.4
1.4
2.6
1.2
1.1
1.2
EV/Sales
3.5
4.4
2.7
3.7
2.2
1.9
EV/EBITDA
10.7
18.2
6.9
18.6
9.9
7.7
EV / Total Assets
1.1
1.1
1.0
0.9
0.8
0.7
Per Share Data (`)
EPS (fully diluted)
35
25
65
23
30
36
Cash EPS
37
27
68
27
35
41
DPS
6
6
16
4
5
9
Book Value
317
309
360
381
405
430
Returns (%)
RoCE (Pre-tax)
11.4
6.5
15.3
5.1
8.1
10.0
Angel RoIC (Pre-tax)
9.4
4.2
12.8
3.3
8.1
10.1
RoE
10.9
7.9
19.5
6.1
7.6
8.6
Turnover ratios (x)
Asset Turnover (Gross Block) (X)
2.9
2.6
3.4
2.5
2.7
2.7
Inventory / Sales (days)
806
919
662
1,071
617
583
Receivables (days)
45
56
20
33
51
50
Payables (days)
236
330
250
484
271
266
Leverage Ratios (x)
D/E ratio (x)
0.7
1.1
0.8
1.0
0.8
0.7
Interest Coverage Ratio (x)
7.5
3.2
8.0
2.9
5.1
7.1
August 22, 2016
14
Initiating coverage | Mahindra Lifespace Developers
Research Team Tel: 022 - 39357800
DISCLAIMER
Angel Broking Private Limited (hereinafter referred to as “Angel”) is a registered Member of National Stock Exchange of India Limited,
Bombay Stock Exchange Limited and Metropolitan Stock Exchange Limited. It is also registered as a Depository Participant with CDSL
and Portfolio Manager with SEBI. It also has registration with AMFI as a Mutual Fund Distributor. Angel Broking Private Limited is a
registered entity with SEBI for Research Analyst in terms of SEBI (Research Analyst) Regulations, 2014 vide registration number
INH000000164. Angel or its associates has not been debarred/ suspended by SEBI or any other regulatory authority for accessing
/dealing in securities Market. Angel or its associates/analyst has not received any compensation / managed or co-managed public
offering of securities of the company covered by Analyst during the past twelve months.
This document is solely for the personal information of the recipient, and must not be singularly used as the basis of any investment
decision. Nothing in this document should be construed as investment or financial advice. Each recipient of this document should
make such investigations as they deem necessary to arrive at an independent evaluation of an investment in the securities of the
companies referred to in this document (including the merits and risks involved), and should consult their own advisors to determine
the merits and risks of such an investment.
Reports based on technical and derivative analysis center on studying charts of a stock's price movement, outstanding positions and
trading volume, as opposed to focusing on a company's fundamentals and, as such, may not match with a report on a company's
fundamentals. Investors are advised to refer the Fundamental and Technical Research Reports available on our website to evaluate the
contrary view, if any.
The information in this document has been printed on the basis of publicly available information, internal data and other reliable
sources believed to be true, but we do not represent that it is accurate or complete and it should not be relied on as such, as this
document is for general guidance only. Angel Broking Pvt. Limited or any of its affiliates/ group companies shall not be in any way
responsible for any loss or damage that may arise to any person from any inadvertent error in the information contained in this report.
Angel Broking Pvt. Limited has not independently verified all the information contained within this document. Accordingly, we cannot
testify, nor make any representation or warranty, express or implied, to the accuracy, contents or data contained within this document.
While Angel Broking Pvt. Limited endeavors to update on a reasonable basis the information discussed in this material, there may be
regulatory, compliance, or other reasons that prevent us from doing so.
This document is being supplied to you solely for your information, and its contents, information or data may not be reproduced,
redistributed or passed on, directly or indirectly.
Neither Angel Broking Pvt. Limited, nor its directors, employees or affiliates shall be liable for any loss or damage that may arise from
or in connection with the use of this information.
Disclosure of Interest Statement
Mahindra Lifespace Developers
1. Financial interest of research analyst or Angel or his Associate or his relative
No
2. Ownership of 1% or more of the stock by research analyst or Angel or associates or relatives
No
3. Served as an officer, director or employee of the company covered under Research
No
4. Broking relationship with company covered under Research
No
Ratings (Based on expected returns
Buy (> 15%)
Accumulate (5% to 15%)
Neutral (-5 to 5%)
over 12 months investment period):
Reduce (-5% to -15%)
Sell (< -15)
August 22, 2016
15