IPO note | Oil & Gas
June 20, 2016
Mahanagar Gas Limited
SUBSCRIBE
ssue Open: June 21, 2016
I
Business to gain further traction, Valuations Attractive
Issue Close: June 23, 2016
Company background: Mahanagar Gas Ltd (MGL) is the third largest city gas
Issue Details
distribution (CGD) company in India with a history of 20+ years of natural gas
distribution in Mumbai and adjoining areas. MGL is promoted by GAIL and
Face Value: `10
British Gas. As of FY2016-end, MGL served 0.47mn vehicles through its 4,646km
Present Eq. Paid up Capital: `98.8cr
of pipeline and 188 compressed natural gas (CNG) filling stations. It supplies
piped natural gas (PNG) to 0.86mn domestic households, 2,800 commercial
Fresh Issue: 0.0cr Shares
consumers and 60 industrial consumers.
Offer for Sale: 2.46cr Shares
MGL is the sole CGD operator for Mumbai, Thane, Navi Mumbai, and Raigad
Post Eq. Paid up Capital: `98.8cr
districts. Mumbai and adjoining areas are currently under penetrated (CNG is served to
Issue size (amount): `938.4-1,039.6cr
0.47mn of targeted 2.15mn motor vehicles; PNG is served to ~0.9mn of targeted
Price Band: `380-421
2.71mn households). MGL enjoys a monopolistic position in its markets owing to
(1) entry barriers for new players in the form of regulatory restrictions,
Lot Size: 35 shares and in multiple there-of
(2) parentage support which assures a majority of its gas requirement from GAIL,
Post-issue implied mkt. cap:
`3,753.6cr- 4,158.5cr
and (3) huge pipeline infrastructure which continues to grow. We expect MGL to
Promoters holding Pre-Issue: 100.0%
report 7-8% volume growth over the next few quarters.
Promoters holding Post-Issue: 75.0%
86% of MGL’s volumes are accounted by its CNG and domestic PNG business,
which have a stable outlook. Considering the government’s long-term plans to
phase out LPG subsidy amongst affluent classes, CNG/domestic PNG penetration
in Mumbai at ~22/28% levels, coupled with assured 86% of gas supplies on
Book Building
cheaper rates on APM and PMT prices (currently APM price is at $3.06/mmbtu),
QIBs
50% of issue
there exists scope for economies of scale to come into play.
Non-Institutional
15% of issue
Valuation: On considering (1) almost similar growth potential as that of the
Retail
35% of issue
industry peer Indraprastha Gas (IGL), (2) 22%+ RoE levels as reported in the last
6 years, (3) debt free status, (4) yearly cash flow generating potential of `200cr+,
(5) strong dividend payout ratio (Management has guided for 35% dividend pay-
out; translates to ~4% dividend yield), the issue at 12.9x PE FY2016 (vs peers
Post Issue Shareholding Pattern
trading at over 18.0x) is attractively priced. We recommend SUBSCIRBE to
Promoters Group
75.0
Mahanagar Gas IPO.
DIIs/FIIs/Public & Others
25.0
Key Financials
Y/E March (` cr)
FY12
FY13
FY14
FY15
FY16
Net Sales
1,309
1,514
1,885
2,095
2,079
% chg
15.7
24.5
11.1
(0.8)
Net Profit
319
277
314
318
322
% chg
(13.3)
13.4
1.4
1.3
EBITDA (%)
38.0
29.3
25.9
23.4
24.7
EPS (`)
32
28
32
32
33
P/E (x)
13.0
15.0
13.2
13.0
12.9
P/BV (x)
3.4
3.2
2.9
2.7
2.5
RoE (%)
29.9
23.4
25.3
23.5
22.0
RoCE (%)
40.7
31.5
31.4
29.1
28.1
Yellapu Santosh
EV/Sales (x)
2.8
2.4
2.0
1.7
1.7
022 - 3935 7800 Ext: 6811
EV/EBITDA (x)
7.5
8.3
7.5
7.4
7.0
Source: Company, Note: Valuation multiples on upper end (i.e. ` 421) of price band
Please refer to important disclosures at the end of this report
1
Mahanagar Gas | IPO note
Issue Details
MGL is offering 2.46cr equity shares of `10 each via book building route in the
price band of `380-421/share, entirely comprising offer for sale by current
promoters GAIL and BYBG Asia Pacific Holdings Pte.
Exhibit 1: Shareholding Pattern
Pre-Issue
Post-Issue
Particulars
No. of Shares
(%)
No. of Shares
(%)
Promoter Group
98,777,778
100.0
74,083,278
75.0
Retail & HNI Investors
0
0.0
12,347,250
12.5
Institutional Investors
0
0.0
12,347,250
12.5
Source: Company, Angel Research
Objects of the Offer
Objects of the Offer are to achieve benefits of listing equity shares on stock
exchanges and to carry out the offer for sale. Listing of equity shares will
enhance MGL’s brand name and provide liquidity to existing shareholders.
The listing will also provide a public market for the equity shares in India.
June 20, 2016
2
Mahanagar Gas | IPO note
Company details
MGL is India’s third largest CGD company with 20 years of natural gas distribution
experience in Mumbai and its adjoining areas. The company was incorporated on
May 8, 1995 as a joint venture between GAIL and British Gas, with each holding
49.75% stake, with the balance 0.5% being held by the Maharashtra government.
Post conversion of compulsory convertible shares on Jun 7, 2016, Maharashtra
government’s stake increased to 10%. Post IPO, both the promoters holding would
decrease to 32.5% stake each in the company.
MGL operates as CGD operator for 3 areas, namely, (1) Mumbai (includes south
Mumbai, Central Mumbai & Mumbai suburbs), (2) Thane district (includes areas
like Kalyan, Ambarnath and Badlapur), Bhiwandi & Navi Mumbai, and (3) Raigad
district (includes Karjat and Poladpur). The first license for Mumbai area was
awarded in 1995, with marketing/networking exclusivity till Jan-2012/
2020.
Thereafter, MGL won second license for Thane District, Bhiwandi & Navi Mumbai
areas in 2005, with marketing/networking exclusivity till Jan-2012/ 2030. Third
license was won by MGL in 2015 for Raigad district, with marketing/networking
exclusivity till 2020/2040. Notably, regulations provide for extension of networking
exclusivity for another 10 years.
As of FY2016-end, MGL with its supply network of 4,646km of pipeline (includes
~4,231km of polyethylene pipeline and 415km of steel pipeline) and 188 CNG
filling stations (13 owned by MGL; remaining are either owned by OMCs [oil
marketing companies] and private parties or are situated at state transportations
bus depots) served 0.47mn vehicles. It supplies piped natural gas (PNG) to
0.86mn domestic households, 2,800 commercial consumers and 60 industrial
consumers.
June 20, 2016
3
Mahanagar Gas | IPO note
Industry peers
In the Indian CGD space, MGL comes next to IGL and Gujarat Gas Ltd (GGL).
The following table highlights the business model of industry peers:
Exhibit 2: Peer Group Comparison
MGL
IGL
Gujarat Gas
Gujarat (19 districts),
Companies
Mumbai, Thane
Delhi
Dadra Nagar & Haveli
& Raigad
NCR
& Thane (Rural)
CNG stations
188
340
248
CNG stations- JVs with OMC
136
156
150
CNG stations- Owned
13
129
70
CNG stations- Owned (as % of total)
7
38
28
CNG Vehicles served (mn)
0.47
0.87
0.50
CNG Vehicles targeted (mn)
2.15
3.15
2.75
CNG vehicle penetration (%)
22
28
18
CNG volumes (mmscmd)
1.8
3.1
0.9
PNG- Domestic cm (mn)
0.87
0.64
1.46
PNG- Domestic cm target (mn)
3.08
2.00
12.20
PNG- Domestic cm penetration (%)
28
32
12
PNG- Ind./Commercial cm
2,866/ 60
2,580
11,500/ 2,700
PNG volumes (mmscmd)
0.6
0.9
4.7
Sales Mix (%):
CNG
74
77
16
PNG-Domestic
12
6
9
PNG-Commercial
6
11
75
PNG-Industrial
8
Trading
0
6
0
Source: Company RHP, Annual Reports & Presentations, Media Articles, Angel Research
In comparison to peers, and on considering pace of growth of Mumbai city and
adjoining areas, we see huge long-term opportunity emerging for MGL across
both, CNG & PNG businesses.
June 20, 2016
4
Mahanagar Gas | IPO note
Investment Rationale
Decent volume growth in non-supportive regulatory environment
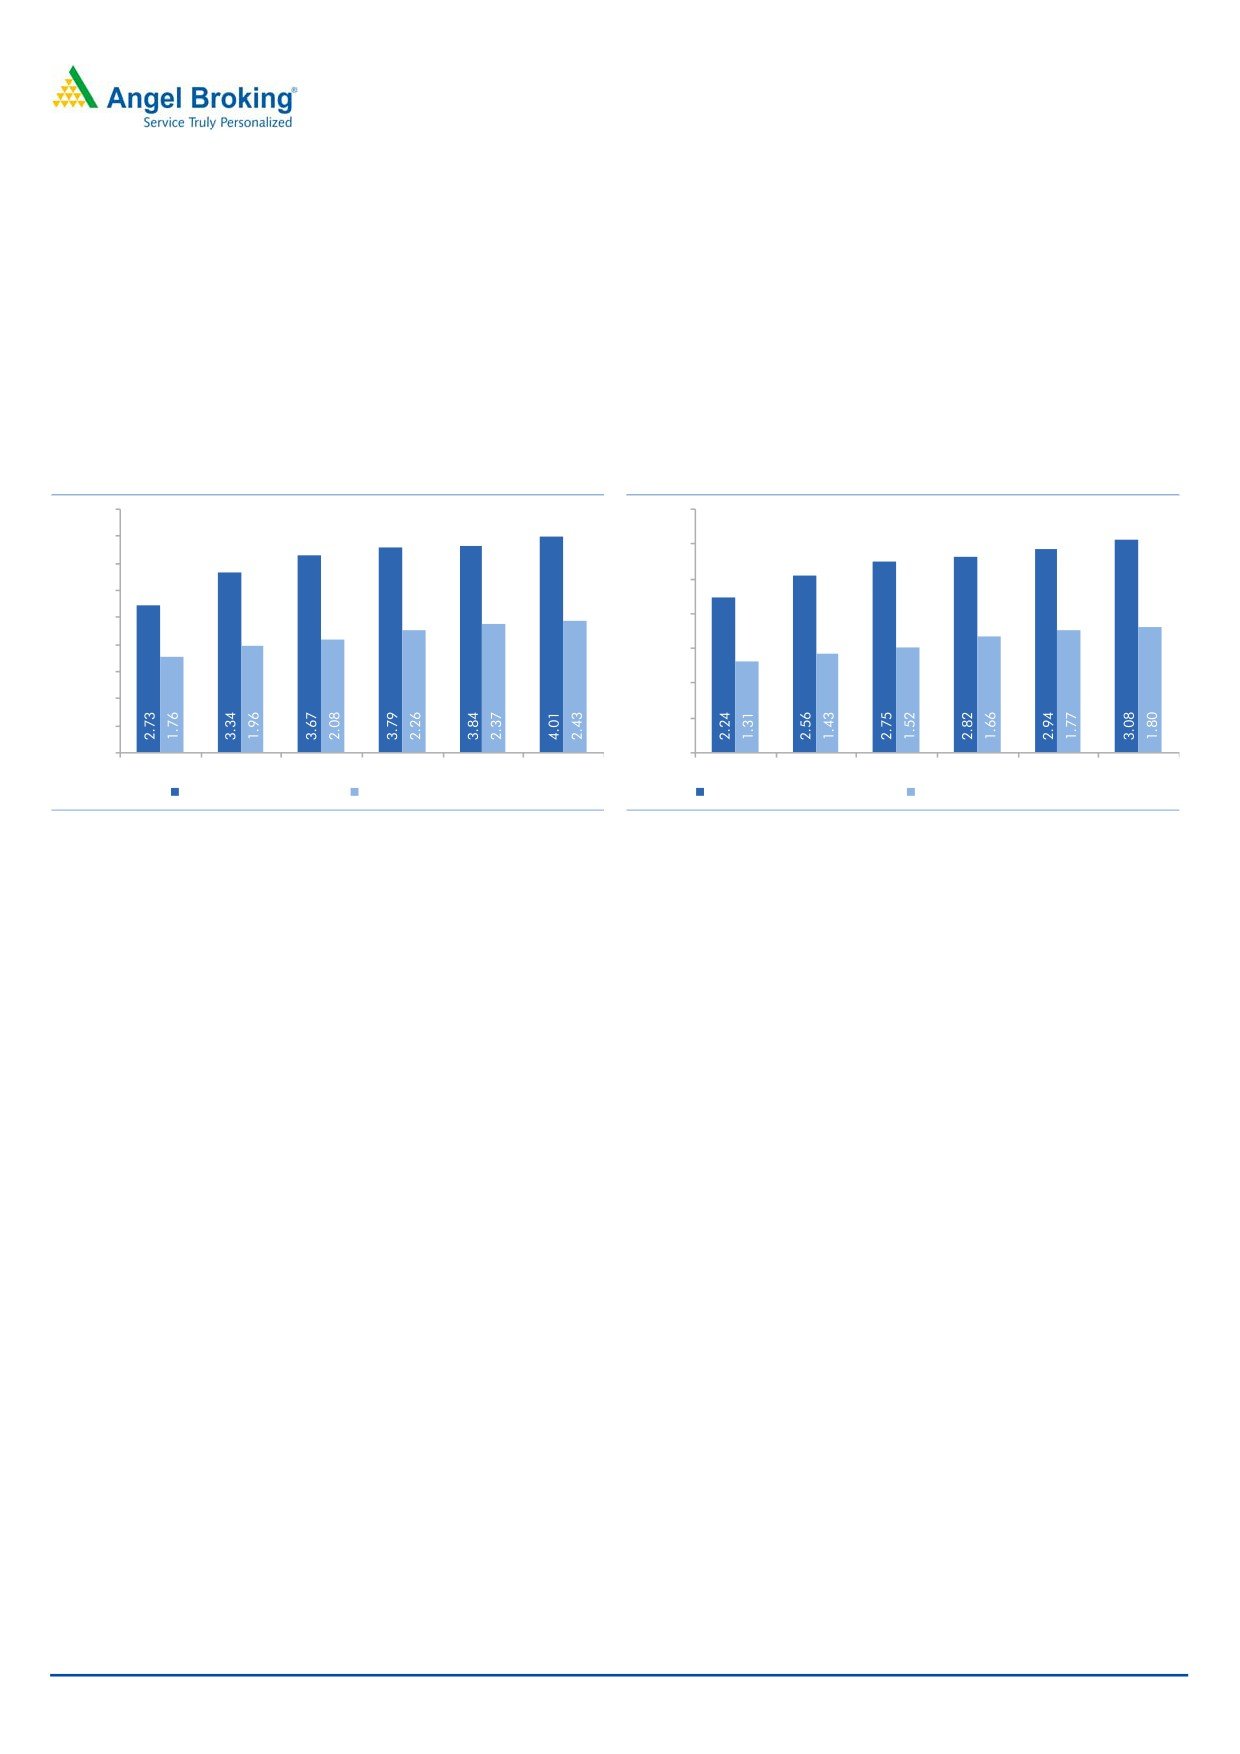
MGL reported 6.7% volume CAGR during FY2011-16, with PNG (26% of FY2016
volumes) reporting 7.0% volume CAGR and CNG (74% of FY2016 volumes)
reporting 6.6% volume CAGR, during the same period. Again if we look at PNG
sub-segments, then volume growth was mainly driven by the domestic segment
which reported 9.2% volume CAGR during FY2011-16.
Exhibit 3: IGL vs. MGL Total Sale volume trends
Exhibit 4: : IGL vs. MGL CNG sale volume trends
4.50
3.50
4.00
3.00
3.50
2.50
3.00
2.50
2.00
2.00
1.50
1.50
1.00
1.00
0.50
0.50
0.00
0.00
FY2011
FY2012
FY2013
FY2014
FY2015
FY2016
FY2011
FY2012
FY2013
FY2014
FY2015
FY2016
IGL volume (mmscmd)
MGL volume (mmscmd)
IGL CNG volume (mmscmd)
MGL CNG volume (mmscmd)
Source: Company, Angel Research
Source: Company, Angel Research
IGL reported
6.5% CNG volume CAGR during FY2011-16 supported by
regulations (compulsory conversion of public transport and new taxis to CNG)
while MGL reported similar volume CAGR of 6.6% during the same period without
any regulatory support. We sense MGL’s matching performance despite absence
of regulatory support is owing to cost benefits that CNG offers in comparison to
other liquid fuels (like petrol, diesel). Also, MGL at regular intervals has been able
to take price hikes to maintain its gross margins. We expect MGL to continue
reporting such growth on the back of following, (1) more number of private
vehicles switching to CNG, (2) more public transport buses switching to CNG, and
(3) volumes kicking-in from newly added Raigad district.
Favourable Sales mix
Unlike its peer GGL, which gets
75% of its sales from PNG-Industrial &
Commercial, MGL enjoys favourable business model, where it gets 86% of its sales
from retail driven CNG & PNG-Domestic business (combined). Industrial &
Commercial PNG users are more price sensitive than retail CNG and PNG users.
Industrial & Commercial PNG users tend to switch to alternative fuels (like LPG) in
an adverse pricing scenario, given that their plants are built to run on duel fuels.
Also, from a margin profile perspective, business models with high dependency on
Industrial volumes could lead to lower margins (as seen from GGL’s margins).
CNG - huge scope for penetration
MGL claims that it supplied CNG to ~0.47mn vehicles in FY2016 of the total
~6.7mn motor vehicles in Mumbai, Thane and Navi Mumbai region (vehicle count
as of Jul-2015, Source: Mumbai Transport Commissioner’s office) through 188
CNG stations. MGL has indicated target market to be at ~2.15mn motor vehicles
June 20, 2016
5
Mahanagar Gas | IPO note
and has planned to add 83 CNG stations in next 5 years. We see possibility of
such planned expansion materializing given the scope to penetrate in the light of
IGL’s 28% penetration levels in Delhi. Further, our view gets strengthened from the
point that CNG operated vehicles have grown at 13.75% CAGR during FY2010-
16 in Mumbai and adjoining areas, outpacing the overall vehicle growth (Source:
Mumbai Transport Commissioner’s office).
Also outcome of a High Court case, which intends to direct conversion of all public
transport buses in Mumbai and adjoining areas, is pending. Any favorable ruling
could contribute to significant uptick in CNG volumes from state public transport.
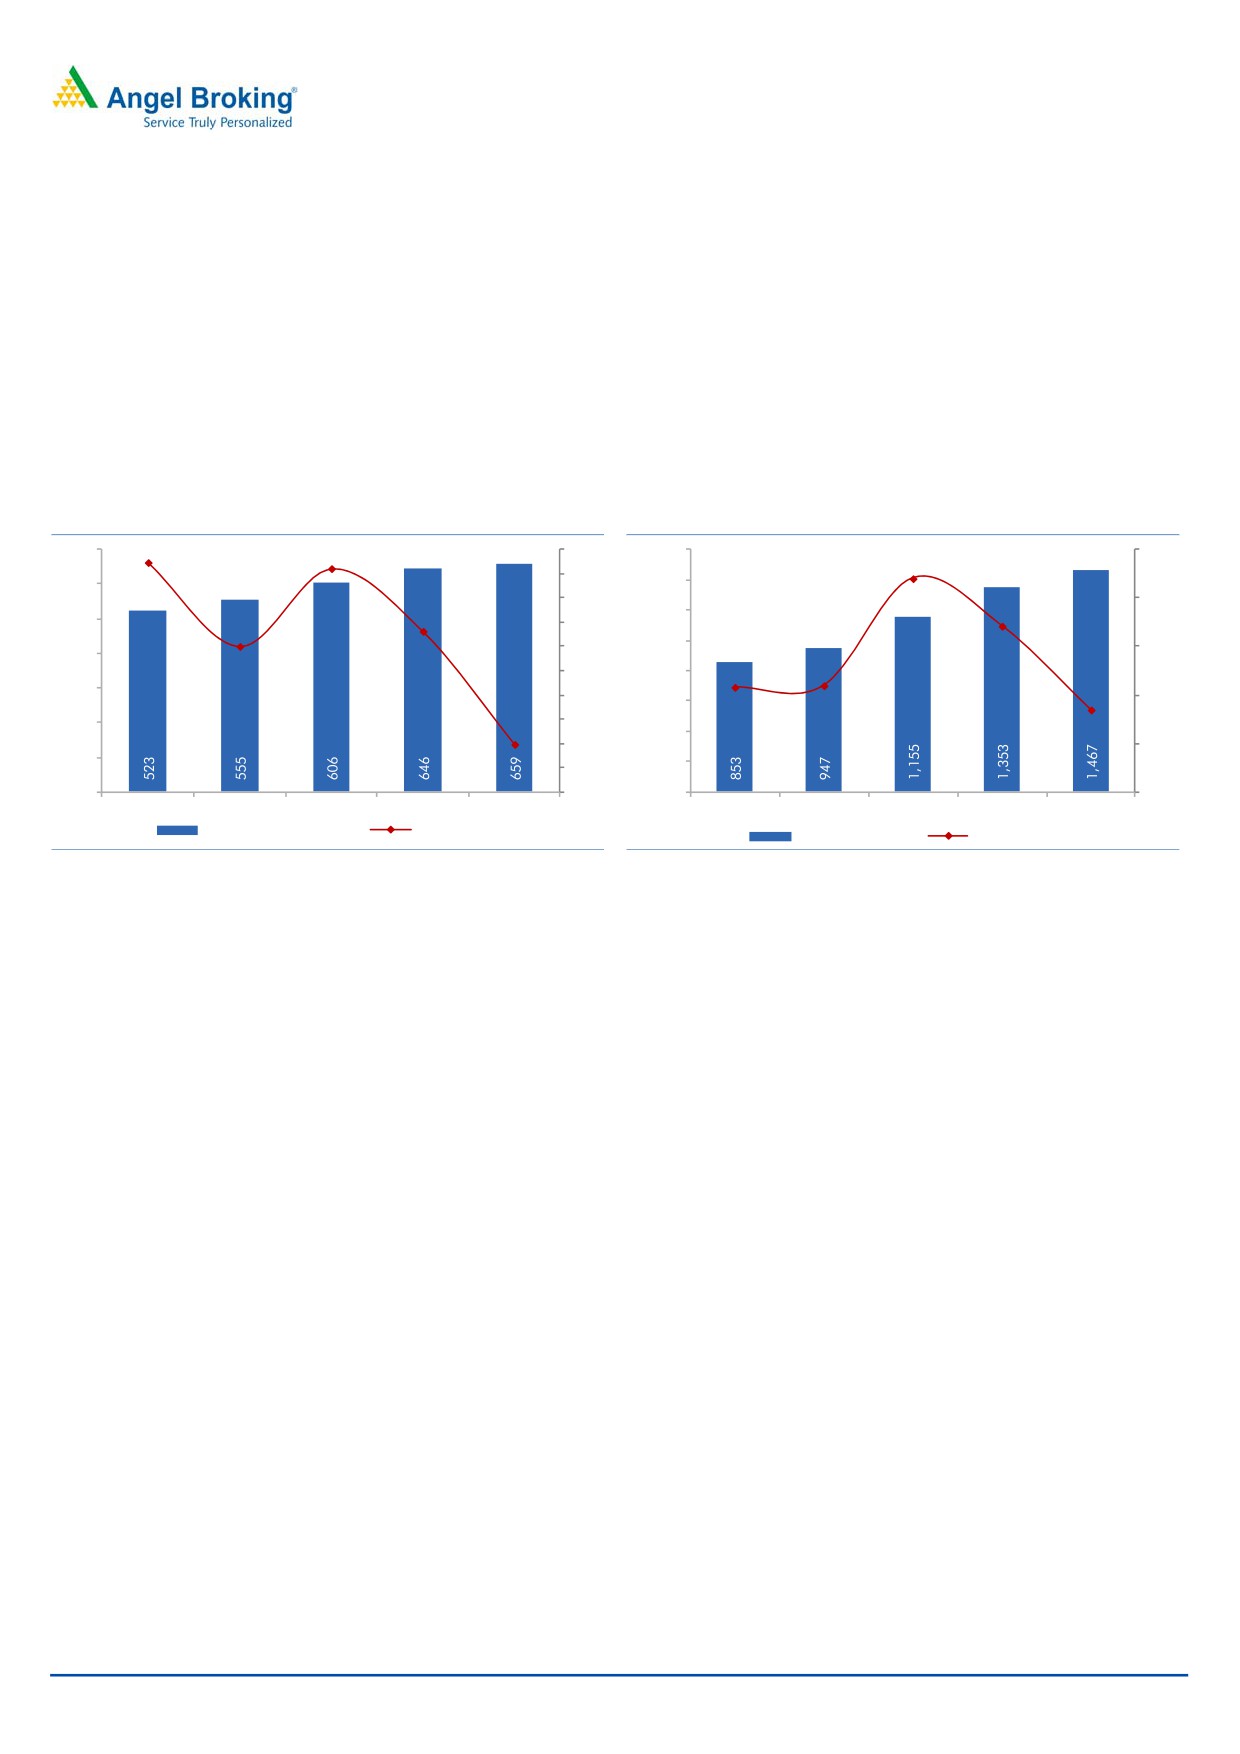
Exhibit 5: CNG Volume trend
Exhibit 6: CNG yearly sale trend
700
9.5%
9.2%
10%
1,600
25%
22.0%
9%
1,400
17.1%
600
8%
20%
6.6%
1,200
500
6.0%
7%
11.0%
1,000
10.8%
6%
15%
400
5%
800
8.5%
300
4%
10%
600
200
2.0%
3%
400
2%
5%
100
200
1%
0
0%
0
0%
FY2012
FY2013
FY2014
FY2015
FY2016
FY2012
FY2013
FY2014
FY2015
FY2016
CNG sale vol. (mmscm)
yoy growth (%)
CNG sales (` cr)
yoy growth (%)
Source: Company, Angel Research
Source: Company, Angel Research
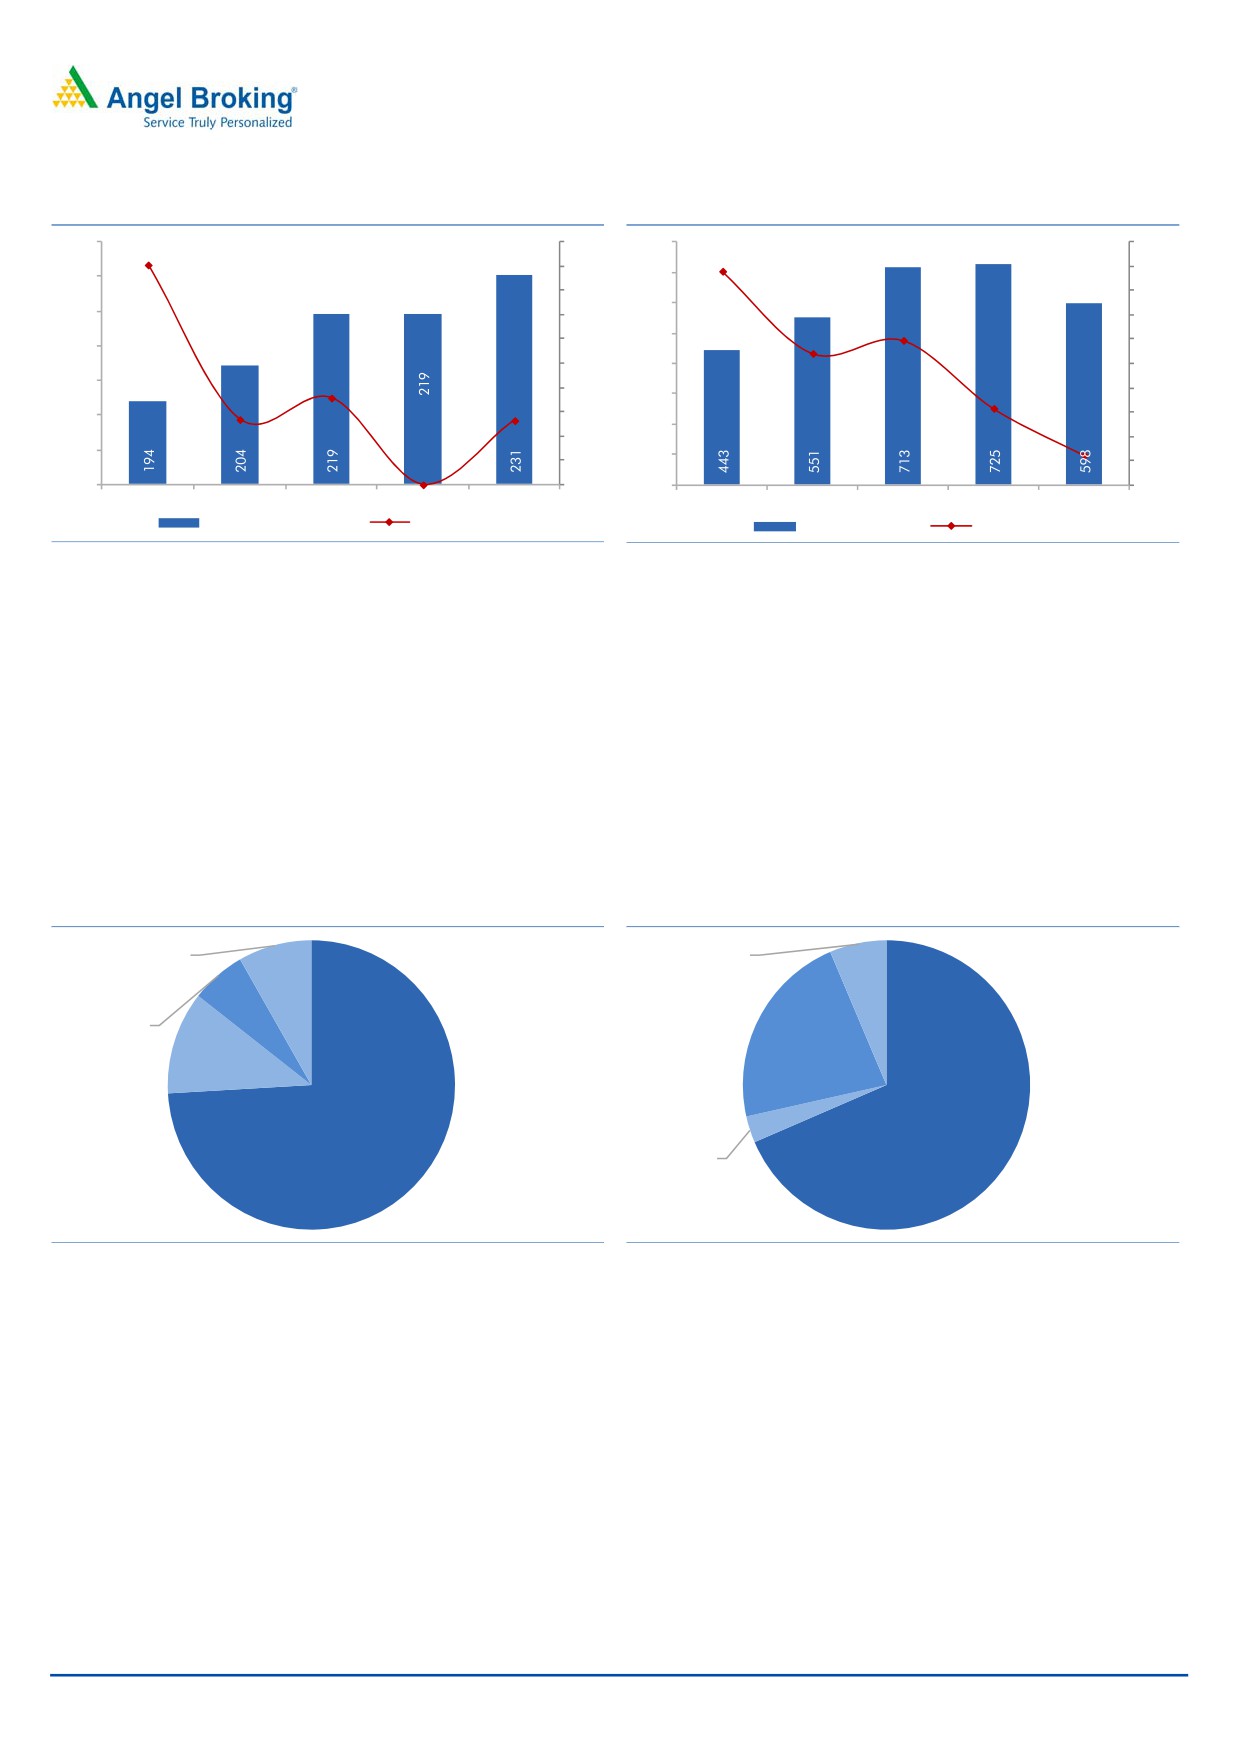
PNG growth seen in tougher environment…
As of FY2016-end, MGL reported 0.87mn domestic PNG users against the target
households of 3.08mn, indicating 28.2% penetration. IGL at FY2016-end had
0.64mn domestic PNG users, against its own internal potential estimate of 2mn,
indicating 32.0% penetration. Domestic PNG users currently contribute 12% of the
total sale volumes at 2.43mmscmd. MGL Management sees potential opportunity
of ~1.0mmscmd of volumes from domestic PNG users. What impresses us about
this business is that it assures revenue sustainability and can possibly lead to higher
margins in the long-run.
Currently 2,866 of 9,000-10,000 targeted Commercial customers are connected.
With expensive long-term contracts signed and alternative fuel (like PNG) getting
cheaper, PNG sales to Industrial and Commercial customers started moderating in
FY2014-15. Despite ~30% correction in spot LNG prices at ~5/MMBtu in the last
1-year, we do not expect major uptick in business from Commercial/Industrials
side, given that there are smaller number of industries which have access to low
price alternative fuels. It’s only incremental volumes from Raigad region that could
make noticeable contribution to PNG Commercial/Industrials side of the business.
June 20, 2016
6
Mahanagar Gas | IPO note
Exhibit 7: PNG Volume trend
Exhibit 8: PNG yearly sale trend
240
18.1%
20%
800
58.0%
70%
18%
60%
230
700
16%
50%
600
24.2%
220
14%
40%
29.5%
500
12%
30%
210
10%
400
1.6%
20%
200
7.1%
8%
10%
300
5.4%
5.3%
190
6%
(17.5%_
0%
200
4%
-10%
180
100
0.0%
2%
-20%
170
0%
0
-30%
FY2012
FY2013
FY2014
FY2015
FY2016
FY2012
FY2013
FY2014
FY2015
FY2016
PNG sale vol. (mmscm)
yoy growth (%)
PNG sales (` cr)
yoy growth (%)
Source: Company, Angel Research
Source: Company, Angel Research
Margin expansion lags growth
Favorable Gas sourcing strategy in place
Post implementation of revised Ministry of Petroleum and Natural Gas (MoPNG)
guidelines in Aug-2014, GAIL is directed to supply natural gas 10% over and
above 100% requirement of each CGD entity (taking into account last 6 months
consumption by the CGD) towards supply to priority sector. Given that MGL serves
85.6% of its gas volumes under the priority sector, we are assured that availability
of the cheaper domestic gas would continue going forward.
Exhibit 9: MGL FY2016 Sale Volume mix
Exhibit 10: MGL FY2016 Gas vol. Sourcing mix
PNG-
Mid/Short term
Industrial,
LNG , 6.0%
8.2%
PNG-
Commercial,
6.2%
PNG-
Domestic,
PMT, 20.9%
11.5%
CNG, 74.1%
APM, 64.7%
Non APM,
2.8%
Source: Company, Angel Research
Source: Company, Angel Research
MGL currently sources 85.5% of its total purchase from the domestic sources
(administered price mechanism [APM] and Panna-Mukta and Tapti fields [PMT]) at
cheaper rates. Currently, MGL has tied-up with GAIL at an Administered Price of
$3.06/mmBtu. Pricing for supplies from PMT is at $5.73/mmBtu & $5.57/mmBtu,
respectively. The rest of the gas is procured from spot and term LNG contracts with
various suppliers.
APM prices are formula based (reflects international markets’ pricing) and any
changes are reflected with 6 months’ lag effect. The PNG-Industrial & Commercial
demand is met through LNG, where MGL has term-deals with BPCL, BG, and
Hazira LNG, and purchases spot cargoes from GAIL, GSPC and HPCL. MGL does
not get into any long-term pricing model.
June 20, 2016
7
Mahanagar Gas | IPO note
On the whole, any correction in international prices in the next 2-3 quarters could
benefit MGL in terms of low cost of gas.
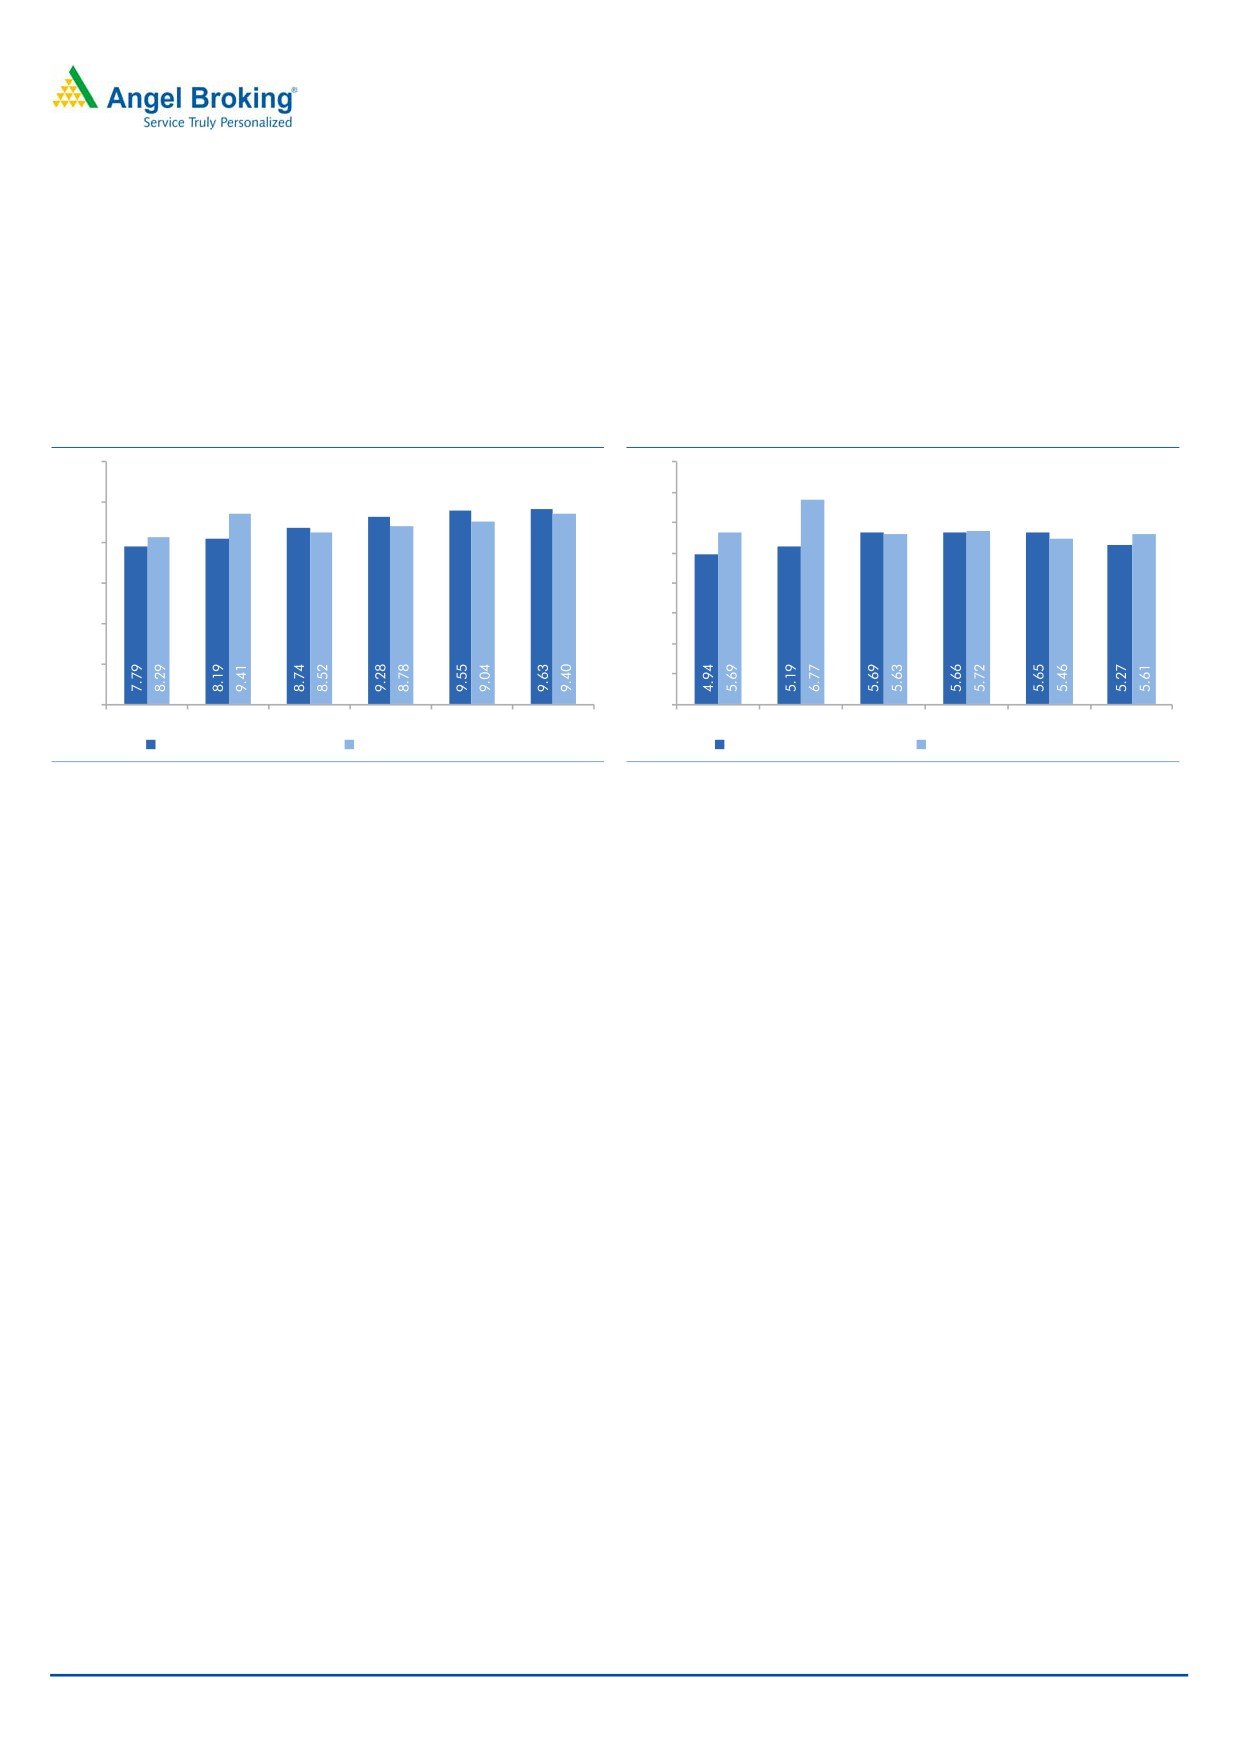
Despite muted growth seen in gross margin/scm, EBITDA/scm lagged, mainly
owing to higher other expenses. Other expenses/scm reported 7.7% CAGR during
FY2011-16, reflecting sharp increase in power & fuel, rent, repairs to plant and
machinery and miscellaneous expenses.
Exhibit 11: IGL vs MGL Gross margin/scm trends
Exhibit 12: IGL vs MGL EBITDA margin/scm trends
12.0
8.0
7.0
10.0
6.0
8.0
5.0
6.0
4.0
3.0
4.0
2.0
2.0
1.0
0.0
0.0
FY2011
FY2012
FY2013
FY2014
FY2015
FY2016
FY2011
FY2012
FY2013
FY2014
FY2015
FY2016
IGL Gross Margin/scm
MGL Gross Margin/scm
IGL EBITDA Margin/scm
MGL EBITDA Margin/scm
Source: Company, Angel Research
Source: Company, Angel Research
Notably, MGL reported -0.3% EBITDA/scm CAGR during FY2011-16, vs +1.3%
CAGR for IGL during the same period. Barring 2 of the last 6 years, MGL reported
higher EBITDA/scm than that of IGL.
Maintained Balance sheet discipline
MGL historically has exhibited that it financed its growth by properly managing its
capital resources. For last 6 years, MGL generated ~`400cr of cash flows from
operations. Given the stable business, we expect this trend of cash flow generation
to continue going forward also. MGL has been spending `200cr towards capex,
which is expected to increase to `250cr. Accordingly, MGL is generating yearly free
cash flows of over `200cr.
Further, MGL in the last 6 years has reported decline in its Return on Equity (RoE)
on account of decline in their EBITDA/scm. Despite compression in EBITDA/scm,
MGL has been able to maintain its RoE in the north of 22% levels.
Another impressive point about MGL has been that it has reported 49% dividend
payout in 5 of the last 6 years. Such huge dividend payout translates to FY2016
dividend yield of 4.2% (at the upper end of the issue price band).
Despite (1) financing its growth from cash flow from operations, and (2) high
dividend pay-outs, MGL continues to be a debt free company (currently sitting on
net cash of `168cr). This efficient capital management has helped the company
follow a disciplined approach in maintaining its balance sheet.
June 20, 2016
8
Mahanagar Gas | IPO note
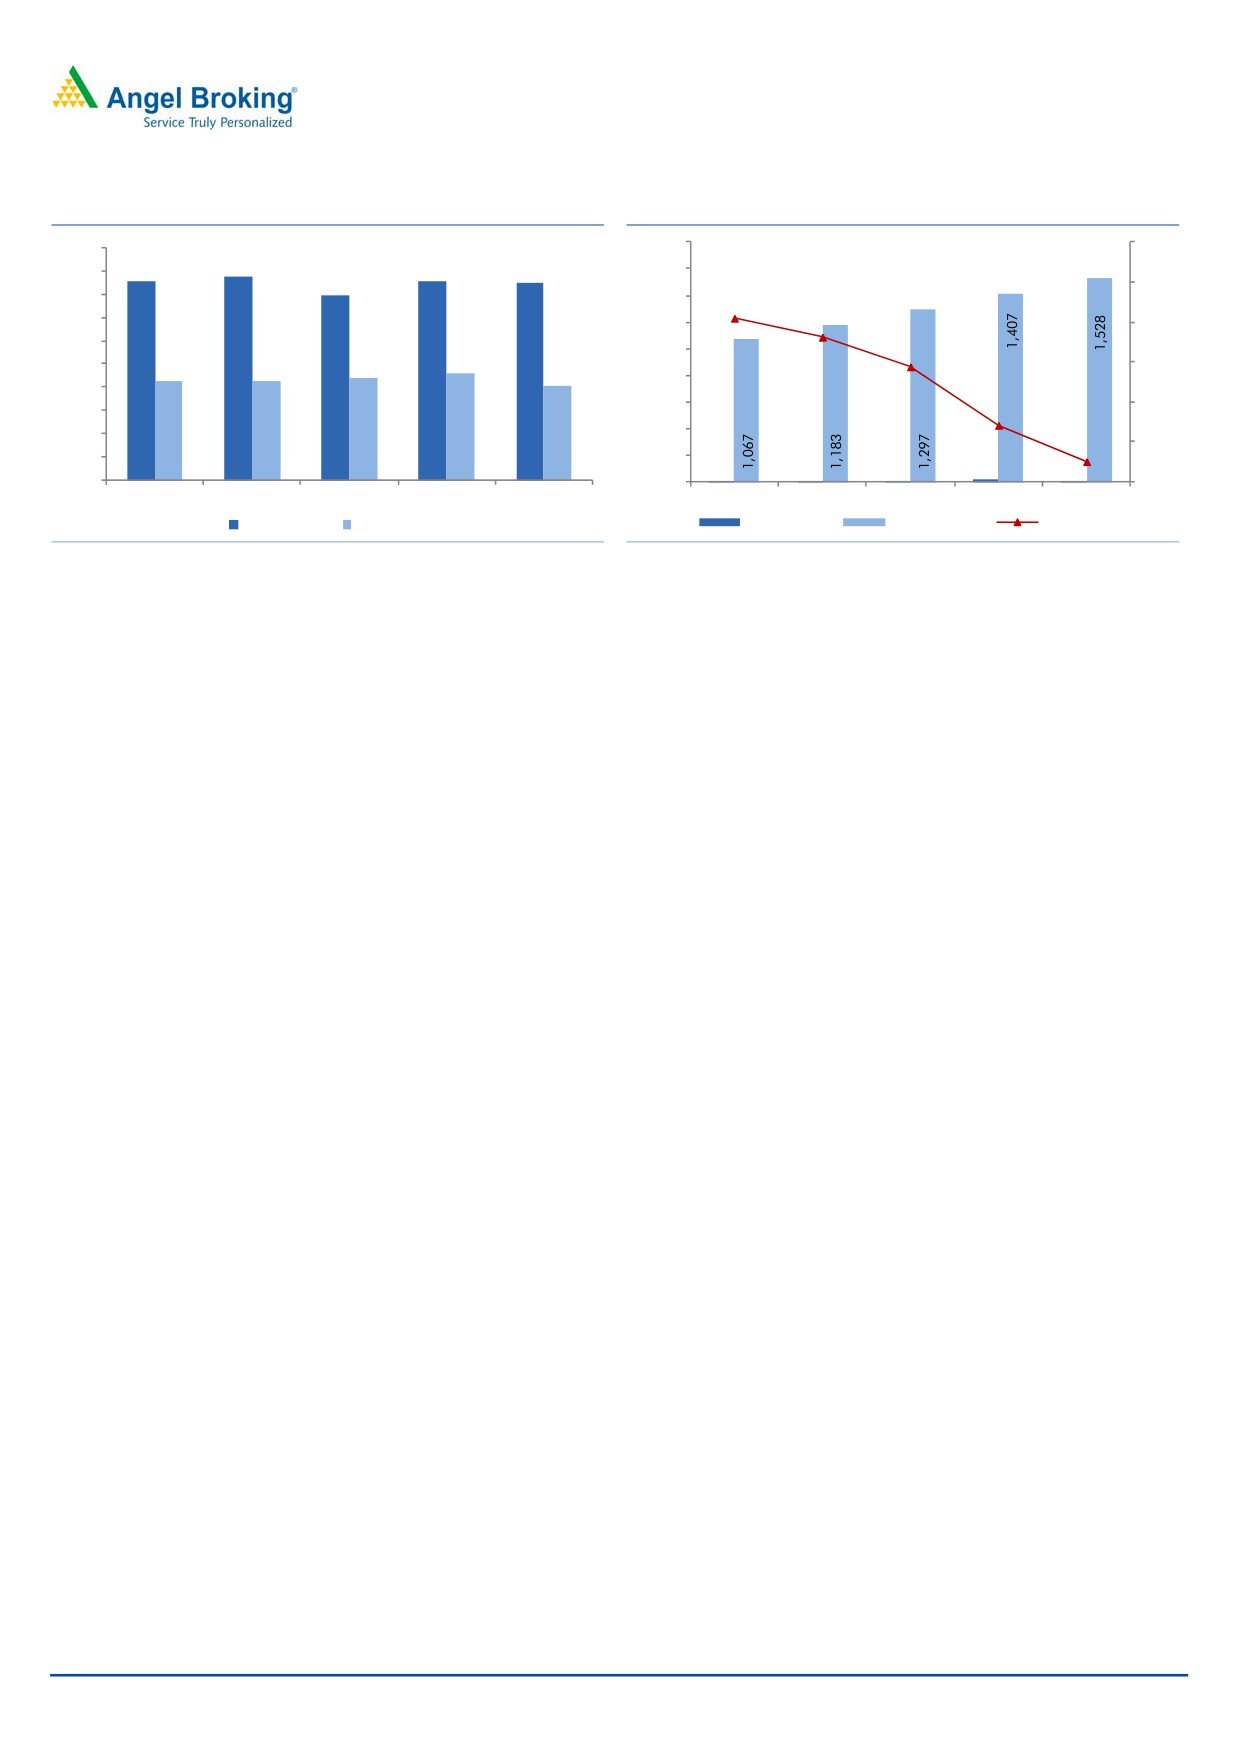
Exhibit 13: OCF and FCF trends
Exhibit 14: Maintained strong Balance Sheet
0.0x
1,800
500
439
428
427
425
450
1,600
398
0.0x
400
1,400
0.0x
350
0.0x
1,200
0.0x
300
1,000
-0.1x
250
214
214
221
229
-0.1x
204
800
200
600
-0.1x
-0.1x
150
100
400
-0.1x
-0.1x
50
200
10
10
8
16
4
0
0
-0.1x
FY2012
FY2013
FY2014
FY2015
FY2016
FY2012
FY2013
FY2014
FY2015
FY2016
OCF (` in cr) FCF (` in cr)
Debt (` in cr)
Equity (` in cr)
Net D/E (x)
Source: Company, Angel Research
Source: Company, Angel Research
Raigad to contribute growth in long-term; Maintain focus on new
areas
MGL won the Raigad district CGD contract from PNGRB 2015 and operations
here are expected to start by FY2017-end. Management highlighted that Raigad
offers huge long-term growth opportunities at the backdrop of Smart City policy,
upcoming International airport and Trans Harbour Link. Accordingly, MGL has
already identified 6-7 industrial clusters which can be accessible to gas grid and
be quickly tapped through concentrated network. Accordingly, to tap the emerging
opportunities, Management indicated that they plan to invest `50cr p.a. for the
next 5 years in the Raigad district.
Also, to reduce its geographical risk, MGL’s Management has indicated that the
company is participating in PNGRB bids and is open to secure new CGS contracts.
Strong parentage support, well-run professional management team, learning from
20 years of experience of operating the Mumbai and adjoining areas, puts MGL in
competitive advantage, allowing it to expand and grow business in the long-run.
Risks & Concerns
1. Any government/regulatory ruling which could affect gas sourcing and pricing
to customers could affect the financials and return ratios.
2. Termination of contract post completion of marketing exclusivity with OMCs
from Mar 31, 2018 could affect the financials of the company.
3. Given that it takes at least 4-5 months to get 25 clearances for pursuing
PNG-domestic expansion, any delays could affect volumes and in-turn affect
the company’s financials.
4. Any adverse movement in the INR-USD could affect the margins, given that
gas pricing is in USD.
June 20, 2016
9
Mahanagar Gas | IPO note
Outlook and Valuation
On comparing IGL’s and GGL’s business models, we sense IGL is the closest peer
to MGL, given that GGL is majorly dependant on industrial and commercial
segments, which leads to volatility in volumes and its lower margins profile. IGL on
the other hand has homogeneity on the business-mix front, margin profile and
return ratios.
IGL on the back of regulatory support has reported 8.0% volume CAGR during
FY2011-16, whereas MGL, without regulatory support and on the back of
favourable cost dynamics, has been able to report 6.7% volume CAGR during
FY2011-16.
MGL reported superior financial metrics for FY2016. It reported EBITDA/scm and
PAT/scm of `5.77/`3.62, respectively. IGL for same period reported EBITDA/scm
and PAT/scm of `5.27/`2.87, respectively.
Exhibit 15:IGL vs MGL Operational & Financial Metrics Comparison
IGL
MGL
FY2015
FY2016
FY2015
FY2016
Operational Metrics:
Sales Volume (mmscmd)
3.84
4.01
2.39
2.43
CNG to total sales (%)
77
77
74
74
Domestic PNG to total sales (%)
5
6
11
12
Commercial & Industrial to total sales (%)
18
17
15
14
CNG Stations (no’s)
326
340
180
188
CNG Vehicle (no’s)
817,117
868,573
421,258
470,478
Domestic Consumers (no’s)
560,752
636,318
801,321
862,299
Industrial/ Commercial consumers (no’s)
2,292
2,580
2,664
2,926
Financials:
Gross Margin (%)
36.4
38.3
37.6
40.5
Gross Margin/scm
9.55
9.63
9.04
9.40
EBITDA Margin (%)
21.5
20.9
23.4
24.7
EBIDTA/scm
5.66
5.27
5.61
5.78
PAT/scm
3.12
2.84
3.68
3.62
ROE (%)
22.7
18.5
23.5
22.0
Source: Company RHP, Annual Reports & Presentations, Media Articles, Angel Research
Further, on the growth side, IGL has reported 9.9% PAT CAGR during FY2011-16,
outpacing MGL’s -0.4% PAT CAGR during the same period. Despite outpacing the
PAT growth, IGL reported FY2015/16 RoEs of 22.7%/18.5%, which is lower than
MGL’s 23.5%/22.0%, respectively.
MGL trades at 12.9/11.6x our FY2016 EPS at the upper and lower end of the issue
price band. MGL reported a 6.7% volume CAGR during FY2011-16 and the same
is likely to grow to 7-8% levels, going forward, considering penetration potential,
possible regulatory support and increased traction from the Raigad markets.
June 20, 2016
10
Mahanagar Gas | IPO note
Exhibit 16: Peer Group Comparison
IGL
MGL
Gujarat Gas (GGL)
P/E
18.6x
12.9x
45.7x
P/BV
3.5x
2.5x
3.4x
EV/EBITDA
10.6x
7.0x
12.1x
Source: Bloomberg, Company, Angel Research, CMP as of Jun 17, 2016
Valuation: On considering (1) almost similar growth potential as that of the
industry peer Indraprastha Gas (IGL), (2) 22%+ RoE levels as reported in the last 6
years, (3) debt free status, (4) yearly cash flow generating potential of `200cr+, (5)
strong dividend payout ratio (Management has guided for 35% dividend pay-out;
translates to ~4% dividend yield), the issue at 12.9x PE FY2016 (vs peers trading
at over 18.0x) is attractively priced. We recommend SUBSCIRBE to Mahanagar
Gas IPO.
June 20, 2016
11
Mahanagar Gas | IPO note
Profit & Loss Statement
Y/E March (` cr)
FY12
FY13
FY14
FY15
FY16
Net Sales
1,309
1,514
1,885
2,095
2,079
% Chg
15.7
24.5
11.1
(0.8)
Total Expenditure
811
1,070
1,397
1,605
1,566
Cost of Natural Gas & Traded items
622
851
1,144
1,296
1,230
Changes in inventory
(0)
(0)
(0)
(0)
0
Employee benefits Expense
32
36
42
51
54
Other Expenses
157
184
211
258
283
EBITDA
498
444
488
490
513
% Chg
(10.7)
9.9
0.3
4.7
EBIDTA %
38.0
29.3
25.9
23.4
24.7
Depreciation
64
71
81
80
84
EBIT
434
373
408
410
429
% Chg
(14.0)
9.2
0.6
4.7
Interest & Financial Charges
0
1
0
1
3
Other Income
32
49
51
58
56
EBT & exceptional items
465
421
458
466
482
Exceptional Items
0
0
0
0
0
EBT
465
421
458
466
482
Tax Expenses
146
144
145
148
160
% of PBT
31.4
34.2
31.5
31.8
33.2
PAT
319
277
314
318
322
% Chg
(13.3)
13.4
1.4
1.3
PAT %
24.4
18.3
16.6
15.2
15.5
Diluted EPS
32.4
28.1
31.8
32.3
32.7
% Chg
(13.3)
13.4
1.4
1.3
June 20, 2016
12
Mahanagar Gas | IPO note
Balance Sheet
Y/E March (` cr)
FY12
FY13
FY14
FY15
FY16
Sources of Funds
Equity Capital
89
89
89
89
89
Reserves & Surplus
978
1,093
1,208
1,318
1,439
Networth
1,067
1,183
1,297
1,407
1,528
Total Debt
10
10
8
16
4
Deferred Tax Liabilities (net)
65
80
89
103
118
Other Long-term Liabilities & Prov.
1
0
5
8
6
Total Liabilities
1,143
1,272
1,398
1,534
1,656
Application of Funds
Net Block
764
926
991
1,064
1,160
Capital WIP & Intan.
322
315
345
380
429
Assets under Develop.
Investments
236
302
342
371
388
Current Assets
Inventories
14
14
16
17
18
Sundry Debtors
82
90
109
96
89
Cash and Bank Balance
51
66
89
145
172
Loans & Advances
58
47
52
60
71
Other Current Asset
19
23
29
32
30
Current Liabilities
403
511
576
632
700
Net Current Assets
(178)
(270)
(281)
(281)
(320)
Other Assets
0
0
0
0
0
Total Assets
1,143
1,272
1,398
1,534
1,656
June 20, 2016
13
Mahanagar Gas | IPO note
Cash Flow Statement
Y/E March (` cr)
FY12
FY13
FY14
FY15
FY16
Profit before tax
454
442
442
449
469
Depreciation & Other Non-cash Charges
54
49
54
49
57
Change in Working Capital
35
93
30
66
47
Interest & Financial Charges
0
1
0
1
3
Direct taxes paid
(115)
(146)
(129)
(139)
(150)
Cash Flow from Operations
428
439
398
427
425
(Inc)/ Dec in Fixed Assets
(213)
(225)
(177)
(197)
(221)
(Inc)/ Dec in Investments & Oth. Adj.
(112)
(60)
(23)
(63)
(8)
Cash Flow from Investing
(326)
(285)
(200)
(261)
(229)
Issue/ (Buy Back) of Equity
0
0
0
0
0
Inc./ (Dec.) in Borrowings
(0)
(1)
(2)
8
(2)
Dividend Paid (Incl. Tax)
(90)
(156)
(183)
(183)
(188)
Interest Expenses & Oth. Adj.
(0)
(1)
(0)
(1)
(1)
Cash Flow from Financing
(91)
(157)
(185)
(176)
(191)
Inc./(Dec.) in Cash & forex translation
11
(3)
13
(10)
5
Opening Cash balances
5
17
13
26
16
Closing Cash balances
17
13
26
16
21
June 20, 2016
14
Mahanagar Gas | IPO note
Ratio Analysis
Y/E March
FY12
FY13
FY14
FY15
FY16
Valuation Ratio (x)
Adj. P/E (on FDEPS)
13.0
15.0
13.2
13.0
12.9
Adj. P/CEPS
9.8
10.8
9.5
9.4
9.3
Dividend yield (%)
2.1
3.6
4.2
4.2
4.2
EV/Sales
2.8
2.4
2.0
1.7
1.7
EV/EBITDA
7.5
8.3
7.5
7.4
7.0
EV / Total Assets
3.3
2.9
2.6
2.4
2.2
Per Share Data (`)
Adj. EPS (fully diluted)
32.4
28.1
31.8
32.3
32.7
Cash EPS
42.9
38.9
44.2
44.6
45.5
DPS
8.7
15.0
17.5
17.5
17.5
Book Value
119
132
145
158
171
Returns (%)
RoCE (Pre-tax)
40.7
31.5
31.4
29.1
28.1
Angel RoIC (Pre-tax)
52.8
38.9
38.7
35.4
34.7
RoE
29.9
23.4
25.3
23.5
22.0
Turnover ratios (x)
Total Asset Turnover (x)
1.1
1.2
1.3
1.4
1.3
Inventory / Sales (days)
4
3
3
3
3
Receivables (days)
23
22
21
17
16
Payables (days)
112
123
111
110
123
WC (days)
(85)
(98)
(87)
(90)
(104)
Leverage Ratios (x)
D/E ratio (x)
0.0
0.0
0.0
0.0
0.0
*Note: Valuation details on higher end of the price band (i.e. at `421/share)
June 20, 2016
15
Mahanagar Gas | IPO note
Research Team Tel: 022 - 39357800
DISCLAIMER
Angel Broking Private Limited (hereinafter referred to as “Angel”) is a registered Member of National Stock Exchange of India Limited,
Bombay Stock Exchange Limited and MCX Stock Exchange Limited. It is also registered as a Depository Participant with CDSL and
Portfolio Manager with SEBI. It also has registration with AMFI as a Mutual Fund Distributor. Angel Broking Private Limited is a
registered entity with SEBI for Research Analyst in terms of SEBI (Research Analyst) Regulations, 2014 vide registration number
INH000000164. Angel or its associates has not been debarred/ suspended by SEBI or any other regulatory authority for accessing
/dealing in securities Market. Angel or its associates including its relatives/analyst do not hold any financial interest/beneficial
ownership of more than 1% in the company covered by Analyst. Angel or its associates/analyst has not received any compensation /
managed or co-managed public offering of securities of the company covered by Analyst during the past twelve months. Angel/analyst
has not served as an officer, director or employee of company covered by Analyst and has not been engaged in market making activity
of the company covered by Analyst.
This document is solely for the personal information of the recipient, and must not be singularly used as the basis of any investment
decision. Nothing in this document should be construed as investment or financial advice. Each recipient of this document should
make such investigations as they deem necessary to arrive at an independent evaluation of an investment in the securities of the
companies referred to in this document (including the merits and risks involved), and should consult their own advisors to determine
the merits and risks of such an investment.
Reports based on technical and derivative analysis center on studying charts of a stock's price movement, outstanding positions and
trading volume, as opposed to focusing on a company's fundamentals and, as such, may not match with a report on a company's
fundamentals.
The information in this document has been printed on the basis of publicly available information, internal data and other reliable
sources believed to be true, but we do not represent that it is accurate or complete and it should not be relied on as such, as this
document is for general guidance only. Angel Broking Pvt. Limited or any of its affiliates/ group companies shall not be in any way
responsible for any loss or damage that may arise to any person from any inadvertent error in the information contained in this report.
Angel Broking Pvt. Limited has not independently verified all the information contained within this document. Accordingly, we cannot
testify, nor make any representation or warranty, express or implied, to the accuracy, contents or data contained within this document.
While Angel Broking Pvt. Limited endeavors to update on a reasonable basis the information discussed in this material, there may be
regulatory, compliance, or other reasons that prevent us from doing so.
This document is being supplied to you solely for your information, and its contents, information or data may not be reproduced,
redistributed or passed on, directly or indirectly.
Neither Angel Broking Pvt. Limited, nor its directors, employees or affiliates shall be liable for any loss or damage that may arise from
or in connection with the use of this information.
Note: Please refer to the important ‘Stock Holding Disclosure' report on the Angel website (Research Section). Also, please refer to the
latest update on respective stocks for the disclosure status in respect of those stocks. Angel Broking Pvt. Limited and its affiliates may
have investment positions in the stocks recommended in this report.
June 20, 2016
16