4QFY2016 Result Update | Others
May 13, 2016
MM Forgings
BUY
CMP
`460
Performance highlights
Target Price
`536
Y/E March (` cr)
4QFY16 4QFY15
% chg. (yoy) 3QFY16
% chg. (qoq)
Investment Period
12 months
Net sales
124
127
(1.7)
126
(1.1)
EBITDA
26
27
(4.5)
28
(7.6)
Stock Info
EBITDA Margin (%)
20.5
21.1
(60)
22.0
(145)
Adjusted PAT
11
11
(1.3)
13
(16.3)
Sector
Others
Source: Company, Angel Research
Market Cap (` cr)
550
MM Forgings (MMFL)’ numbers for 4QFY2016 have come in marginally below our
Net debt (` cr)
92
estimates. Its top-line for the quarter de-grew by 1.7% yoy to `124cr, which is below
Beta
0.7
our estimate of `129cr. The EBITDA declined by 4.5% yoy to `26cr while the EBITDA
margin declined marginally by 60bp yoy to 20.5% (against our estimate of 21.0%).
52 Week High / Low
717/ 336
Further, the interest and depreciation expenses for the quarter stood more or less
Avg. Daily Volume
2,256
flat in absolute terms on a yoy basis and other income increased by 90.4% yoy to `1.9cr.
Face Value (`)
10
Consequently, the net profit declined by 1.3% yoy to `11cr vis-à-vis our expectation of `12cr.
BSE Sensex
25,790
On-going capacity expansion to help cater to domestic as well as international
Nifty
7,900
markets: The company derives ~70% of its revenues from North America and Europe
Reuters Code
MMFO.BO
while the balance is contributed by the domestic markets. Automotives make up for
~78% of its revenue with higher concentration of commercial vehicles (CV) in the mix.
Bloomberg Code
MMFG IN
The company has been continuously increasing its capacity over the last two years and
is expected to touch the 65,000MT mark by the end of FY2017 from the current level of
53,000MT. Although the US CV industry is expected to post flat growth in sales for
Shareholding Pattern (%)
CY2016 after having reported a sharp increase in CY2015, the demand from the
Promoters
56.4
domestic CV industry is expected to continue to be strong. This, along with a stable
MF / Banks / Indian Fls
13.7
growth rate of ~7% estimated for the European CV industry in CY2016, should enable
FII / NRIs / OCBs
3.4
the company to utilize its expanding capacity. At the moment, the company’s top-five
Indian Public / Others
26.5
clients account for ~70% of its revenue. We expect the company to be aggressive in
terms of client acquisitions which should also compliment its growing capacity.
Outlook and valuation: Considering flattish CV growth in the US (although stable
Abs.(%)
3m
1yr
3yr
growth in domestic and European CV sales), we have lowered our revenue expectation
Sensex
12.2
(5.2)
30.8
for FY2017 and expect improvement only in FY2018. We expect MMFL to register a
MMFL
17.3
(33.5)
502.4
revenue CAGR of 10% over FY2016-18E to `608cr. The company’s EBITDA margin is
expected to witness contraction in FY2017 on account of pricing pressure and higher
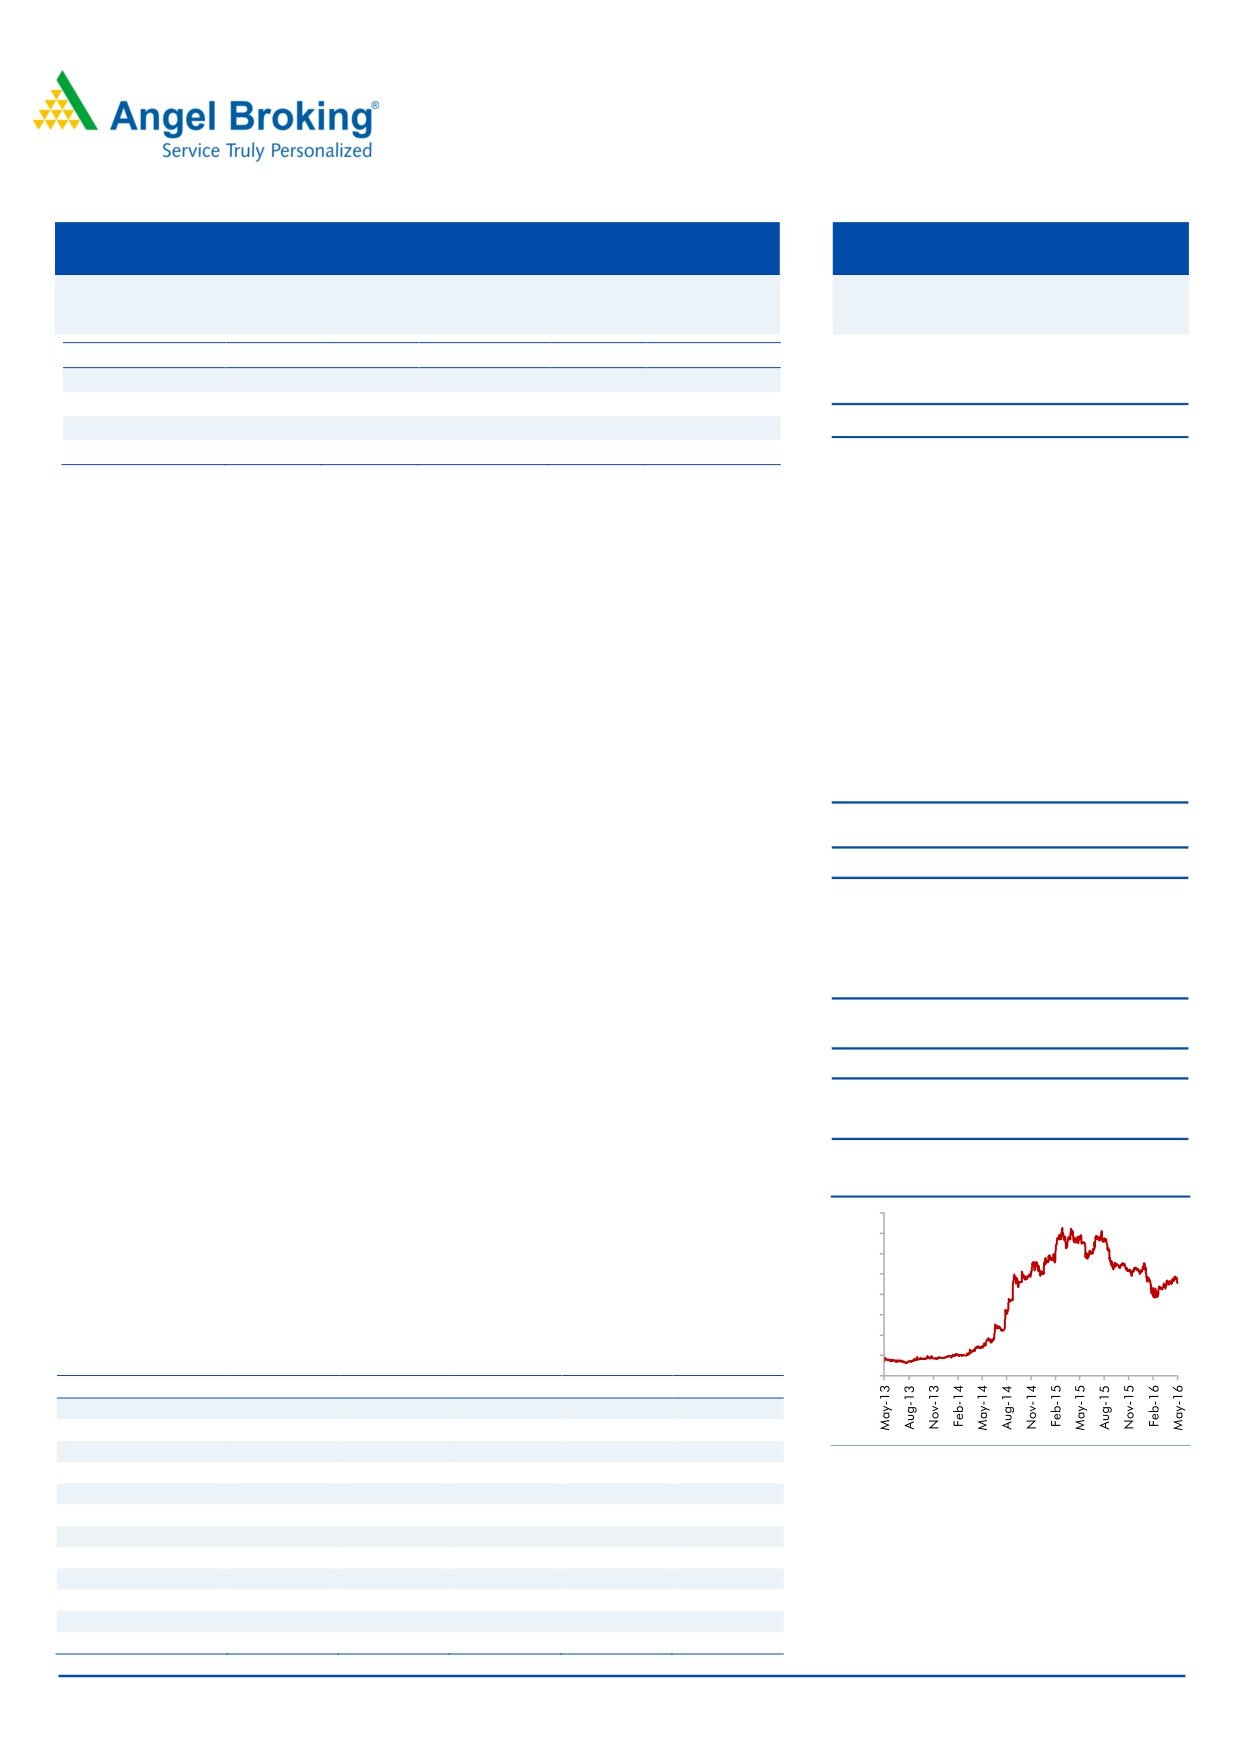
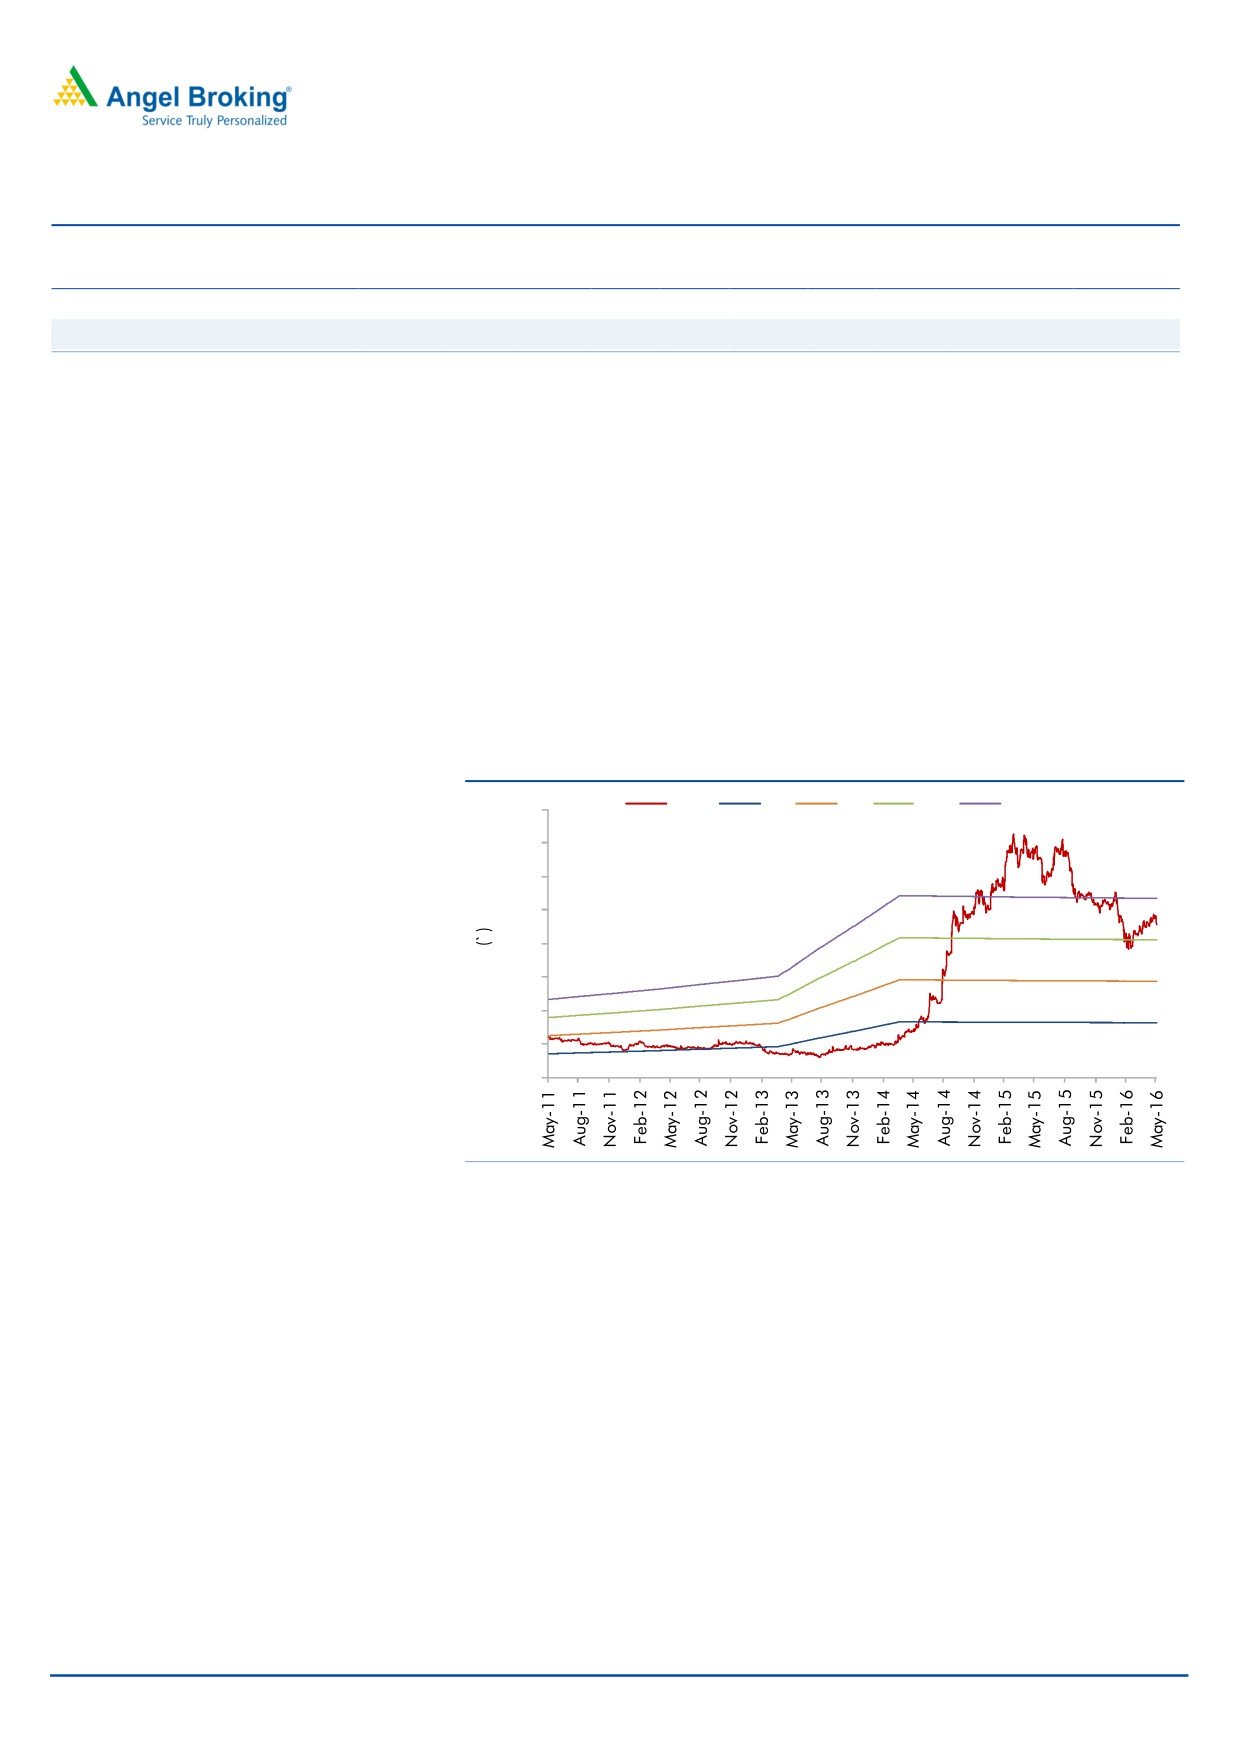
3 year price chart
contribution from the relatively lower-margin domestic market, but improve thereon to
800
700
20.7% in FY2018. The net profit as a result is expected to remain flat in FY2017 and
600
improve to `59cr in FY2018. At the current market price, the company is trading at a
500
P/E of 9.4x its FY2018E earnings. We have a Buy rating on the stock with a target price
400
300
of `536 based on a target P/E of 11.0x its FY2018E earnings.
200
100
Key financials
-
Y/E March (` cr)
FY2014
FY2015
FY2016
FY2017E
FY2018E
Net Sales
411
503
502
546
608
% chg
13.9
22.1
(0.1)
8.8
11.3
Adj. Net Profit
28
51
50
50
59
Source: Company, Angel Research
% chg
14.8
80.0
(0.9)
(0.6)
18.1
OPM (%)
19.2
22.0
21.5
20.4
20.7
EPS (`)
23.3
41.9
41.5
41.3
48.7
P/E (x)
19.6
10.9
11.0
11.1
9.4
P/BV (x)
2.8
2.3
2.0
1.7
1.5
RoE (%)
15.3
23.3
19.4
16.6
17.0
RoCE (%)
12.9
19.4
15.7
14.0
15.7
Milan Desai
EV/Sales (x)
1.6
1.3
1.3
1.1
0.9
022-40003600 Ext: 6846
EV/EBITDA (x)
8.6
5.9
5.9
5.6
4.5
Source: Company, Angel Research; CMP as on May 12, 2016
Please refer to important disclosures at the end of this report
1
M M Forgings | 4QFY2016 Result Update
Exhibit 1: 2QFY2016 performance
Y/E March (` cr)
4QFY16
4QFY15
% chg. (yoy)
3QFY16
% chg. (qoq)
FY2016
FY2015
% chg
Net Sales
124
127
(1.7)
126
(1.1)
502
503
(0.1)
Net raw material
55
47
16.0
57
(3.0)
209
207
1.1
(% of Sales)
44.2
37.4
674bp
45.0
(86)bp
41.7
41.2
Employee Cost
13
14
(6.3)
13
0.6
55
48
14.2
(% of Sales)
10.8
11.3
(54)bp
10.6
18bp
11.0
9.6
Power, Oil & Fuel
11
13
(18.8)
10
6.4
47
49
(3.4)
(% of Sales)
8.5
10.3
(180)bp
7.9
60bp
9.4
9.8
Other Expenses
20
25
(20.5)
18
9.2
83
87
(5.6)
(% of Sales)
16.0
19.8
(380)bp
14.5
152bp
16.4
17.4
Total Expenditure
99
100
(0.9)
98
0.7
394
392
0.6
Operating Profit
26
27
(4.5)
28
(7.6)
108
111
(2)
OPM (%)
20.5
21.1
(60)bp
22.0
(145)bp
21.5
22.0
(54)bp
Interest
2
2
(5.6)
2
24.0
8
9
(9.0)
Depreciation
8.8
8.4
5.2
9
(2.1)
36
35
1.2
Other Income
1.9
1.0
90.4
1
68.3
5
2
125.1
PBT
17
17
(3.6)
18
(8.5)
69
69
0.9
(% of Sales)
13.3
13.6
14.4
13.8
13.7
Tax
6
6
(7.7)
5
11.8
19
18
6.0
(% of PBT)
34.0
35.5
27.8
27.7
26.4
Reported PAT
11
11
(1.3)
13
(16.3)
50
51
(0.9)
Extraordinary Expense/(Inc.)
0.0
0
-
0
0
Adjusted PAT
11
11
(1.3)
13
(16.3)
50
51
(0.9)
PATM
8.8
8.8
10.4
10.0
10.1
Source: Company, Angel Research
Exhibit 2: Actual vs. Angel estimates (4QFY2016)
Actual (` cr)
Estimate (` cr)
Var (%)
Total Income
124
129
(3.3)
EBIDTA
26
27
(5.5)
EBIDTA margin (%)
20.5
21.0
(49)
Adjusted PAT
11
12
(10.7)
Source: Company, Angel Research
Numbers marginally below our expectation
The company’s numbers for 4QFY2016 have come in marginally below our
estimates. The top-line for the quarter de-grew by 1.7% yoy to `124cr. The same is
below our estimate of `129cr as we reckon towards the company having witnessed
a marginal decline in volume, ie in the range of ~2% in FY2016. The raw material
cost increased by 674bp yoy to 44.2% of sales which could be attributed to the
current rebound in metal prices. However, employee, power, and other expenses
declined by 54bp yoy, 180bp yoy and 380bp yoy to 10.8%, 8.5% and 16.0% of
sales, respectively. EBITDA declined by 4.5% yoy to `26cr while EBITDA margin
declined marginally by 60bp yoy to 20.5% (against our estimate of 21.0%).
Further, interest and depreciation expenses for the quarter stood more or less flat in
absolute terms on a yoy basis and other income increased by 90.4% yoy to `1.9cr.
May 13, 2016
2
M M Forgings | 4QFY2016 Result Update
Consequently, the net profit declined by
1.3% yoy to
`11cr vis-à-vis our
expectation of `12cr.
Investment arguments
Ongoing capacity expansion to help cater to improvement in
global demand over the long run
The company has been continuously increasing its capacity over the last two years
and its current capacity stands at 53,000MT, up from 46,000MT in FY2015 and
40,000MT in FY2014. The company intends to scale up its capacity to ~65,000MT
by the end of FY2017. The company caters mainly to global markets with focus on
the CV industry. It derives ~30% of its revenues from the US, ~30% from Europe,
~30% from the domestic market, and the balance from other North American
markets. In line with the Management’s earlier guidance, the US as well as Europe
have witnessed good growth rates for CV sales in CY2015. US CV sales as per
OICA grew by 12.8% yoy and European CV sales grew by 7.7% yoy in CY2015.
We expect growth in the US CV industry to be flat in CY2016 while we expect the
European CV industry to maintain its growth rate of ~7% for the year on the back
of higher growth in countries like Spain and other Eastern European markets. We
expect the company to face some margin pressure on account of pricing
constraints and have accordingly revised our estimates downwards. Also we
believe that it’s unlikely that the company would be fully able to utilize its extended
capacity in the near term.
However, we expect global growth to inch upwards from hereon, thereby enabling
the company to utilize its extended capacity more efficiently from a medium to
longer term perspective.
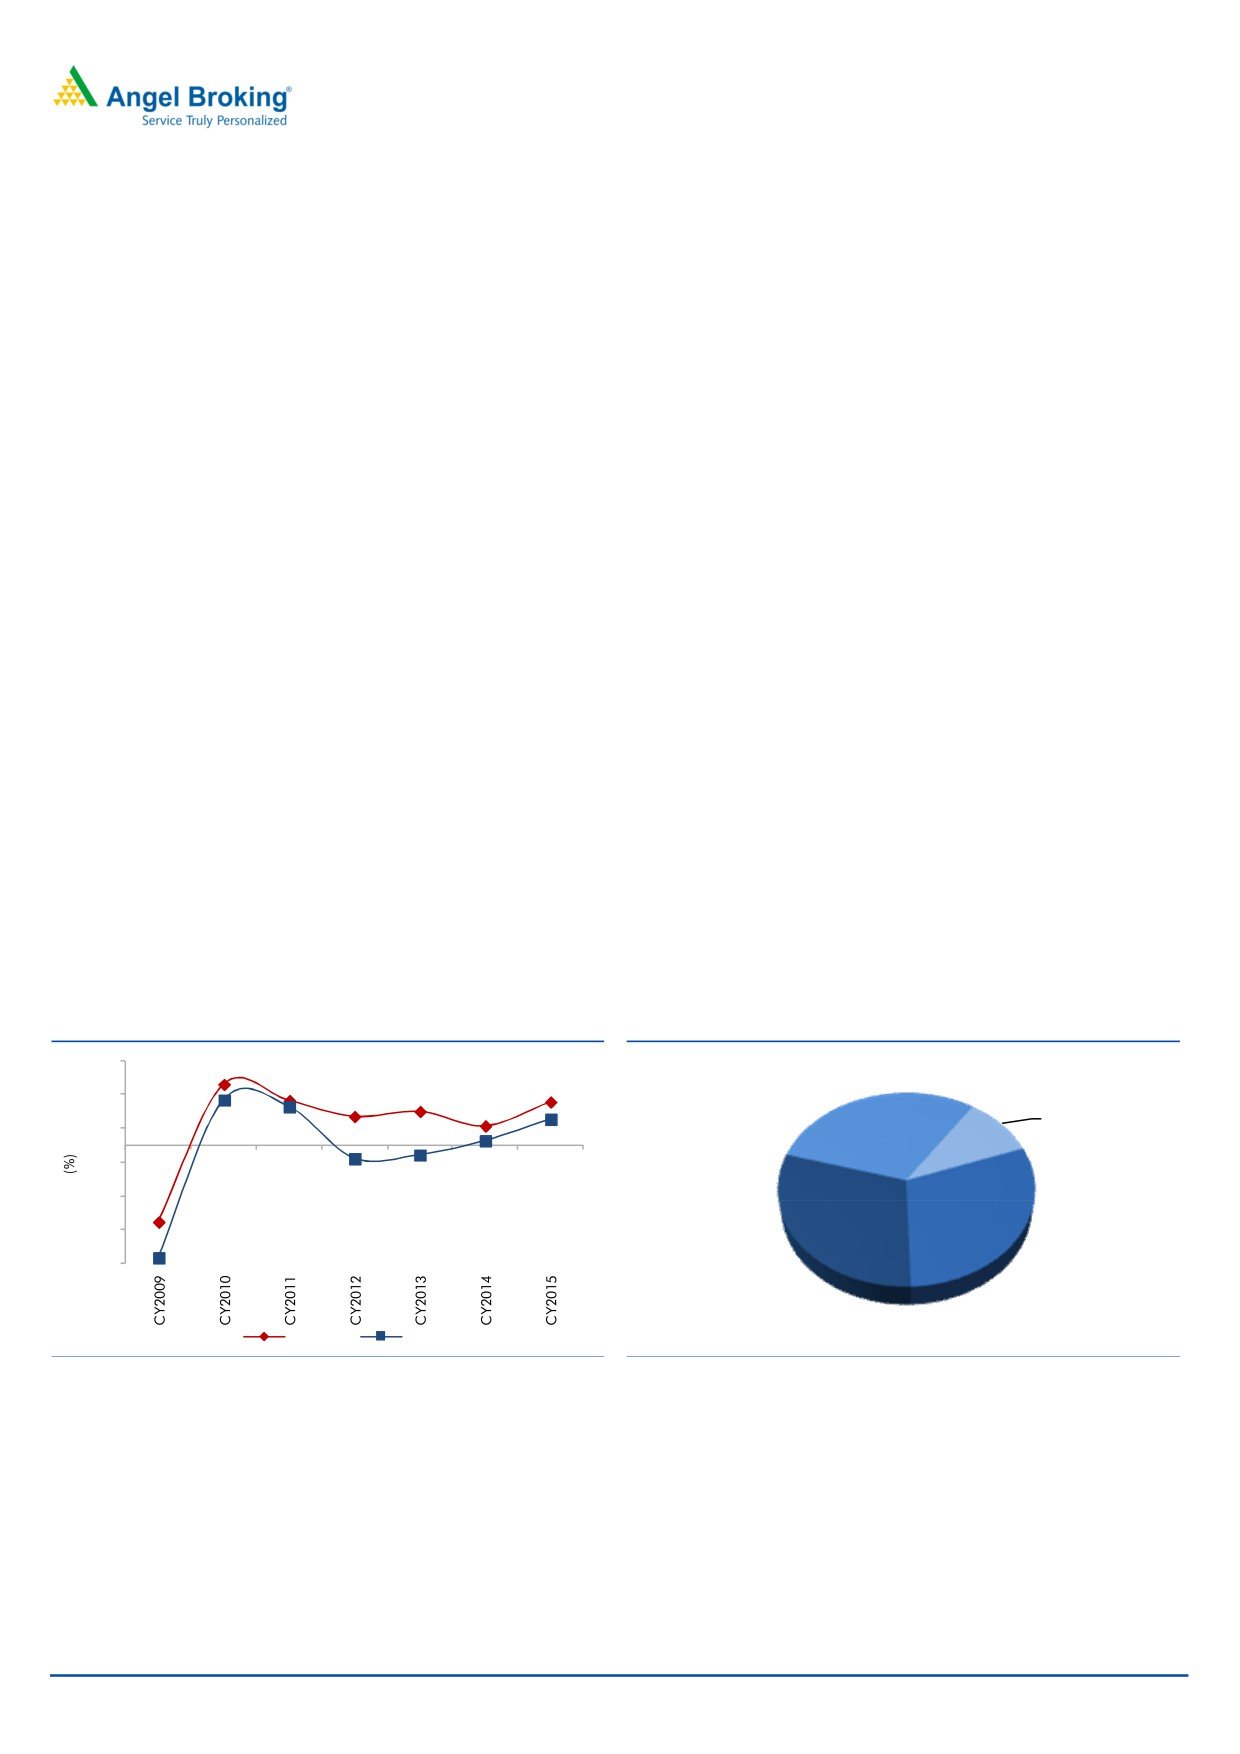
Exhibit 3: US & Europe CV Sales Growth
Exhibit 4: Geographical Revenue Mix
25.0
18.0
13.3
12.8
Europe, 30%
15.0
8.5
10.0
N. America
5.7
(non US), 10%
5.0
13.4
11.4
7.7
(5.0)
1.3
(3.9)
(2.9)
(15.0)
(22.7)
(25.0)
(33.2)
(35.0)
India, 30%
USA, 30%
AMERICA
EUROPE
Source: OICA, Angel Research
Source: Company, Angel Research
Favorable outlook for domestic CV industry
The Indian CV industry reported 11.5% growth in FY2016 after de-growth of 2.8%
in FY2015. The growth was mainly led by 29.9% yoy growth in MHCV sales during
the year while LCV sales remained flat. MHCV sales have been stellar over the past
two years while the sharp de-growth in LCVs witnessed in FY2014 and FY2015 got
arrested with the segment managing to post flat volumes in FY2016. Going
forward, MHCVs are expected to post good volume growth; SIAM estimates
May 13, 2016
3
M M Forgings | 4QFY2016 Result Update
suggest a 12-15% growth for FY2017 for the segment. Additionally, the growth is
expected to be steady on account of pre-buying ahead of the implementation of
Bharat Stage (BS) IV emission norms from April 2017. As for LCVs, volumes are
expected to grow in excess of 8% on account of better availability of load from the
consumer goods segment.
This positive outlook for the overall domestic CV industry along with stable growth
rates for passenger vehicles will enable the company to register good volumes
even in the eventuality of export volumes possibly facing contraction.
Exhibit 5: Domestic CV and Passenger Sales
50.0
Passanger Car
MHCV
LCV
40.0
29.9
30.0
20.0
8.0
10.0
-
(10.0)
0.3
(20.0)
(30.0)
(40.0)
Source: SIAM, Angel Research
Financials
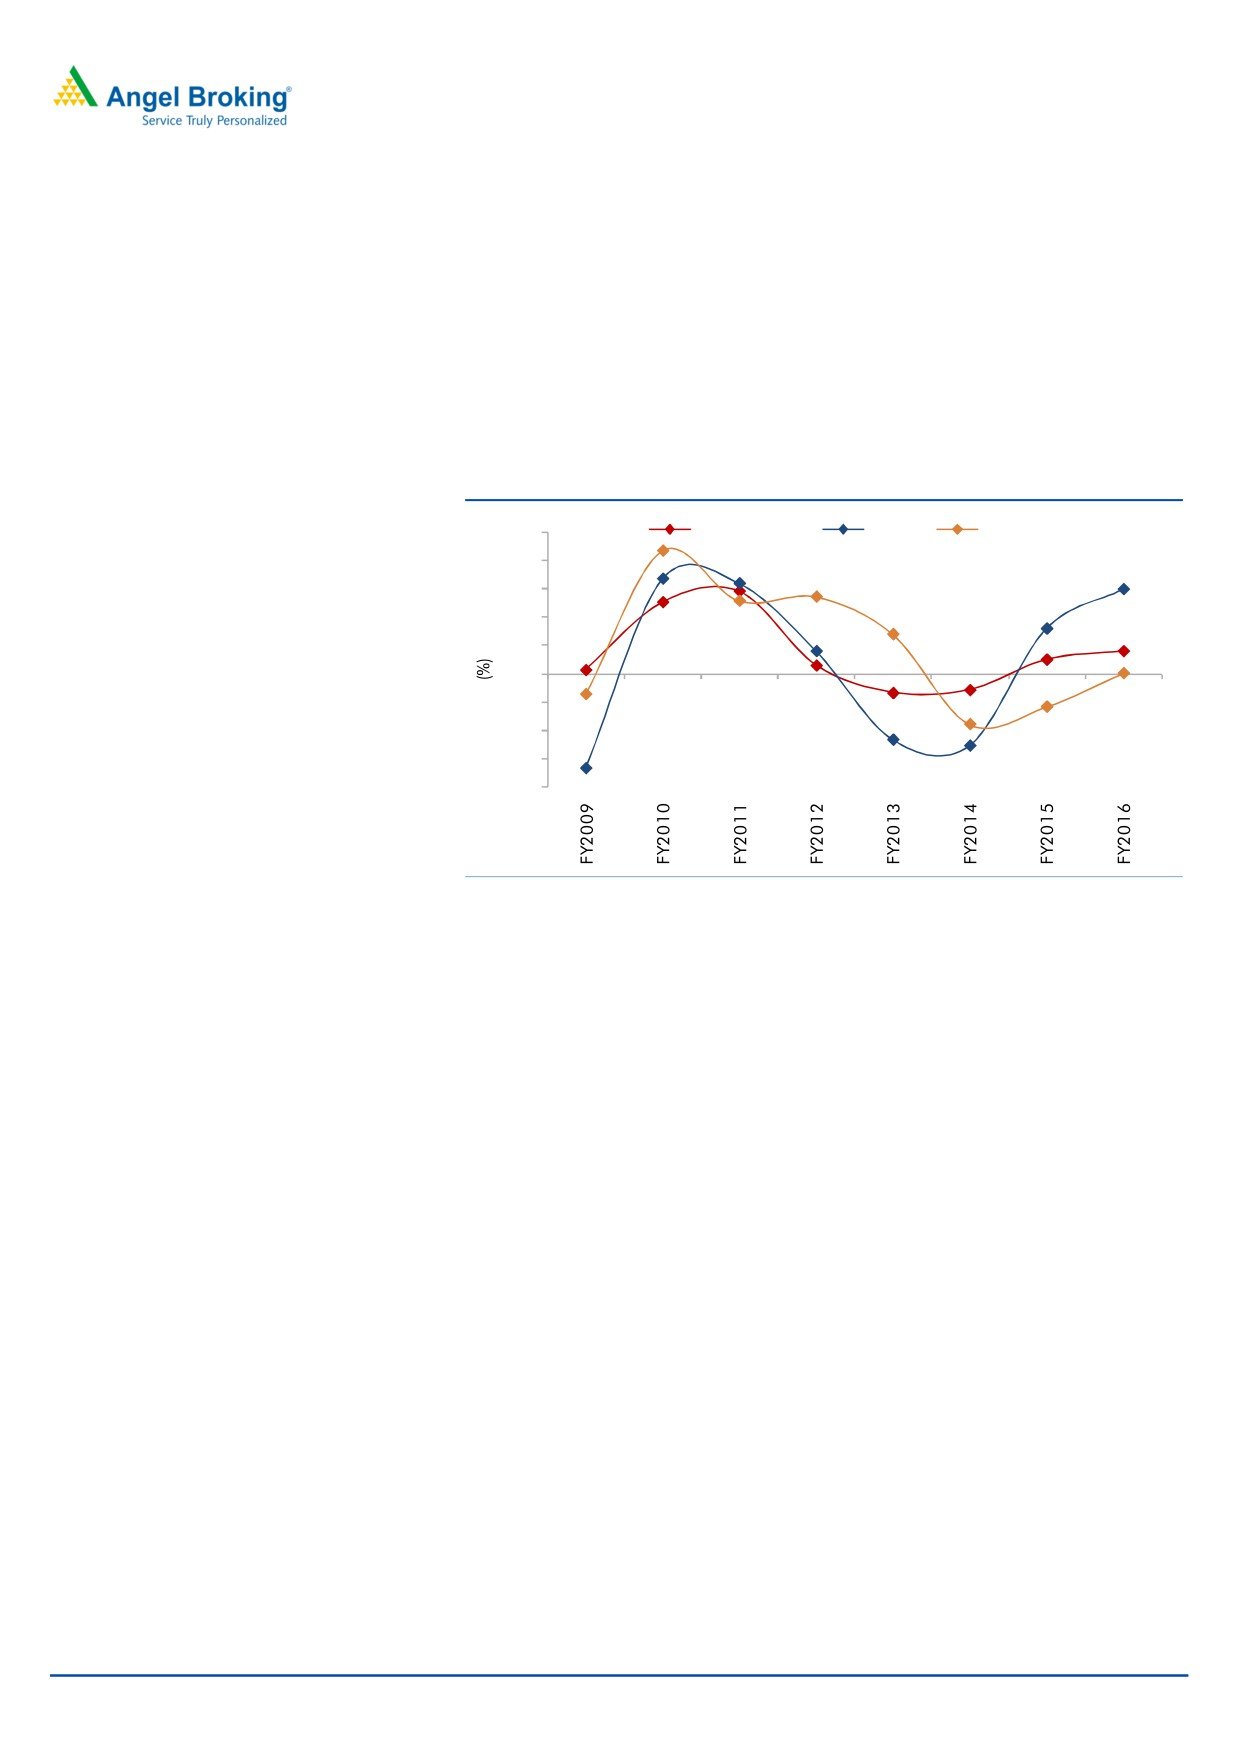
Revenue to grow at 10.0% over FY2016-18E
After posting robust revenue CAGR of 25% over FY2010-15, the company
witnessed a marginal decline of 0.1% yoy in FY2016 revenues which we believe is
on account of slight drop in volumes. Going forward, we expect some deceleration
in growth in the global CV industry; however, we expect the same to be offset by
strong growth in the domestic CV industry, which should thus enable an
improvement in the company’s volumes in FY2017. Additionally, a rebound in
commodity prices should also result in higher realizations. We expect the top-line
to post a CAGR of 10% over FY2016-18E.
May 13, 2016
4
M M Forgings | 4QFY2016 Result Update
Exhibit 6: Revenue CAGR of 10% over FY2016-18E
Exhibit 7: EBITDA margin to witness contraction
30.0
150
22.0
23.0
600
21.5
22.0
125
20.4
500
22.1
21.0
20.0
20.7
100
19.2
20.0
13.9
400
11.
3
8.8
75
19.0
10.0
300
18.0
50
200
17.0
-
25
100
(0.1)
16.0
16.0
-
15.0
-
(10.0)
FY2013
FY2014
FY2015
FY2016
FY2017E FY2018E
FY2014
FY2015
FY2016
FY2017E
FY2018E
Revenue (LHS)
Revenue growth (RHS)
EBITDA (LHS)
EBITDA Margin (RHS)
Source: Company, Angel Research
Source: Company, Angel Research
With the demand from US expected to remain flat, we expect pricing pressure to
impact margins to a certain extent. Margins will also be impacted on account of
higher contribution from the relatively lower margin yielding domestic market
given that the demand outlook for the Indian CV industry looks favorable. We
expect EBITDA margin to witness 112bp yoy contraction in FY2017 to 20.4% and
improve to 20.7% in FY2018.
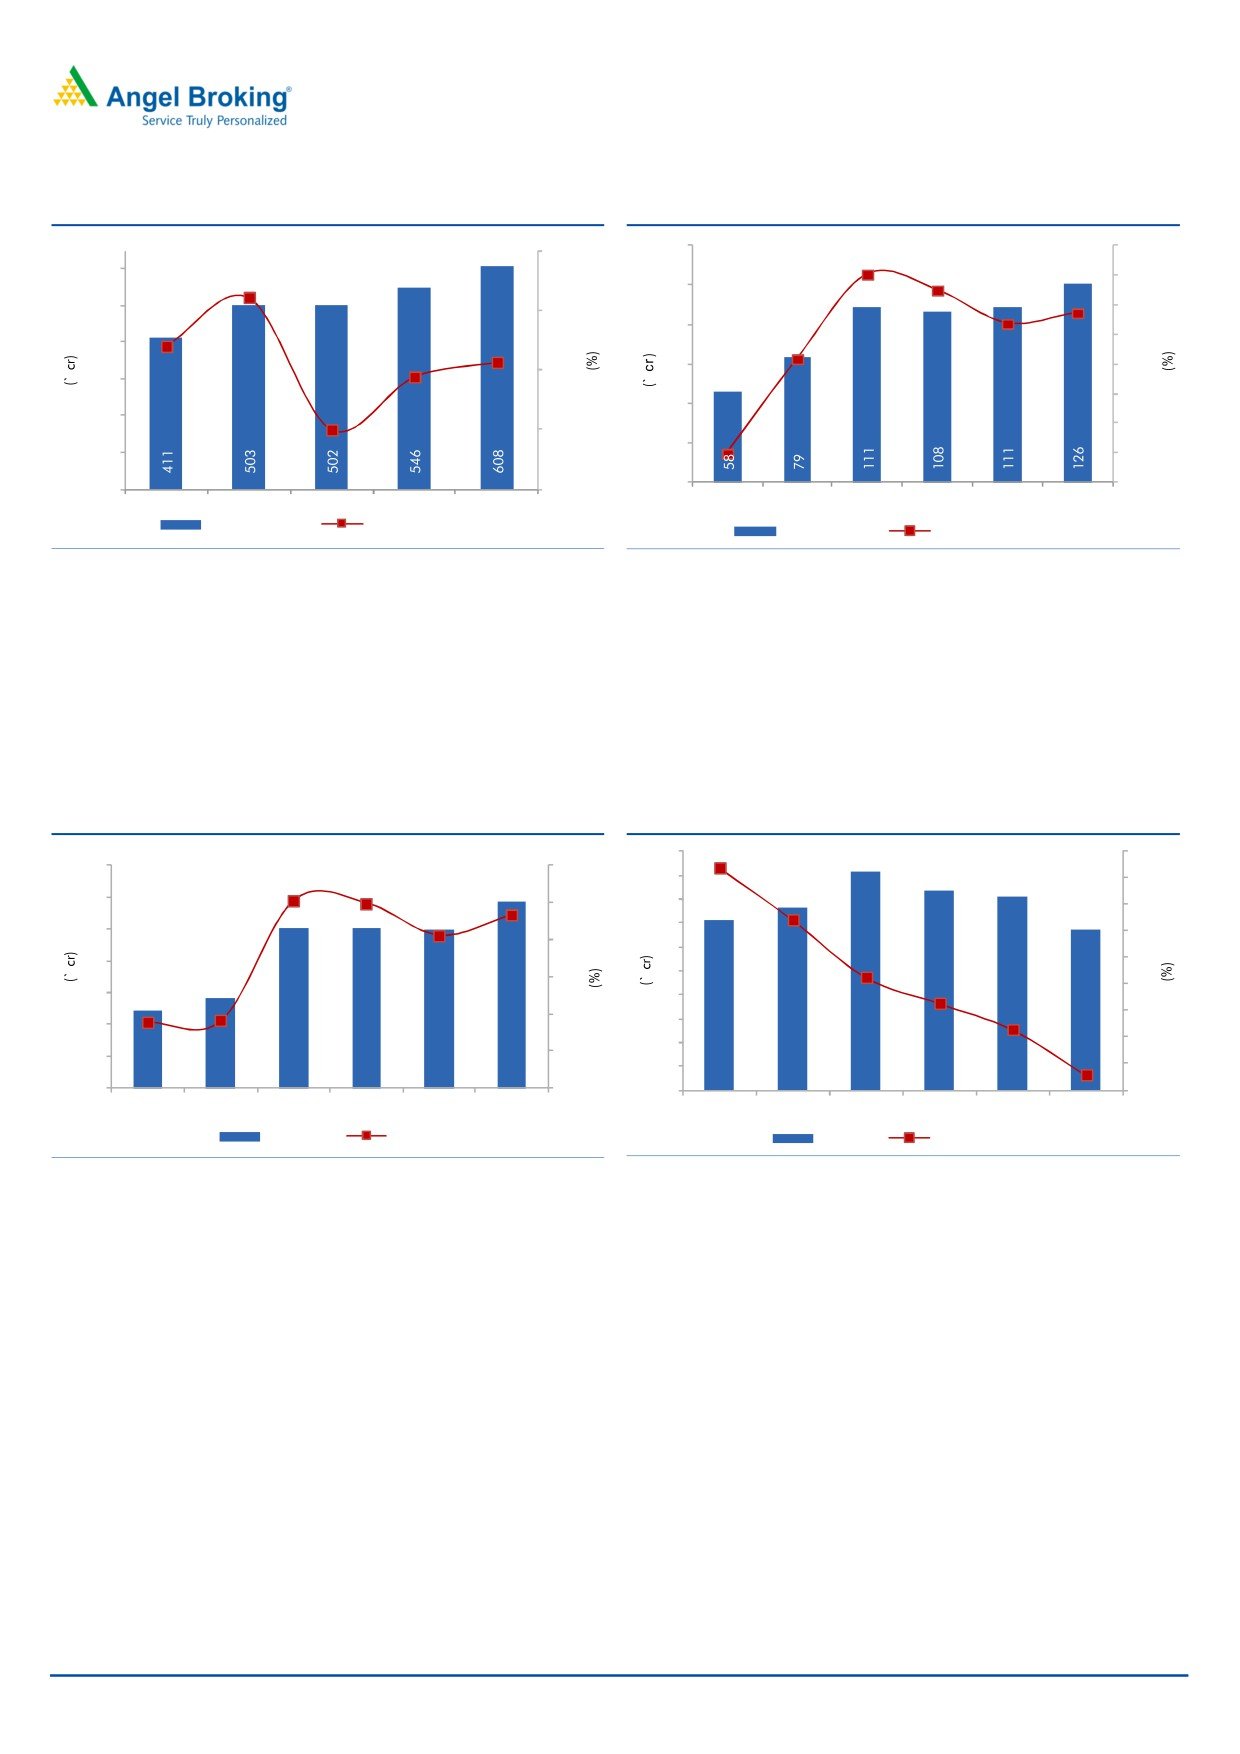
Exhibit 8: PATM to improve
Exhibit 9: Net debt to equity to decrease
10
0.8
0.9
70
10.0
11.0
10.1
9
0.8
9.7
60
10.0
8
0.6
0.7
9.1
7
50
0.6
9.0
6
40
0.5
6.8
5
8.0
0.4
0.4
30
6.8
4
0.3
7.0
0.3
3
20
0.2
2
0.2
6.0
10
1
0.1
24
28
51
50
50
59
7
8
9
8
8
7
0.1
-
5.0
-
-
FY2013
FY2014
FY2015
FY2016
FY2017E FY2018E
FY2013
FY2014
FY2015
FY2016
FY2017E FY2018E
PAT (LHS)
PATM (RHS)
Interest
Net debt to equity
Source: Company, Angel Research
Source: Company, Angel Research
On account of lower margins and higher depreciation, the bottom-line is expected
to remain flat in FY2017 and improve in FY2018 to `59cr. The company
generates healthy cash flows that should enable it to cover its capex and gradually
reduce its debt over FY2016-18. We expect the net debt to equity to come down
from 0.3x level in FY2016 to 0.1x in FY2018.
May 13, 2016
5
M M Forgings | 4QFY2016 Result Update
Exhibit 10: Relative valuation (Trailing twelve months)
Mcap Sales OPM
PAT
EPS
RoIC
P/E
P/BV
EV/EBITDA
EV/
Company
(` cr)
(` cr)
(%)
(` cr)
(`)
(%)
(x)
(x)
(x)
Sales (x)
M M Forgings
550
502
21.5
50
41.0
20.7
11.1
2.0
5.7
1.2
Ramkrishna Forgings
1,058
913
19.9
78
28.5
10.7
13.5
2.3
10.2
2.0
Source: Company, Angel Research;
Outlook and valuation: Considering flattish CV growth in the US (although stable
growth in domestic and European CV sales), we have lowered our revenue
expectation for FY2017 and expect improvement only in FY2018. We expect MMFL
to register a revenue CAGR of 10% over FY2016-18E to `608cr. The company’s
EBITDA margin is expected to witness contraction in FY2017 on account of pricing
pressure and higher contribution from the relatively lower-margin domestic
market, but improve thereon to 20.7% in FY2018. The net profit as a result is
expected to remain flat in FY2017 and improve to `59cr in FY2018. At the current
market price, the company is trading at a P/E of 9.4x its FY2018E earnings. We
have a Buy rating on the stock with a target price of `536 based on a target P/E of
11.0x its FY2018E earnings.
Exhibit 11: One-year forward P/E band
Price
4x
7x
10x
13x
800
700
600
500
400
300
200
100
-
Source: Company, Angel Research
Concerns
De-growth in US and European CV industry: Any sharp decline in US CV industry
volumes in CY2016 contrary to our estimation of flat volume performance can
have a negative impact on the company’s performance.
Adverse movement in currency: Rupee depreciation is an added advantage for the
company. In case of any appreciation, the revenue of the company will be
adversely affected.
Fluctuations in steel price: Any substantial fluctuation in the price of steel can lead
to margin compression for the company.
May 13, 2016
6
M M Forgings | 4QFY2016 Result Update
Company background
MM Forgings (MMFL) was incorporated in 1946 as Madras Motors Ltd. and was
renamed MM Forgings Ltd. in the year 1993.. It manufactures steel forgings in
raw, semi-machined and fully machined stages in various grades of carbon, alloy,
micro-alloy and stainless steels in the weight range of 0.20Kg to 60Kg. The
company caters to the forging requirements of almost all sections of the industry -
automotive, valve and oil-filed, engineering and off highway.
The company’s manufacturing plants are located at Singampunari-Pasumpon
Muthuramalingam District, Viralimalai-Pudukkottai District and Karainaithangal
Village- Kanchipuram District, all in Tamil Nadu. The company has its Wind Farm
at Panakudi Village- Tirunelveli District and at Meenakshipuram, Theni District and
the power generated is utilised for captive use.
May 13, 2016
7
M M Forgings | 4QFY2016 Result Update
Profit and loss statement
Y/E Mar. (` cr)
FY2014
FY2015
FY2016
FY2017E
FY2018E
Net Sales
411
503
502
546
608
Other operating income
-
-
-
-
-
Total operating income
411
503
502
546
608
% chg
13.9
22.1
(0.1)
8.8
11.3
Net Raw Materials
176
207
209
234
260
% chg
14.4
17.3
1.1
11.9
11.2
Power and Fuel
44
49
47
51
57
% chg
(5.0)
12.1
(3.4)
7.7
11.3
Personnel
39
48
55
60
66
% chg
25.1
24.9
14.2
9.0
10.0
Other
74
87
83
90
99
% chg
2.0
18.8
(5.6)
9.0
10.0
Total Expenditure
332
392
394
435
482
EBITDA
79
111
108
111
126
% chg
36.6
40.3
(2.5)
3.1
13.2
(% of Net Sales)
19.2
22.0
21.5
20.4
20.7
Depreciation
36
35
36
41
45
EBIT
43
75
72
70
81
% chg
17.1
75.7
(4.2)
(2.5)
14.6
(% of Net Sales)
10.4
15.0
14.4
12.9
13.3
Interest & other Charges
8
9
8
8
7
Other Income
3
2
5
6
7
(% of Net Sales)
0.8
0.5
1.1
1.1
1.1
Recurring PBT
35
66
64
62
74
% chg
19.5
87.9
(3.6)
(2.5)
18.7
PBT (reported)
38
69
69
68
81
Tax
9
18
19
18
22
(% of PBT)
23.7
26.4
27.7
27.0
27.0
PAT (reported)
29
51
50
50
59
Extraordinary Expense/(Inc.)
1
0
0
0
0
ADJ. PAT
28
51
50
50
59
% chg
14.8
80.0
(0.9)
(0.6)
18.1
(% of Net Sales)
6.8
10.1
10.0
9.1
9.7
Basic EPS (`)
23.3
41.9
41.5
41.3
48.7
Fully Diluted EPS (`)
23.3
41.9
41.5
41.3
48.7
% chg
14.8
80.0
(0.9)
(0.6)
18.1
May 13, 2016
8
M M Forgings | 4QFY2016 Result Update
Balance sheet
Y/E Mar. (` cr)
FY2014
FY2015
FY2016E
FY2017E
FY2018E
SOURCES OF FUNDS
Equity Share Capital
12
12
12
12
12
Reserves& Surplus
184
226
268
309
359
Shareholders’ Funds
196
238
280
321
371
Total Loans
151
190
213
191
144
Other Long Term Liabilities
1
1
0
0
0
Long Term Provisions
0
0
0
0
0
Deferred Tax (Net)
11
12
14
14
14
Total liabilities
359
441
506
526
529
APPLICATION OF FUNDS
Gross Block
438
499
551
651
683
Less: Acc. Depreciation
238
273
309
350
396
Net Block
200
225
242
301
287
Capital Work-in-Progress
7
11
50
5
6
Goodwill
-
-
-
-
-
Investments
0
0
0
0
0
Long Term Loans and adv.
16
15
6
6
7
Other Non-current asset
4
4
3
4
4
Current Assets
151
218
237
246
265
Cash
25
89
121
118
122
Loans & Advances
20
21
28
30
33
Inventory
76
79
73
76
84
Debtors
29
29
15
22
25
Other current assets
0
0
0
0
0
Current liabilities
19
32
31
36
40
Net Current Assets
132
186
205
211
225
Misc. Exp. not written off
-
-
-
-
-
Total Assets
359
441
506
526
529
May 13, 2016
9
M M Forgings | 4QFY2016 Result Update
Cash flow statement
Y/E Mar. (` cr)
FY2014 FY2015 FY2016 FY2017E FY2018E
Profit before tax
38
69
69
68
81
Depreciation
36
35
36
41
45
Change in Working Capital
4
10
12
(8)
(10)
Direct taxes paid
(9)
(17)
(18)
(18)
(22)
Others
(34)
9
(5)
(6)
(7)
Cash Flow from Operations
35
106
94
77
87
(Inc.)/Dec. in Fixed Assets
(43)
(65)
(91)
(55)
(33)
(Inc.)/Dec. in Investments
-
-
(0)
-
-
(Incr)/Decr In LT loans & adv.
(3)
2
10
(1)
(1)
Others
6
0
5
6
7
Cash Flow from Investing
(40)
(63)
(76)
(50)
(27)
Issue of Equity
-
-
-
-
-
Inc./(Dec.) in loans
6
39
22
(21)
(48)
Dividend Paid (Incl. Tax)
(6)
(8)
(8)
(8)
(8)
Others
6
(10)
-
-
-
Cash Flow from Financing
6
21
14
(30)
(56)
Inc./(Dec.) in Cash
1
64
32
(3)
4
Opening Cash balances
24
25
89
121
118
Closing Cash balances
25
89
121
118
122
May 13, 2016
10
M M Forgings | 4QFY2016 Result Update
Key ratios
Y/E Mar.
FY2014
FY2015
FY2016
FY2017E
FY2018E
Valuation Ratio (x)
P/E (on FDEPS)
19.6
10.9
11.0
11.1
9.4
P/CEPS
8.6
6.4
6.4
6.1
5.3
P/BV
2.8
2.3
2.0
1.7
1.5
EV/Net sales
1.6
1.3
1.3
1.1
0.9
EV/EBITDA
8.6
5.9
5.9
5.6
4.5
EV / Total Assets
1.9
1.5
1.3
1.2
1.1
Per Share Data (`)
EPS (Basic)
23.3
41.9
41.5
41.3
48.7
EPS (fully diluted)
23.3
41.9
41.5
41.3
48.7
Cash EPS
53.1
71.2
71.2
75.2
86.4
DPS
4.0
6.0
6.0
6.0
6.0
Book Value
162.2
197.1
231.6
265.9
307.7
DuPont Analysis
EBIT margin
10.4
15.0
14.4
12.9
13.3
Tax retention ratio
0.8
0.7
0.7
0.7
0.7
Asset turnover (x)
1.3
1.6
1.5
1.5
1.6
ROIC (Post-tax)
10.4
17.2
16.1
14.5
15.2
Cost of Debt (Post Tax)
3.9
3.9
3.0
2.9
2.9
Leverage (x)
0.6
0.4
0.3
0.2
0.1
Operating ROE
14.6
22.9
20.3
17.1
15.9
Returns (%)
ROCE (Pre-tax)
12.9
19.4
15.7
14.0
15.7
Angel ROIC (Pre-tax)
13.7
23.4
22.2
19.8
20.8
ROE
15.3
23.3
19.4
16.6
17.0
Turnover ratios (x)
Asset TO (Gross Block)
1.0
1.1
1.0
0.9
0.9
Inventory / Net sales (days)
65
56
55
50
48
Receivables (days)
28
21
16
15
15
Payables (days)
29
24
29
30
30
WC cycle (ex-cash) (days)
96
74
66
59
59
Solvency ratios (x)
Net debt to equity
0.6
0.4
0.3
0.2
0.1
Net debt to EBITDA
1.6
0.9
0.8
0.7
0.2
Int. Coverage (EBIT/ Int.)
5.6
8.2
8.7
8.7
12.0
May 13, 2016
11
M M Forgings | 4QFY2016 Result Update
Research Team Tel: 022 - 39357800
DISCLAIMER
Angel Broking Private Limited (hereinafter referred to as “Angel”) is a registered Member of National Stock Exchange of India Limited,
Bombay Stock Exchange Limited and Metropolitan Stock Exchange of India Limited. It is also registered as a Depository Participant with
CDSL and Portfolio Manager with SEBI. It also has registration with AMFI as a Mutual Fund Distributor. Angel Broking Private Limited is
a registered entity with SEBI for Research Analyst in terms of SEBI (Research Analyst) Regulations, 2014 vide registration number
INH000000164. Angel or its associates has not been debarred/ suspended by SEBI or any other regulatory authority for accessing
/dealing in securities Market. Angel or its associates including its relatives/analyst do not hold any financial interest/beneficial
ownership of more than 1% in the company covered by Analyst. Angel or its associates/analyst has not received any compensation /
managed or co-managed public offering of securities of the company covered by Analyst during the past twelve months. Angel/analyst
has not served as an officer, director or employee of company covered by Analyst and has not been engaged in market making activity
of the company covered by Analyst.
This document is solely for the personal information of the recipient, and must not be singularly used as the basis of any investment
decision. Nothing in this document should be construed as investment or financial advice. Each recipient of this document should
make such investigations as they deem necessary to arrive at an independent evaluation of an investment in the securities of the
companies referred to in this document (including the merits and risks involved), and should consult their own advisors to determine
the merits and risks of such an investment.
Reports based on technical and derivative analysis center on studying charts of a stock's price movement, outstanding positions and
trading volume, as opposed to focusing on a company's fundamentals and, as such, may not match with a report on a company's
fundamentals.
The information in this document has been printed on the basis of publicly available information, internal data and other reliable
sources believed to be true, but we do not represent that it is accurate or complete and it should not be relied on as such, as this
document is for general guidance only. Angel Broking Pvt. Limited or any of its affiliates/ group companies shall not be in any way
responsible for any loss or damage that may arise to any person from any inadvertent error in the information contained in this report.
Angel Broking Pvt. Limited has not independently verified all the information contained within this document. Accordingly, we cannot
testify, nor make any representation or warranty, express or implied, to the accuracy, contents or data contained within this document.
While Angel Broking Pvt. Limited endeavors to update on a reasonable basis the information discussed in this material, there may be
regulatory, compliance, or other reasons that prevent us from doing so.
This document is being supplied to you solely for your information, and its contents, information or data may not be reproduced,
redistributed or passed on, directly or indirectly.
Neither Angel Broking Pvt. Limited, nor its directors, employees or affiliates shall be liable for any loss or damage that may arise from
or in connection with the use of this information.
Note: Please refer to the important ‘Stock Holding Disclosure' report on the Angel website (Research Section). Also, please refer to the
latest update on respective stocks for the disclosure status in respect of those stocks. Angel Broking Pvt. Limited and its affiliates may
have investment positions in the stocks recommended in this report.
Disclosure of Interest Statement
M M Forgings
1. Analyst ownership of the stock
No
2. Angel and its Group companies ownership of the stock
No
3. Angel and its Group companies' Directors ownership of the stock
No
4. Broking relationship with company covered
No
Note: We have not considered any Exposure below ` 1 lakh for Angel, its Group companies and Directors
Ratings (Based on expected returns
Buy (> 15%)
Accumulate (5% to 15%)
Neutral (-5 to 5%)
over 12 months investment period):
Reduce (-5% to -15%)
Sell (< -15%)
May 13, 2016
12