IPO Note | Metal
Mar 19, 2018
MISHRA DHATU NIGAM Ltd.
NEUTRAL
sue Open: Mar 21, 2018
Is
Issue Close: Mar 23, 2018
Incorporated in 1973, with an aim of achieving self-reliance in research and
development, and supply of critical alloys and products of national security, Mishra
Issue Details
Dhatu Nigam Ltd. (MIDHANI) is one of the leading manufacturers of special steels,
super alloys and the only manufacturer of titanium alloys in India. These are high
Face Value: `10
value products which cater to niche end user segments such as defence, space and
Present Eq. Paid up Capital: `187.3cr
power.
Positives: (a) Modern and integrated metallurgical plant for manufacturing a wide
Fresh issue: Nil
spectrum of critical alloys in variety of forms for defence, space and thermal power
Post Eq. Paid up Capital: `187.3cr
(b) Strong long-term customer relationships (c) In-house R&D team aimed at latest
development and improvement of product quality and processes innovation (d)
Issue size (amount): `438cr
Experienced Promoters supported by professionally qualified, experienced and
entrepreneurial management team.
Price Band: `87-90
Investment concerns: (a) MIDHANI reported low top-line and bottom-line CAGR of
Lot Size: 150 shares and in multiple
11% & 10% respectively over FY15-17 (b) Company has an order book of `517cr
thereafter
which works out to 0.64x compared to FY2017 revenue, reflecting low revenue
Post-issue implied mkt. cap: *`1630cr -
visibility (c) During 1HFY18, the company has reported very low operating margin
**`1686cr
and profitability.
Promoters holding Pre-Issue: 100.0%
Outlook & Valuation: In terms of valuations, the pre-issue P/E works out to 30.9x
Promoters holding Post-Issue: 74.0%
1HFY2018 annualized earnings (at the upper end of the issue price band), which is
*Calculated on lower price band
high considering MIDHANI’s historical two year CAGR top-line & bottom-line
growth. Further, MIDHANI has an undersized order book which lacks revenue
** Calculated on upper price band
visibility, coupled with lower return ratios. Considering the above factors, we
Book Building
recommend NEUTRAL rating on the issue.
QIBs
50% of issue
Key Financials
Non-Institutional
15% of issue
Y/E March (` cr)
FY2015
FY2016
FY2017
1HFY18
Net Sales
656
761
810
208
Retail
35% of issue
% chg
-
16.1
6.3
-
Net Profit
104
119
126
27
Post Issue Shareholding Patter
% chg
-
15.2
5.8
-
Promoters
74.0%
OPM (%)
20.6
19.8
22.9
21.7
EPS (`)
5.5
6.4
6.7
1.5
Others
26.0%
P/E (x)
16.3
14.1
13.3
-
P/BV (x)
3.1
2.7
2.4
-
RoE (%)
19.2
19.3
17.9
-
RoCE (%)
21.0
21.8
23.3
-
EV/Sales (x)
2.5
2.0
1.8
-
EV/EBITDA (x)
12.2
9.9
8.0
-
Angel Research; Note: Valuation ratios based on pre-issue outstanding shares and at upper end
of the price band
Amarjeet S Maurya
+022 39357600, Extn: 6831
Please refer to important disclosures at the end of this report
1
MIDHANI | IPO Note
Company background
Incorporated in 1973, with an aim of achieving self-reliance in research and
development, and supply of critical alloys and products of national security,
MIDHANI is one of the leading manufacturers of special steels, super alloys and
the only manufacturer of titanium alloys in India. These are high value products
which cater to niche end user segments such as defence, space and power.
It has emerged as a ‘National Centre for Excellence’ in advanced metallurgical
production of special metals and super alloys in India. MIDHANI has the
technological ability to manufacture a wide range of advanced metals and alloys
under one roof. With the growth of MIDHANI business and operations, it has
achieved the status of a Mini Ratna, Category-I company in 2009.
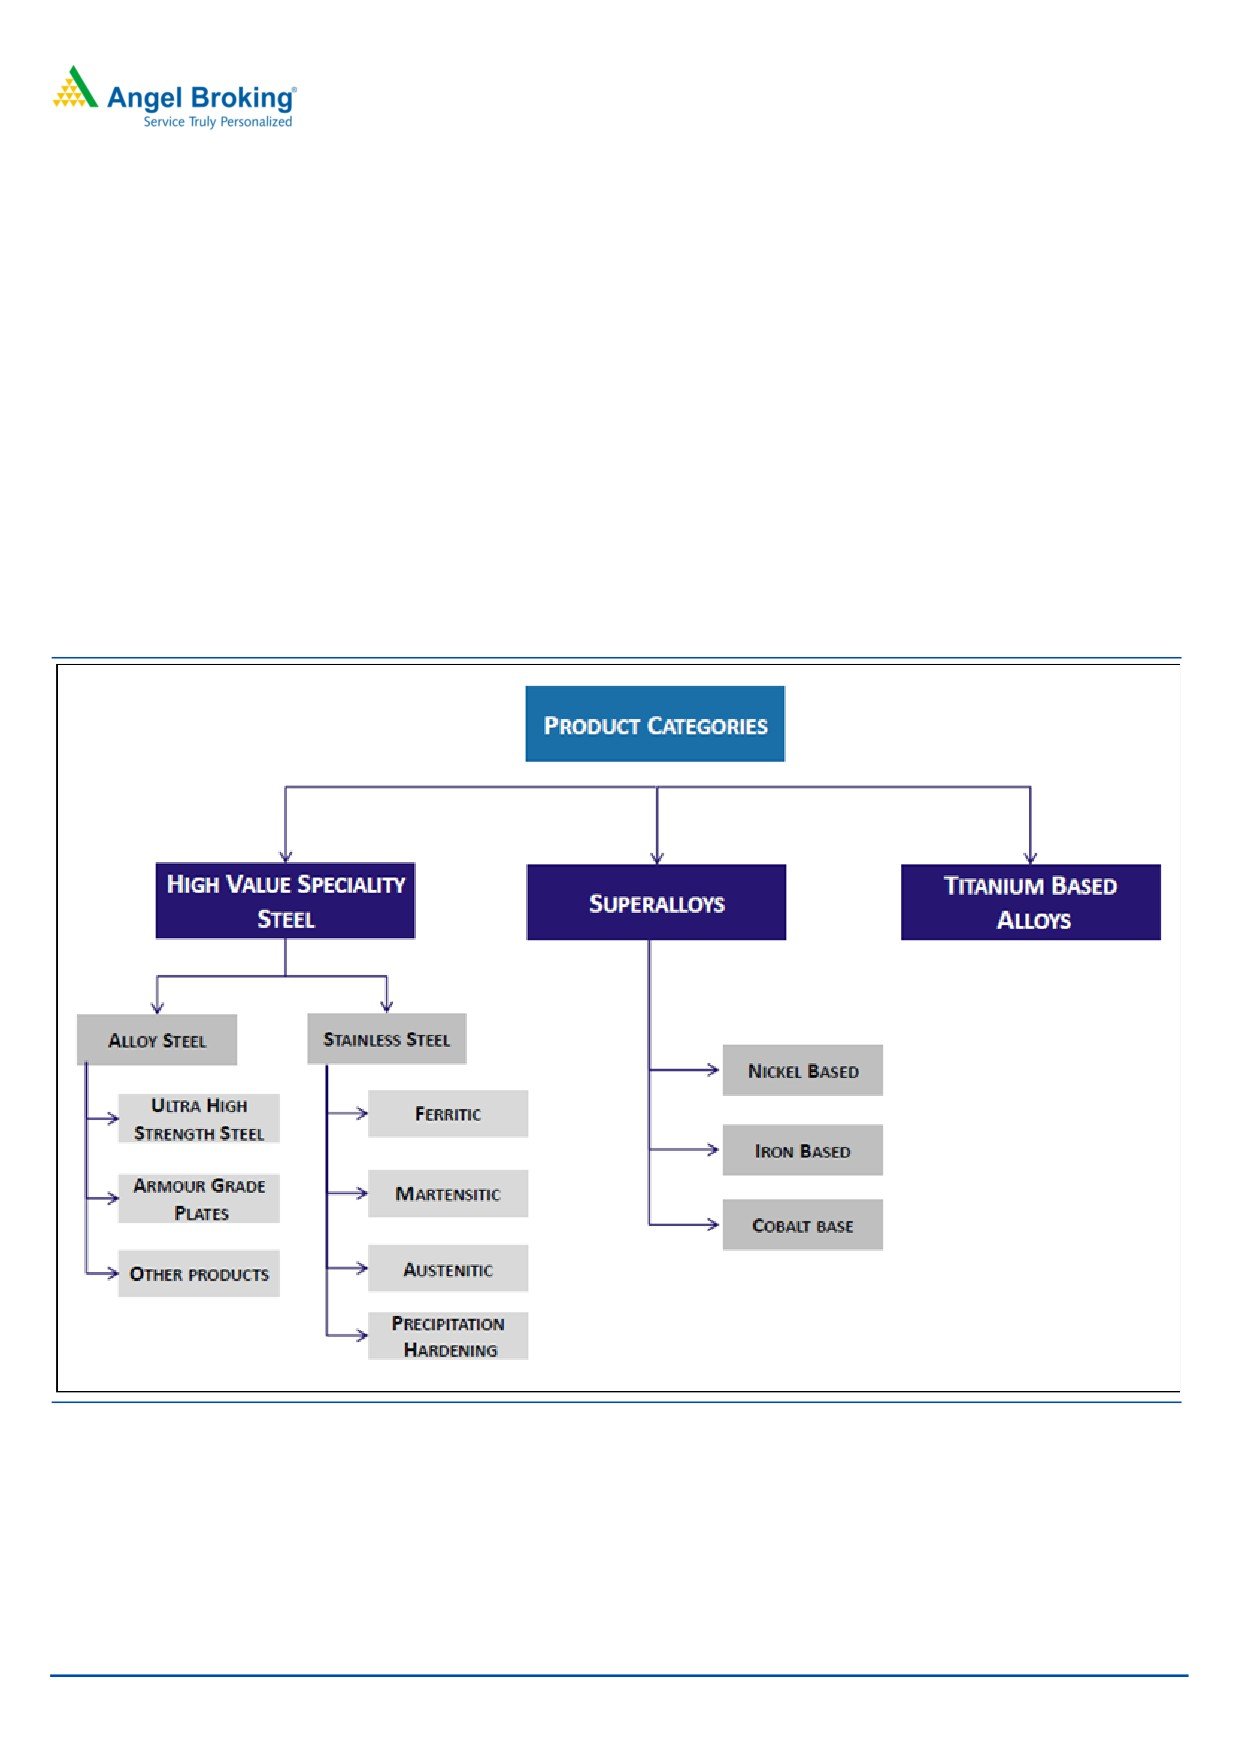
Exhibit 1: Product Portfolio
Source: Company, Angel Research
Mar 19, 2018
2
MIDHANI | IPO Note
Issue details
MIDHANI is raising ~`438cr through offer for sale of equity shares in the price
band of `87-`90. The company will dilute 26.0% (at upper price band) of its post-
offer paid-up equity share capital.
Exhibit 2: Pre and Post IPO shareholding pattern
N o of share s (Pre-issue)
% No of shares (Post-issue)
%
Promoters
18,73,40,000
100.0%
13,86,31,600
74.0%
Others
-
-
4,87,08,400
26.0%
18,73,40,000
100.0%
18,73,40,000
100.0%
Source: Source: RHP, Note: Calculated on upper price band
Note: A discount of `3 per equity share is offered to Retail Investors & Employees.
Objectives of the Offer
Company’s objectives of the offer are:
To achieve the benefits of listing the Equity Shares on the Stock Exchanges
Raising funds for general corporate purposes
Outlook & Valuation
In terms of valuations, the pre-issue P/E works out to 30.9x 1HFY2018
annualized earnings (at the upper end of the issue price band), which is high
considering MIDHANI’s historical two year CAGR top-line & bottom-line
growth. Further, MIDHANI has an undersized order book which lacks revenue
visibility, coupled with lower return ratios. Considering the above factors, we
recommend NEUTRAL rating on the issue.
Key Risks
Strong order inflow and improvement in execution cycle of current order
book could improve the company’s profitability. It will pose an upside risk
to our view.
Increase in competition from other players can impact the business of
MIDHANI.
Mar 19, 2018
3
MIDHANI | IPO Note
Income Statement
Y/E March (`cr)
FY2015
FY2016
FY2017
1HFY18
Total operating income
656
761
810
208
% chg
-
16.1
6.3
-
Total Expenditure
521
610
624
163
Raw Material
228
328
308
18
Personnel
99
91
109
49
Others Expenses
194
192
207
95
EBITDA
135
151
185
45
% chg
-
12.0
22.6
-
(% of Net Sales)
20.6
19.8
22.9
21.7
Depreciation& Amortisation
10
14
18
9
EBIT
125
137
168
36
% chg
-
9.5
22.3
-
(% of Net Sales)
19.1
18.0
20.7
17.2
Interest & other Charges
7
4
5
2
Other Income
23
29
23
13
(% of PBT)
16.1
17.9
12.5
26.8
Share in profit of Associ ates
-
-
-
-
Recurring PBT
141
162
186
47
% chg
-
15.0
15.1
-
Tax
37
42
60
20
(% of PBT)
26.4
26.2
32.2
41.9
PAT (reported)
104
119
126
27
% chg
-
15.2
5.8
-
(% of Net Sales)
15.8
15.7
15.6
13.1
Basic EPS (`)
5.5
6.4
6.7
1.5
Fully Diluted EPS (`)
5.5
6.4
6.7
1.5
% chg
-
15.2
5.8
-
Source: Company, Angel Research
Mar 19, 2018
4
MIDHANI | IPO Note
Exhibit 3: Balance Sheet
Y/E March (` cr)
FY2015
FY2016
FY2017
1HFY18
SOURCES OF FUNDS
Equity Share Capital
187
187
187
187
Reserves& Surplus
353
432
517
546
Shareholders’ Funds
540
620
704
733
Total Loans
55
9
14
66
Deferred Tax Liability
13
23
20
24
Total Liabilities
608
651
739
823
APPLICATION OF FUNDS
Net Block
298
327
357
363
Capital Work-in-Progress
9
7
6
54
Investments
2
2
2
2
Current Assets
854
785
736
810
Inventories
423
289
206
251
Sundry De btors
220
209
289
222
Cash
89
196
208
261
Loans & Advances
0
0
0
0
Other Assets
121
92
34
77
Current liabilities
555
470
362
407
Net Current Assets
298
316
374
404
Deferred Tax Asset
-
-
-
-
Total Assets
608
651
739
823
Source: Company, Angel Research
Mar 19, 2018
5
MIDHANI | IPO Note
Exhibit 4: Cash Flow Statement
Y/E March (`cr)
FY2015
FY2016
FY2017
1HFY18
Profit before tax
143
163
188
50
Depreciation
10
14
18
9
Change in Working Capital
(64)
84
(13)
22
Interest / Dividend (Net)
7
4
5
2
Direct taxes paid
(38)
(38)
(61)
(26)
Others
(11)
(11)
(17)
(9)
C ash Flow from Operati ons
47
216
119
47
(Inc.)/ Dec. in Fixed Assets
(20)
(19)
(64)
(45)
(Inc.)/ Dec. in Investments
11
(87)
(0)
(85)
C ash Flow from Inve sting
(9)
(107)
(65)
(130)
Issue of Equity
Inc./(Dec.) in loans
9
(46)
5
52
Dividend Pai d (Incl. Tax)
(45)
(40)
(43)
0
Interest / Dividend (Net)
(7)
(4)
(5)
(2)
C ash Flow from Financing
(43)
(90)
(43)
50
Inc./(Dec.) in Cash
(5)
19
12
(32)
Ope ning Cash bal ances
9
3
22
34
Closing Cash balances
3
22
34
2
Source: Company, Angel Research
Mar 19, 2018
6
MIDHANI | IPO Note
Exhibit 5: Key Ratios
Y/E March
FY2015
FY2016
FY2017
Valuati on Ratio (x)
P/E (on FDEPS)
16.3
14.1
13.3
P/CEPS
14.9
12.6
11.7
P/BV
3.1
2.7
2.4
Dividend yield (%)
0.0
0.0
0.0
EV/Sales
2.5
2.0
1.8
EV/EBITDA
12.2
9.9
8.0
EV / Total Assets
2.7
2.3
2.0
Per Share Data (`)
EPS (Basic)
5.5
6.4
6.7
EPS (fully diluted)
5.5
6.4
6.7
Cash EPS
6.1
7.1
7.7
Book Value
28.8
33.1
37.6
Returns (%)
ROCE
21.0
21.8
23.3
Angel ROIC (Pre-tax)
24.9
31.8
33.0
ROE
19.2
19.3
17.9
Turnover rati os (x)
Inventory / Sales (days)
235
138
93
Receivables (days)
123
100
130
Payable s (days)
53
25
30
Working capital cycle (ex-cash) (days)
305
213
193
Source: Company, Angel Research
Mar 19, 2018
7
MIDHANI | IPO Note
Research Team Tel: 022 - 39357800
DISCLAIMER
Angel Broking Private Limited (hereinafter referred to as “Angel”) is a registered Member of National Stock Exchange of India Limited,
Bombay Stock Exchange Limited and Metropolitan Stock Exchange Limited. It is also registered as a Depository Participant with CDSL
and Portfolio Manager and investment advisor with SEBI. It also has registration with AMFI as a Mutual Fund Distributor. Angel Broking
Private Limited is a registered entity with SEBI for Research Analyst in terms of SEBI (Research Analyst) Regul ations, 2014 vide
registration number INH000000164. Angel or its associates has not been debarred/ suspended by SEBI or any other regulatory
authority for accessing /dealing in securities Market. Angel or its associates/analyst has not received any compen sation / managed or
co-managed public offering of securities of the company covered by Analyst during the past twelve months.
This document is solely for the personal information of the recipient, and must not be singularly used as the basis of any in vestment
decision. Nothing in this document should be construed as investment or financial advice. Each recipient of this document sho uld
make such investigations as they deem necessary to arrive at an independent evaluation of an investment in the securities o f the
companies referred to in this document (including the merits and risks involved), and should consult their own advisors to de termine
the merits and risks of such an investment.
Reports based on technical and derivative analysis center on studying charts of a stock's price movement, outstanding positions and
trading volume, as opposed to focusing on a company's fundamentals and, as such, may not match with a report on a company's
fundamentals. Investors are advised to refer the Fundamental and Technical Research Reports available on our website to evaluate the
contrary view, if any.
The information in this document has been printed on the basis of publicly available information, internal data and other rel iable
sources believed to be true, but we do not represent that it is accurate or complete and it should not be relied on as such, as this
document is for general guidance only. Angel Broking Pvt. Limited or any of its affiliates/ group companies shall not be in any way
responsible for any loss or damage that may arise to any person from any inadvertent error in the information contained in this report.
Angel Broking Pvt. Limited has not independently verified all the information contained within this document. Accordingly, we cannot
testify, nor make any representation or warranty, express or implied, to the accuracy, contents or data contained within this document.
While Angel Broking Pvt. Limited endeavors to update on a reasonable basis the information discussed in this material, there may be
regulatory, compliance, or other reasons that prevent us from doing so.
This document is being supplied to you solely for your information, and its contents, information or data may not be reproduc ed,
redistributed or passed on, directly or indirectly.
Neither Angel Broking Pvt. Limited, nor its directors, employees or affiliates shall be liable for any loss or damage that may arise fr om
or in connection with the use of this information.
Mar 19, 2018
8