2QFY2016 Result Update | Pharmaceutical
November 10, 2015
Lupin
NEUTRAL
CMP
`1,838
Performance Highlights
Target Price
-
Y/E March (` cr) 1QFY2016
4QFY2015
% chg qoq 1QFY2015
% chg yoy
Investment Period
-
Net sales
3,178
3,074
3.4
3,117
2.0
Other income
184
152
21.8
167
10.6
Stock Info
Operating profit
529
745
(29.0)
776
(31.9)
Interest
10
2
322.9
2
376.5
Sector
Pharmaceutical
Net profit
409
525
(22.1)
630
(35.1)
Market Cap (` cr)
83,442
Source: Company, Angel Research
Net Debt (` cr)
(629)
For 2QFY2016, Lupin posted a poor set of numbers, with the OPM coming in
Beta
0.7
lower than expected, and consequently the net profit as well. The company
52 Week High / Low
2,127 / 1,343
posted a 2.0% growth in sales to `3,178cr V/s `3,272cr estimated, mainly driven
Avg. Daily Volume
88,469
by the European markets. On the operating front, the Gross margin came in at
Face Value (`)
2
64.5% V/s 65.7% expected. Further, a 19.4% yoy and 36.2% yoy rise in the Staff
BSE Sensex
26,304
cost and R&D expenditure led the OPM to come in at 16.6% V/s 24.6% expected
Nifty
7,955
and V/s 24.9% in 2QFY2015. Thus, the net profit came in at `408.5cr V/s
Reuters Code
LUPN.BO
`578.6cr expected and V/s `630.0cr in 2QFY2015, a yoy dip of 35.1%. We
Bloomberg Code
LPC@IN
maintain our Neutral stance on the stock.
Below expectation numbers: The company posted a 2.0% yoy growth in sales to
Shareholding Pattern (%)
`3,178cr V/s `3,272cr estimated, mainly driven by European markets. Its key
Promoters
46.6
market US (`1,155cr), posted a dip of 9.2% yoy, on account of slow pace of
MF / Banks / Indian Fls
7.6
approvals. The company launched 4 products in the US during the period. The
company expects US sales to get normalized by 4QFY2016. Other key markets:
FII / NRIs / OCBs
37.4
India, Europe, Japan, South Africa and ROW, posted a growth of 9.4%, 32.2%, -
Indian Public / Others
8.4
6.5%, -5.6% and 52.9% yoy, respectively. On the operating front, the Gross
margin came in at 64.5% V/s 65.7% expected. Further, a 19.4% and 36.2% rise
Abs. (%)
3m 1yr 3yr
in Staff cost and R&D expenditure led the OPM to come in at 16.6% V/s 24.6%
expected and V/s 24.9% in 2QFY2015. Thus, the net profit came in at `408.5cr V/s
Sensex
(7.2)
(5.9)
39.6
`578.6cr expected and V/s `630.0cr in 2QFY2015, a yoy dip of 35.1%.
Lupin
8.8
34.1
215.8
Outlook and valuation: We expect Lupin to post a CAGR of 14.6% in net sales
3-year price chart
to `16,561cr and earnings to report a 13.1% CAGR to `68.3/share over
2,300
FY2015-17E. Currently, the stock is trading at 36.8x and 27.1x its FY2016E
2,100
and FY2017E earnings, respectively. We remain Neutral on the stock.
1,900
1,700
Key financials (Consolidated)
1,500
1,300
Y/E March (` cr)
FY2014
FY2015
FY2016E
FY2017E
1,100
Net sales
11,087
12,600
13,092
16,561
900
700
% chg
17.2
13.6
3.9
26.5
500
2
2
3
3
3
3
4
4
4
4
5
5
5
Net profit
1,836
2,403
2,266
3,072
1
1
1
1
1
1
1
-
ŧ
1
r
1
-
ŧ
1
r
1
-
ŧ
1
r
1
-
u
c
n
p
u
c
n
p
u
c
n
p
u
% chg
39.7
30.9
(5.7 )
35.5
J
O
J
a
A
J
O
J
a
A
J
O
aJ
A
J
EPS (`)
41.0
53.5
50.4
68.3
Source: Company, Angel Research
EBITDA margin (%)
25.3
27.4
25.0
27.0
P/E (x)
44.9
34.4
36.5
26.9
RoE (%)
30.3
30.4
22.8
24.7
RoCE (%)
34.7
34.3
26.1
29.6
P/BV (x)
11.9
9.3
7.5
6.0
Sarabjit Kour Nangra
EV/sales (x)
7.4
6.5
6.1
4.7
+91 22 3935 7600 Ext: 6806
EV/EBITDA (x)
29.2
23.7
24.5
17.5
Source: Company, Angel Research; Note: CMP as of November 5, 2015
Please refer to important disclosures at the end of this report
1
Lupin | 2QFY2016 Result Update
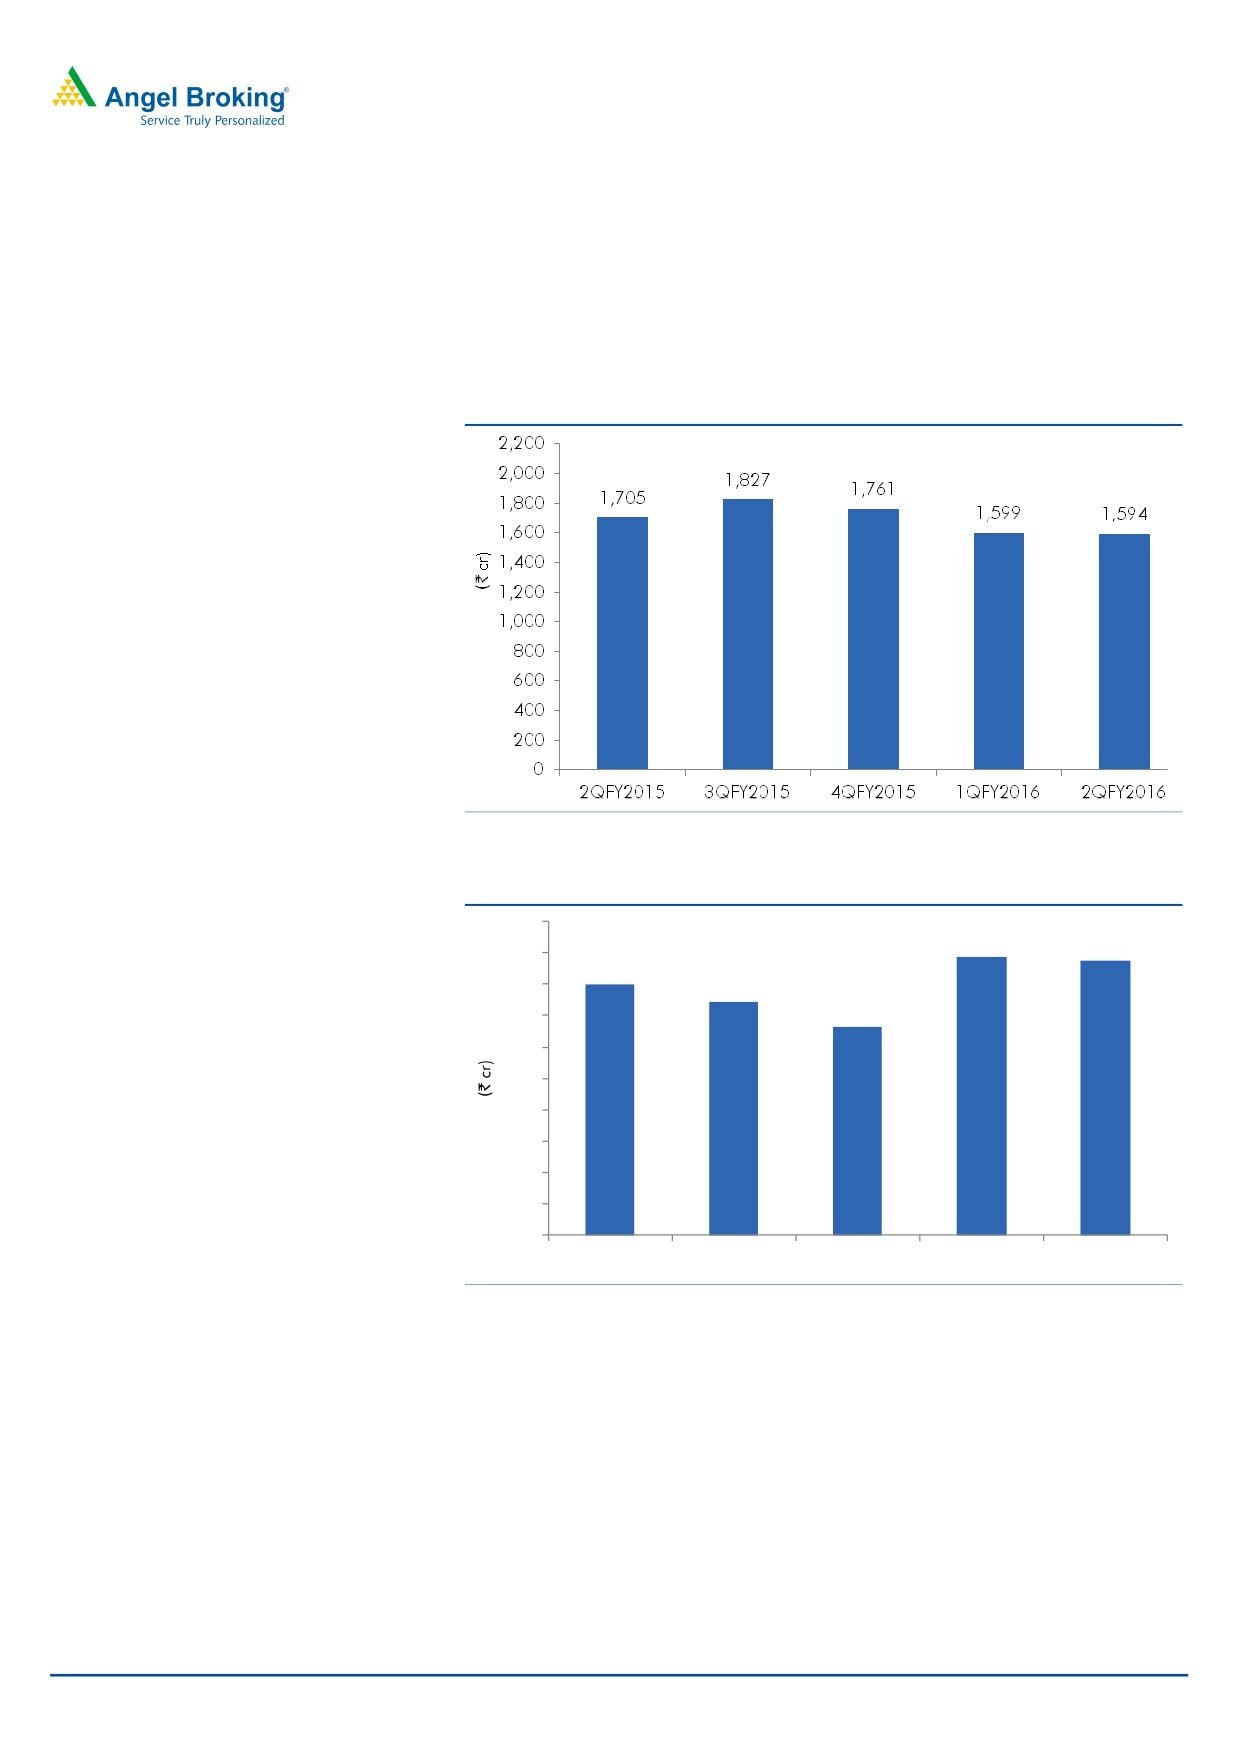
Exhibit 1: 2QFY2016 - Consolidated performance
Y/E March (` cr)
2QFY2016
1QFY2016
% chg (qoq) 2QFY2015
% chg (yoy) 1HFY2016 1HFY2015
% chg (yoy)
Net sales
3,178
3,074
3.4
3,117
2.0
6,253
6,401
(2.3)
Other income
184
152
21.8
167
10.6
336
253
33.0
Total income
3,363
3,226
4.2
3,284
2.4
6,589
6,653
(1.0)
Gross profit
2,049
2,091
(2.0)
2,116
4,140
4,224
(2.0)
Gross margin
64.5
68.0
67.9
66.2
66.0
Operating profit
528.8
744.5
(29.0)
776
(31.9)
1,273
1,833.8
(30.6)
OPM (%)
16.6
24.2
24.9
20.4
28.7
Interest
10
2
322.9
2
376.5
13
5
167.0
Dep. & amortisation
107
101
6.1
109
(1.7)
208
217
(4.5)
PBT
596
793
(24.8)
832
(28.3)
1,389
1,864
(25.5)
Provision for taxation
185
264
(30.0)
193
(3.9)
450
596
(24.5)
Reported net profit
411
529
(22.2)
639
(35.7)
940
1,269
(26.0)
Less : exceptional items
-
-
-
-
-
MI & share in associates
3
3
(12.0)
9
(71.8)
6
14
(60.3)
PAT after exceptional items
409
525
(22.1)
630
(35.1)
934
1,255
(25.6)
EPS (`)
9.1
11.7
14.1
20.8
28.0
Source: Company, Angel Research
Exhibit 2: 2QFY2016 - Actual vs Angel estimates
` cr
Actual
Estimates
Variation
Net Sales
3,178
3,273
(2.9)
Other Income
184
152
21.8
Operating Profit
529
804
(34.2)
Deprecation
107
101
6.1
Tax
185
264
(30.0)
Net Profit
409
579
(29.3)
Source: Company, Angel Research
Revenue grows 2.0% yoy: The company posted a 2.0% yoy growth in sales to end
the period at `3,178cr V/s `3,272cr estimated, mainly driven by European
markets. Overall formulations posted a sales growth of 2.0% yoy to `2,856.4cr
and APIs posted a 1.1% yoy growth to `321.9cr. Indian formulation sales
(`874cr), a yoy growth of 9.4%. Overall, formulations posted a growth of 2.1%
yoy (~90% of sales), while API grew by 1.1% yoy (~10% of sales).
Its key market US (`1,155cr), posted a dip of 9.2% yoy, on slow pace of approvals.
The company launched 4 products in the US during the period. The company
expects US sales to get normalized by 4QFY2016. It has 84 products in the
market.
Another export destination - Japan, posted a yoy dip of 6.5% to `323.4cr, mainly
on back of the currency impact. Sales in JPY terms grew 2.5% yoy to JPY6,077mn
during the quarter. Lupin’s sales in Europe (`115.8cr) and India (`873.8cr) posted
a yoy growth of 32.2% and 9% yoy, respectively. ROW (`288.6cr) posted a strong
growth of 52.9% yoy in 2QFY2016.
Pharma Dynamics clocked in revenues of `99.8cr during 2QFY2016, a decline of
5.6% yoy, while growing by 6.1% in ZAR terms to end the quarter at ZAR199mn.
November 10, 2015
2
Lupin | 2QFY2016 Result Update
The company remains the fastest growing and the 4th largest generic company in
the South African market with clear leadership in the cardiovascular space.
On the regulatory front, Lupin received 7 approvals from the USFDA during the
quarter. Cumulative ANDA filings with the USFDA as of September 30, 2015 stood
at 220 (35 FTFs) with the company having received 124 approvals to date.
Exhibit 3: Advanced markets - Sales trend
Source: Company, Angel Research
Exhibit 4: Domestic Formulation Market
1000
885
874
900
799
800
744
664
700
600
500
400
300
200
100
0
2QFY2015
3QFY2015
4QFY2015
1QFY2016
2QFY2016
Source: Company
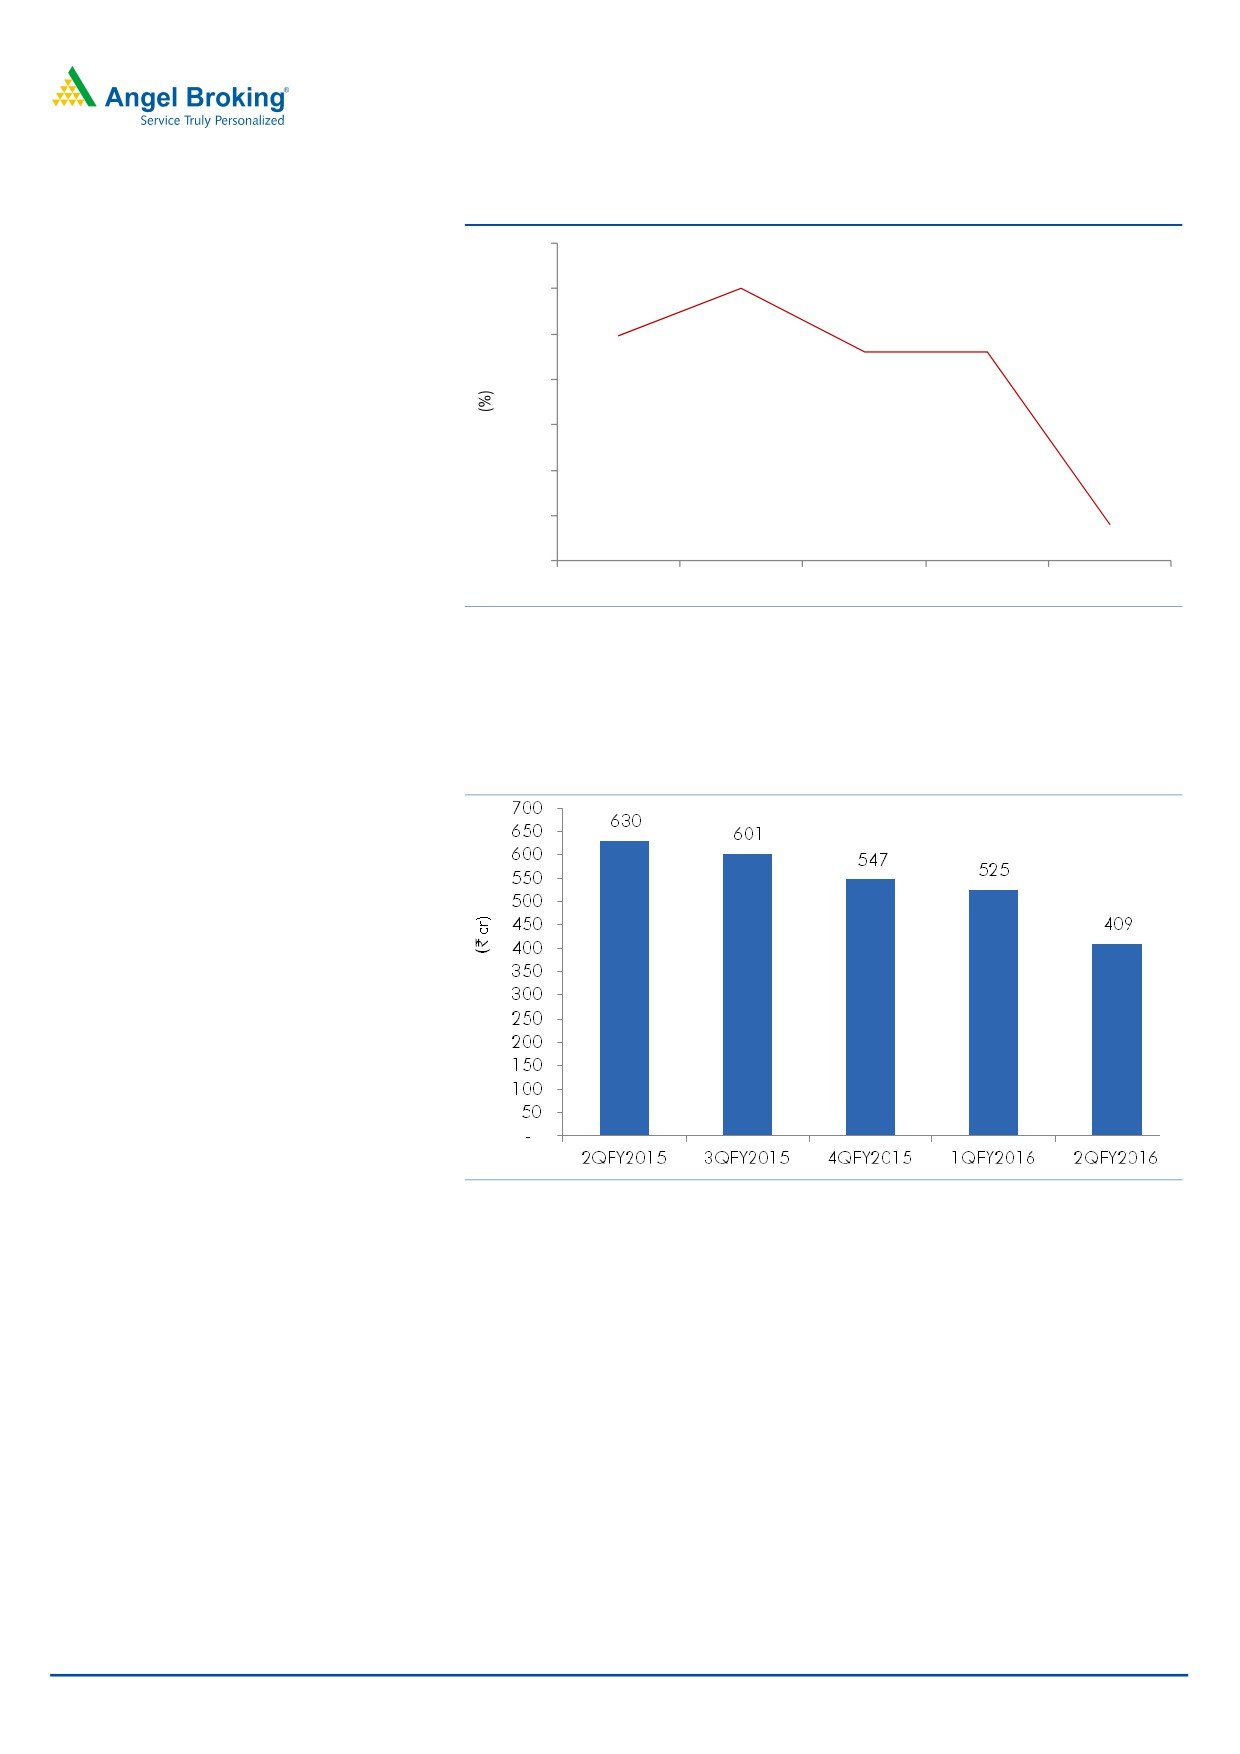
OPM lower than expectation at 16.6%: On the operating front, the Gross
margin came in at 64.5% V/s 65.7% expected. Further, a 19.4% and 36.2%
yoy rise in Staff cost and R&D expenditure led the OPM to come in at 16.6%
V/s 24.6% expected and V/s 24.9% in 2QFY2015.
November 10, 2015
3
Lupin | 2QFY2016 Result Update
Exhibit 5: OPM trend
29.0
27.0
27.0
24.9
24.2
24.2
25.0
23.0
21.0
19.0
16.6
17.0
15.0
2QFY2015
3QFY2015
4QFY2015
1QFY2016
2QFY2016
Source: Company, Angel Research
Net profit growth lower than our estimate: Thus, the net profit came in at `408.5cr
V/s `578.6cr expected and V/s `630.0cr in 2QFY2015, a yoy dip of 35.1%.
Exhibit 6: Net profit trends
Source: Company, Angel Research
Conference call takeaways
The Management expects to post 17% yoy growth in the domestic formulation
business in FY2016E, despite slump seen in 2QFY2016.
The Management has guided for lower sales growth in FY2016 and expects to
report good numbers 3QFY2016 onwards, primarily helped by good number
of quality launches in US and Gavis’ acquisition (to close by 3QFY2016).
EBITDA margins to stay in the range of 26-27% in FY2016E.
November 10, 2015
4
Lupin | 2QFY2016 Result Update
Recommendation rationale
US market - the key driver: The high-margin branded generic business has
been the key differentiator for Lupin in the Indian pharmaceuticals space. On
the generic turf, Lupin is currently the fifth largest generic player in the US,
with 5.3% market share in prescription. Lupin is now the market leader in 33
products marketed in the US generics market and is amongst the Top 3 by
market share in 61 products.
Currently, the company’s cumulative filings stand at 220, of which 124 have
been approved, with 35 FTFs valued at more than US$13bn. Lupin plans to
launch 15-20 products in the US in FY2017. Another driver, the OC segment,
is expected to contribute US$100mn to the company’s top-line over the next
2-3 years. Another significant portion of the company’s US business, Branded
segment which is around ~10% of its US sales (FY2015), is expected to
increase to 30% of sales by FY2018, through acquisitions. We expect the
region to post a CAGR of 15.0% during FY2015-17.
Domestic formulations on a strong footing: Lupin continues to make strides in
the Indian market. Currently, Lupin ranks No 3, and is the fastest growing
company among the top five companies in the domestic formulation space,
registering a strong CAGR of 20.0% over the last few years. Six of Lupin's
products are among the top 300 brands in the country. Lupin introduced
54 new products in the Indian market in FY2014 and has a strong field force
of ~5,400MRs (as of FY2015). We expect the domestic formulation market to
grow at a CAGR of 16.0% over FY2015-17E.
First-mover advantage in Japan: Lupin figures among the few Indian
companies with a formidable presence in the world’s second largest pharma
market (ranked as the 8th largest as per IMS MAT March 2014). The
Management believes there will be patent expiries (US$14-16bn) in the next
two years in the Japanese market, which along with increased generic
penetration, would drive growth in the market. For FY2015, the market posted
a moderate growth after a dip in FY2014; however going forward the
company expects a healthy growth, with double digit growth (15% in constant
currency) in the Kyowa business and a single digit growth in the I’rom
business. The Management expects improvement in growth in the next 3-4
years. On a conservative basis, we expect the market to post a CAGR of 9.5%
over FY2015-17E.
November 10, 2015
5
Lupin | 2QFY2016 Result Update
Valuation
We expect Lupin to post a CAGR of
9.5% in net sales to
`15,110cr and earnings to report a
14.6% CAGR to
`68.3/share over
FY2015-17E. Currently, the stock is trading at 36.8x and 27.1x its FY2016E and
FY2017E earnings, respectively. We remain Neutral on the stock.
Exhibit 7: Key Assumptions
FY2016E
FY2017E
Sales growth (%)
3.9
26.5
Domestic growth (%)
16.0
16.0
Exports growth (%)
1.0
30.2
Operating margins (%)
25.0
27.0
R&D Exp ( % of sales)
10.0
10.0
Capex (` cr)
1000
1000
Source: Company, Angel Research
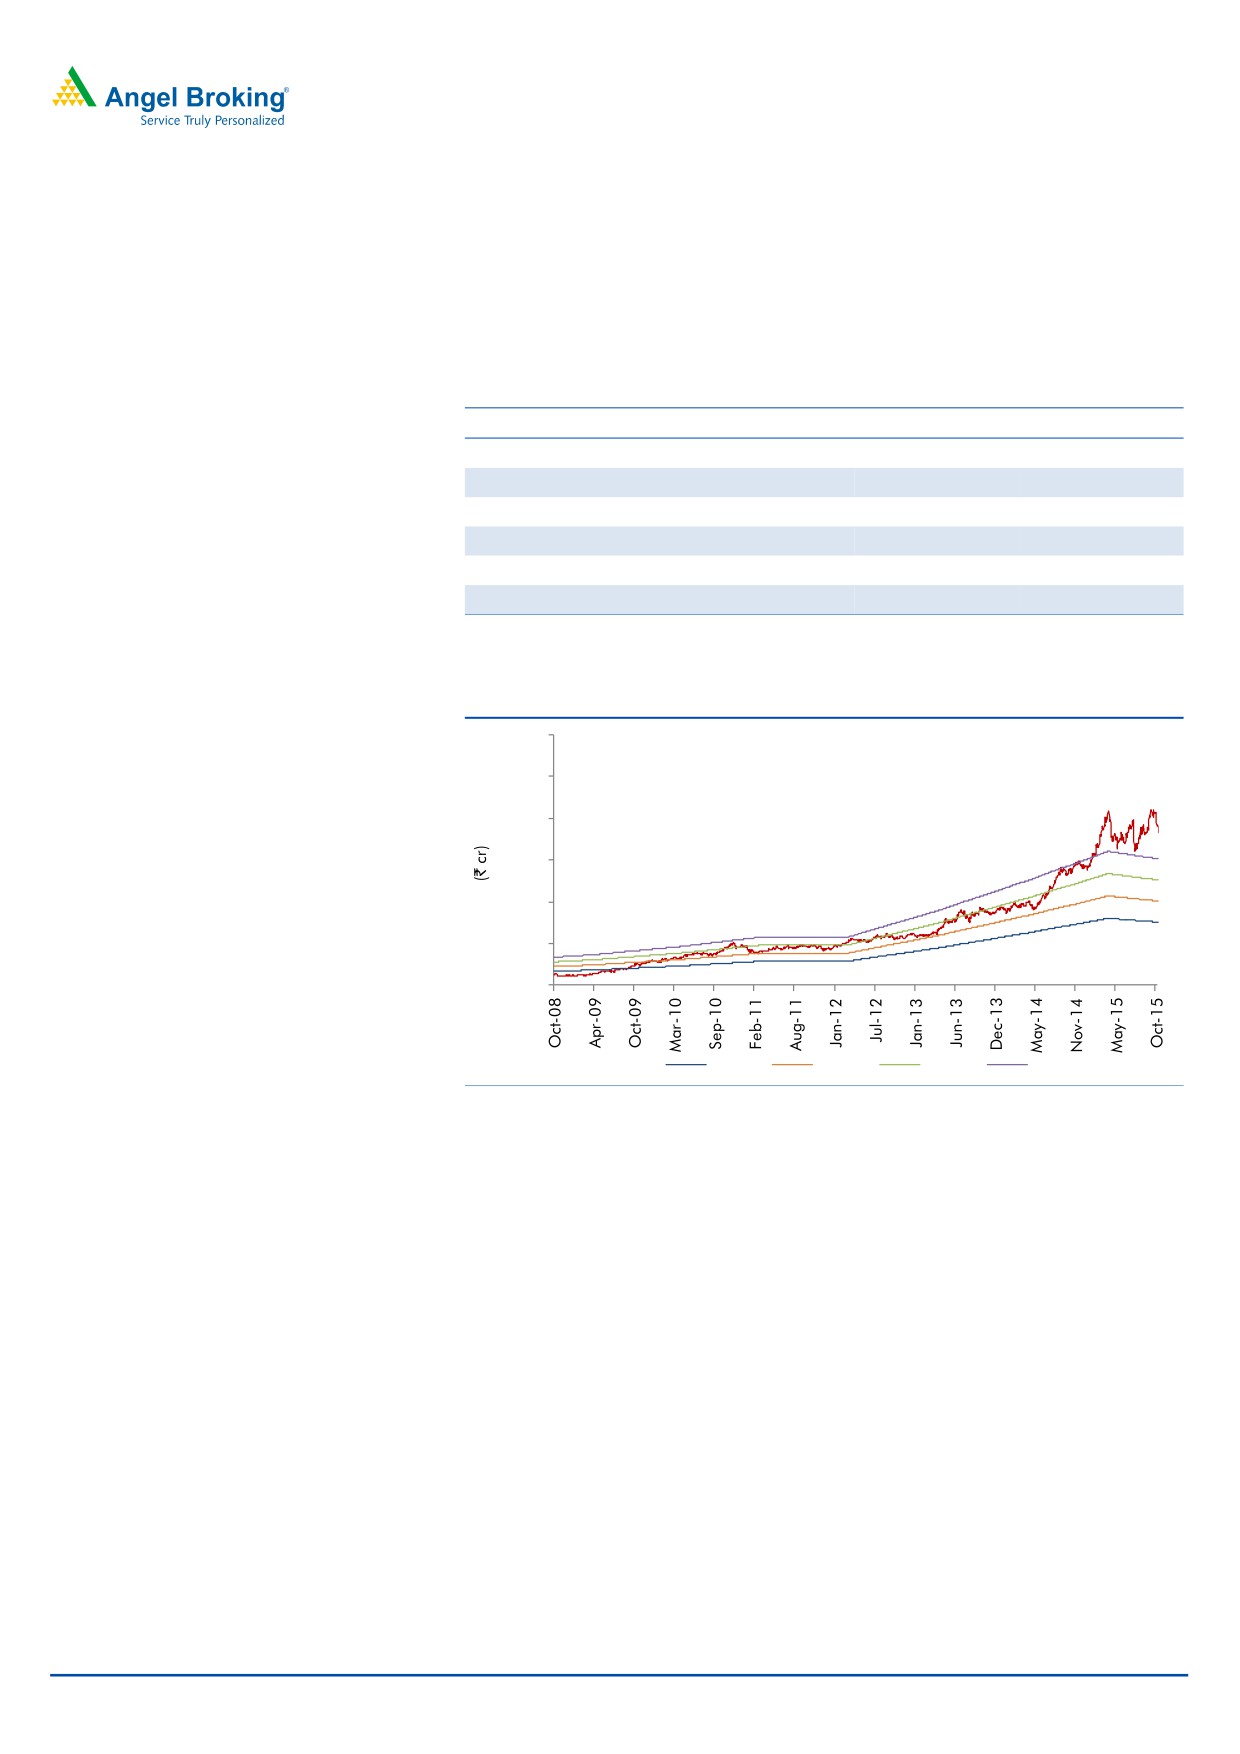
Exhibit 8: One-year forward PE
3,000
2,500
2,000
1,500
1,000
500
-
15x
20x
25x
30x
Source: Company, Angel Research
November 10, 2015
6
Lupin | 2QFY2016 Result Update
Exhibit 9: Recommendation summary
Company
Reco
CMP Tgt. price Upside
FY2017E
FY15-17E
FY2017E
(`)
(`)
(%) PE (x) EV/Sales (x) EV/EBITDA (x) CAGR in EPS (%) RoCE (%) RoE (%)
Alembic Pharma
Neutral
675
-
-
28.2
4.0
19.8
26.1
30.3
30.2
Aurobindo Pharma Accumulate
820
872
6.3
18.8
3.0
13.2
16.3
23.4
30.2
Cadila Healthcare
Neutral
429
-
-
24.4
3.7
16.7
24.6
25.2
29.0
Cipla
Neutral
659
-
-
22.8
3.1
16.4
21.4
17.1
16.8
Dr Reddy's
Neutral
4,253
-
-
22.1
3.3
14.7
21.6
20.6
22.0
Dishman Pharma
Neutral
402
-
-
18.6
1.7
8.6
20.4
11.7
11.7
GSK Pharma*
Neutral
3,191
-
-
46.7
8.1
36.9
6.6
33.7
34.3
Indoco Remedies
Neutral
310
-
-
22.4
2.4
13.4
23.0
19.7
19.7
Ipca labs
Buy
733
900
22.7
26.2
2.6
14.0
26.1
13.0
14.9
Lupin
Neutral
1,838
-
-
26.9
4.7
17.5
13.1
29.6
24.7
Sanofi India*
Neutral
4,276
-
-
28.2
3.7
17.6
33.1
27.9
25.5
Sun Pharma
Buy
816
950
16.4
30.3
5.3
17.4
8.4
15.8
16.6
Source: Company, Angel Research; Note: * December year ending
November 10, 2015
7
Lupin | 2QFY2016 Result Update
Company Background
Lupin, established in 1968, is primarily engaged in the manufacture and global
distribution of active pharmaceutical ingredients (APIs) and finished dosages. Over
the years, the company forayed into the US markets through a differentiated export
strategy of tapping branded generics and consequently gaining a large share of
the US prescription market. Further, to expand its foot-print in the global market,
Lupin has prudently adopted the inorganic growth route. In line with this, over the
last two years, the company made small acquisitions across geographies,
prominent among these being the acquisition of Kyowa in the growing Japanese
market. In the US, the company has acquired privately held GAVIS
Pharmaceuticals LLC and Novel Laboratories Inc. The acquisition enhances Lupin’s
scale in the US generic market and also broadens Lupin’s pipeline in dermatology,
controlled substance products and other high-value and niche generics.
November 10, 2015
8
Lupin | 2QFY2016 Result Update
Profit & Loss Statement (Consolidated)
Y/E March (` cr)
FY2012
FY2013
FY2014
FY2015
FY2016E
FY2017E
Gross sales
7,002
9,524
11,167
12,684
13,171
16,661
Less: Excise duty
42
62
80
84
79
100
Net sales
6,960
9,462
11,087
12,600
13,092
16,561
Other operating income
123
180
200
170
170
170
Total operating income
7,083
9,641
11,287
12,770
13,262
16,731
% chg
21.4
36.1
17.1
13.1
3.9
26.2
Total expenditure
5,638
7,371
8,284
9,150
9,819
12,089
Net raw materials
2,604
3,548
3,817
4,157
4,189
5,299
Other mfg costs
906
757
887
1,008
1,047
1,325
Personnel
970
1,249
1,465
1,747
2,053
2,153
Other
1,159
1,818
2,115
2,238
2,529
3,312
EBITDA
1,322
2,090
2,803
3,449
3,273
4,471
% chg
24.0
58.2
34.1
23.1
(5.1)
36.6
(% of Net Sales)
19.0
22.1
25.3
27.4
25.0
27.0
Depreciation& amortisation
228
332
261
435
468
548
EBIT
1,094
1,758
2,542
3,015
2,805
3,923
% chg
22.3
60.7
44.6
18.6
(7.0)
39.9
(% of Net Sales)
15.7
18.6
22.9
23.9
21.4
23.7
Interest & other charges
35
41
27
10
10
10
Other Income
14
28
116
240
240
240
(% of PBT)
1
1
4
7
7
6
Share in profit of associates
-
-
-
-
-
-
Recurring PBT
1,196
1,925
2,832
3,415
3,205
4,323
% chg
20.0
60.9
47.1
20.6
-6.1
34.9
Extraordinary expense/(Inc.)
-
-
-
-
-
-
PBT (reported)
1,196
1,925
2,832
3,415
3,205
4,323
Tax
309
584
962
970
897
1,211
(% of PBT)
25.8
30.4
34.0
28.4
28.0
28.0
PAT (reported)
888
1,340
1,870
2,444
2,307
3,113
Add: Share of earnings of asso.
-
-
-
-
-
-
Less: Minority interest (MI)
20
26
33
41
41
41
Prior period items
-
-
-
-
-
-
PAT after MI (reported)
868
1,314
1,836
2,403
2,266
3,072
ADJ. PAT
868
1,314
1,836
2,403
2,266
3,072
% chg
0.6
51.5
39.7
30.9
(5.7)
35.5
(% of Net Sales)
12.5
13.9
16.6
19.1
17.3
18.5
Basic EPS (`)
19.4
29.4
41.0
53.5
50.4
68.3
Fully Diluted EPS (`)
19.4
29.4
41.0
53.5
50.4
68.3
% chg
0.6
51.0
39.5
30.5
(5.7)
35.5
November 10, 2015
9
Lupin | 2QFY2016 Result Update
Balance Sheet (Consolidated)
Y/E March
FY2012
FY2013
FY2014
FY2015
FY2016E
FY2017E
SOURCES OF FUNDS
Equity share capital
89
90
90
90
90
90
Reserves & surplus
3,924
5,115
6,842
8,784
10,882
13,785
Shareholders funds
4,013
5,204
6,932
8,874
10,972
13,875
Minority interest
72
59
67
24
65
106
Total loans
1,640
1,164
553
471
471
471
Other Long-Term Liabilities
73
50
46
74
75
76
Long-Term Provisions
67
112
132
132
69
70
Deferred tax liability
144
163
178
118
118
118
Total liabilities
6,010
6,754
7,908
9,693
11,771
14,717
APPLICATION OF FUNDS
Gross block
3,627
4,114
4,564
5,355
6,355
7,355
Less: Acc. depreciation
1,442
1,684
1,928
2,363
2,831
3,380
Net block
2,185
2,430
2,635
2,992
3,524
3,975
Capital work-in-progress
444
311
304
304
304
304
Goodwill
564
570
720
1,648
1,648
1,648
Investments
3
2
178
1,658
1,658
1,658
Long-Term Loans and Adv.
394
387
373
275
284
359
Current assets
4,297
5,143
5,924
6,176
7,844
11,189
Cash
402
435
798
1,306
2,783
4,787
Loans & advances
309
340
302
671
697
882
Other
3,586
3,154
4,825
4,199
4,364
5,520
Current liabilities
1,878
2,089
2,227
3,360
3,491
4,416
Net current assets
2,420
3,054
3,697
2,816
4,352
6,772
Mis. Exp. not written off
-
-
-
-
-
-
Total assets
6,010
6,754
7,908
9,693
11,771
14,717
November 10, 2015
10
Lupin | 2QFY2016 Result Update
Cash Flow Statement (Consolidated)
Y/E March (` cr)
FY2012 FY2013 FY2014 FY2015 FY2016E FY2017E
Profit before tax
1,196
1,925
2,832
3,415
3,205
4,323
Depreciation
228
332
261
435
468
548
(Inc)/Dec in working capital
(724)
620
(1,481)
1,487
(69)
(491)
Direct taxes paid
(309)
(584)
(962)
(970)
(897)
(1,211)
Cash Flow from Operations
391
2,293
649
4,367
2,707
3,170
(Inc.)/Dec.in Fixed Assets
(997)
(353)
(443)
(791)
(1,000)
(1,000)
(Inc.)/Dec. in Investments
-
-
-
-
-
-
Cash Flow from Investing
(997)
(353)
(443)
(791)
(1,000)
(1,000)
Issue of equity
-
-
-
-
-
-
Inc./(Dec.) in loans
550
(476)
(611)
(82)
0
-
Dividend Paid (Incl. Tax)
(165)
(209)
(157)
(168)
(168)
(168)
Others
204
499
(795)
(2,816)
(62)
2
Cash Flow from Financing
589
(186)
(1,564)
(3,067)
(230)
(166)
Inc./(Dec.) in Cash
(18)
1,753
(1,358)
509
1,477
2,004
Opening Cash balances
420
402
435
798
1,306
2,783
Closing Cash balances
402
435
798
1,306
2,783
4,787
November 10, 2015
11
Lupin | 2QFY2016 Result Update
Key Ratios
Y/E March (` cr)
FY2012
FY2013
FY2014
FY2015
FY2016E
FY2017E
Valuation Ratio (x)
P/E (on FDEPS)
94.5
62.6
44.9
34.4
36.5
26.9
P/CEPS
74.9
50.0
39.3
29.1
30.2
22.8
P/BV
20.4
15.8
11.9
9.3
7.5
6.0
Dividend yield (%)
0.2
0.2
0.2
0.2
0.2
0.2
EV/Sales
11.9
8.7
7.4
6.5
6.1
4.7
EV/EBITDA
62.8
39.6
29.2
23.7
24.5
17.5
EV / Total Assets
13.8
12.3
10.4
8.4
6.8
5.3
Per Share Data (`)
EPS (Basic)
19.4
29.4
41.0
53.5
50.4
68.3
EPS (fully diluted)
19.4
29.4
41.0
53.5
50.4
68.3
Cash EPS
24.5
36.8
46.8
63.1
60.8
80.5
DPS
3.4
4.0
4.0
4.0
4.0
4.0
Book Value
89.9
116.3
154.6
197.4
244.1
308.7
Dupont Analysis
EBIT margin
15.7
18.6
22.9
23.9
21.4
23.7
Tax retention ratio
74.2
69.6
66.0
71.6
72.0
72.0
Asset turnover (x)
1.4
1.6
1.7
1.6
1.5
1.8
ROIC (Post-tax)
16.8
20.9
25.4
28.2
23.5
30.2
Cost of Debt (Post Tax)
1.9
2.0
2.0
1.4
1.5
1.5
Leverage (x)
0.3
0.0
0.0
0.0
0.0
0.0
Operating ROE
20.6
20.9
25.4
28.2
23.5
30.2
Returns (%)
ROCE (Pre-tax)
20.5
27.5
34.7
34.3
26.1
29.6
Angel ROIC (Pre-tax)
27.5
35.0
44.1
48.2
41.6
52.3
ROE
23.8
28.5
30.3
30.4
22.8
24.7
Turnover ratios (x)
Asset Turnover (Gross Block)
2.3
2.5
2.6
2.6
2.3
2.4
Inventory / Sales (days)
76
70
66
62
69
75
Receivables (days)
77
75
75
66
74
80
Payables (days)
156
72
84
78
89
84
WC cycle (ex-cash) (days)
87
88
89
63
42
39
Solvency ratios (x)
Net debt to equity
0.3
0.1
(0.0)
(0.1)
(0.2)
(0.3)
Net debt to EBITDA
0.9
0.3
(0.1)
(0.2)
(0.7)
(1.0)
Interest Coverage
30.8
42.9
95.4
307.3
285.9
399.9
November 10, 2015
12
Lupin | 2QFY2016 Result Update
Research Team Tel: 022 - 39357800
DISCLAIMER
Angel Broking Private Limited (hereinafter referred to as “Angel”) is a registered Member of National Stock Exchange of India Limited,
Bombay Stock Exchange Limited and Metropolitan Stock Exchange of India Limited. It is also registered as a Depository Participant with
CDSL and Portfolio Manager with SEBI. It also has registration with AMFI as a Mutual Fund Distributor. Angel Broking Private Limited is
a registered entity with SEBI for Research Analyst in terms of SEBI (Research Analyst) Regulations, 2014 vide registration number
INH000000164. Angel or its associates has not been debarred/ suspended by SEBI or any other regulatory authority for accessing
/dealing in securities Market. Angel or its associates including its relatives/analyst do not hold any financial interest/beneficial
ownership of more than 1% in the company covered by Analyst. Angel or its associates/analyst has not received any compensation /
managed or co-managed public offering of securities of the company covered by Analyst during the past twelve months. Angel/analyst
has not served as an officer, director or employee of company covered by Analyst and has not been engaged in market making activity
of the company covered by Analyst.
This document is solely for the personal information of the recipient, and must not be singularly used as the basis of any investment
decision. Nothing in this document should be construed as investment or financial advice. Each recipient of this document should
make such investigations as they deem necessary to arrive at an independent evaluation of an investment in the securities of the
companies referred to in this document (including the merits and risks involved), and should consult their own advisors to determine
the merits and risks of such an investment.
Reports based on technical and derivative analysis center on studying charts of a stock's price movement, outstanding positions and
trading volume, as opposed to focusing on a company's fundamentals and, as such, may not match with a report on a company's
fundamentals.
The information in this document has been printed on the basis of publicly available information, internal data and other reliable
sources believed to be true, but we do not represent that it is accurate or complete and it should not be relied on as such, as this
document is for general guidance only. Angel Broking Pvt. Limited or any of its affiliates/ group companies shall not be in any way
responsible for any loss or damage that may arise to any person from any inadvertent error in the information contained in this report.
Angel Broking Pvt. Limited has not independently verified all the information contained within this document. Accordingly, we cannot
testify, nor make any representation or warranty, express or implied, to the accuracy, contents or data contained within this document.
While Angel Broking Pvt. Limited endeavors to update on a reasonable basis the information discussed in this material, there may be
regulatory, compliance, or other reasons that prevent us from doing so.
This document is being supplied to you solely for your information, and its contents, information or data may not be reproduced,
redistributed or passed on, directly or indirectly.
Neither Angel Broking Pvt. Limited, nor its directors, employees or affiliates shall be liable for any loss or damage that may arise from
or in connection with the use of this information.
Note: Please refer to the important ‘Stock Holding Disclosure' report on the Angel website (Research Section). Also, please refer to the
latest update on respective stocks for the disclosure status in respect of those stocks. Angel Broking Pvt. Limited and its affiliates may
have investment positions in the stocks recommended in this report.
Disclosure of Interest Statement
Lupin
1. Analyst ownership of the stock
No
2. Angel and its Group companies ownership of the stock
No
3. Angel and its Group companies' Directors ownership of the stock
No
4. Broking relationship with company covered
No
Note: We have not considered any Exposure below ` 1 lakh for Angel, its Group companies and Directors
Ratings (Based on expected returns
Buy (> 15%)
Accumulate (5% to 15%)
Neutral (-5 to 5%)
over 12 months investment period):
Reduce (-5% to -15%)
Sell (< -15)
November 10, 2015
13