2QFY2016 Result Update | Infrastructure
November 2, 2015
Larsen & Toubro
BUY
CMP
`1,411
Performance Highlights
Target Price
`1,646
Quarterly highlights - Standalone
Investment Period
12 Months
Y/E March (` cr)
2QFY16 1QFY16 2QFY15
% chg (yoy)
% chg (qoq)
Net sales
13,234
10,710
12,717
4.1
23.6
EBITDA
1,012
975
1,341
(24.5)
3.9
Stock Info
Adj. PAT
643
701
1,042
(38.3)
(8.3)
Sector
Infrastructure
Source: Company, Angel Research
Market Cap (` cr)
131,330
Standalone numbers disappoint: For 2QFY2016, Larsen & Toubro (L&T) reported
a 4.1% yoy increase in its standalone top-line to `13,234cr. The revenue growth
Net debt (` cr)
11,421
was subdued, reflecting revenue de-growth across Metallurgical and Material
Beta
1.2
Handling (MMH) and Heavy Engineering (HE) segments. The EBITDA margin for
52 Week High / Low
1,893/1,400
the quarter is down 290bp yoy to 7.6%, on account of surge in Sales, Administrative
Avg. Daily Volume
220,592
and Other (SAO) and operating expenses. On adjusting for the gains from stake
Face Value (`)
2
sale in a subsidiary, L&T reported an adj. PAT of `643cr, down 38.3% yoy. Such de-
growth in yoy PAT is partly on account of higher interest expenses.
BSE Sensex
26,656
Order inflows for the consolidated entity declined 24.8% yoy to `54,996cr, in
Nifty
8,066
1HFY2016. L&T’s order backlog as of 2QFY2016 end stands at `2,44,097cr,
Reuters Code
LART.BO
thereby giving revenue visibility for over the next 30 months.
Bloomberg Code
LT@IN
Hydrocarbon reports minimal losses: Despite weak execution across the
international business, the Hydrocarbon business reported a revenue of `1,961cr in
Shareholding Pattern (%)
2QFY2016 while the segment’s EBIT level loss was negligible, at `2cr, vs a loss of `54cr in
2QFY2015. On the whole, this segment ended 1HFY2016 with EBIT level profit of `37cr.
Promoters
-
MF / Banks / Indian Fls
37.1
Key Positives: Negligible losses from the Hydrocarbon segment (indicating turn-
around in sight); positive Management commentary on the award outlook front;
FII / NRIs / OCBs
18.2
favorable net WC cycle at 24% of sales.
Indian Public / Others
44.7
Key Negatives: Lowering of order inflow and revenue guidance for FY2016 at the
backdrop of lower order inflows and revenue growth in 1HFY2016.
Abs. (%)
3m
1yr
3yr
Outlook and valuation: L&T’s diversified presence, and an anticipated recovery in
Sensex
(5.2)
(4.3)
43.6
the capex cycle coupled with the company’s strong balance sheet comfort us that
LT
(21.1)
(14.9)
29.8
it is well positioned to benefit from a revival in the award activity environment.
With order backlog expected to grow, execution should pick-up gradually. We
have valued the company using the sum-of-the-parts (SoTP) methodology, to
3-year price chart
capture the value of all its businesses and investments. Ascribing separate values
2,000
to its parent business (on a P/E basis) and investments in subsidiaries (using P/E,
1,500
P/BV and M-cap basis), we arrive at FY2017E based target price of `1,646. We
1,000
are of the view that L&T is a good proxy play for investors wanting to ride on the
revival of the Indian infrastructure growth story. Given 16.6% upside potential in
500
the stock from current levels, we maintain our BUY rating on the stock.
0
Key financials (Standalone)
Y/E March (` cr)
FY13
FY14
FY15E
FY16E
FY17E
Net Sales
51,611
56,599
57,017
65,065
77,009
Source: Company, Angel Research
% chg
9.7
0.7
14.1
18.4
Net Profit
4,385
5,493
5,056
5,337
6,530
% chg
25.3
(8.0)
5.6
22.3
EBITDA (%)
10.6
11.8
11.4
11.5
11.7
EPS (`)
53
59
54
57
70
P/E (x)
33.8
30.3
33.1
31.5
25.7
P/BV (x)
1.9
1.7
1.4
1.2
1.1
RoE (%)
14.2
15.6
13.3
13.7
15.1
RoCE (%)
17.5
18.7
16.3
16.8
18.2
Yellapu Santosh
EV/Sales (x)
3.0
3.1
3.1
2.7
2.3
022 - 3935 7800 Ext: 6811
EV/EBITDA (x)
28.6
26.3
27.4
23.9
19.9
Source: Company, Angel Research; Note: CMP as of October 30, 2015
Please refer to important disclosures at the end of this report
1
Larsen & Toubro | 2QFY2016 Result Update
Exhibit 1: Quarterly Performance (Standalone)
Particulars (` cr)
2QFY16
1QFY16
% chg (qoq)
2QFY15
% chg (yoy)
1HFY16
1HFY15
% chg
Net Sales
13,234
10,710
23.6
12,717
4.1
23,944
23,054
3.9
Total Expenditure
12,222
9,736
25.5
11,376
7.4
21,957
20,626
6.5
Operating Expenses
10,372
8,214
26.3
9,721
6.7
18,586
17,664
5.2
Employee benefits Expense
1,254
989
26.9
1,274
(1.6)
2,243
2,177
3.0
Sales, Admin & Other Expenses
596
533
11.8
381
56.5
1,129
785
43.8
EBITDA
1,012
975
3.9
1,341
(24.5)
1,987
2,429
(18.2)
EBIDTA %
7.6
9.1
10.5
8.3
10.5
Depreciation
254
246
3.0
238
6.7
500
499
0.3
EBIT
759
728
4.2
1,104
(31.2)
1,487
1,930
(23.0)
Interest and Financial Charges
383
287
33.5
313
22.7
671
585
14.7
Other Income
487
553
(11.9)
603
(19.2)
1,041
1,091
(4.6)
PBT before Exceptional Items
863
995
(13.2)
1,394
(38.1)
1,857
2,437
(23.8)
Exceptional Items
(546)
0
0
(546)
(171)
PBT after Exceptional Items
1,409
995
41.6
1,394
1.0
2,403
2,608
(7.9)
Tax
220
294
(25.0)
352
(37.5)
514
673
(23.6)
% of PBT
15.6
29.5
25.3
21.4
25.8
PAT
1,188
701
69.5
1,042
14.0
1,889
1,936
(2.4)
Adj. PAT (for excep. Items)
643
701
(8.3)
1,042
(38.3)
1,344
1,764
(23.8)
Adj. PAT %
4.9
6.5
8.2
5.6
7.7
Dil. EPS
12.71
7.49
69.7
11.16
13.9
20.20
20.73
(2.6)
Source: Company, Angel Research
Standalone business
Revenues grew 4.1% yoy in 2QFY2016
L&T reported a 4.1%/23.6% yoy/qoq increase in its top-line to `13,234cr, for the
quarter. Reported revenues were below our expectation of `13,550cr. Revenue
growth on a yoy basis reflects (1) 3.9% increase in Infrastructure, 32.1% increase
in Power and
5.4% increase in Electrical & Automation segments and
(2) de-growth across MMH (17.1%) and HE (29.5%) segment revenues.
November 2, 2015
2
Larsen & Toubro | 2QFY2016 Result Update
Exhibit 2: Segment-wise Gross Revenue Split (Standalone)
Particulars (` cr)
2QFY16
1QFY16
% chg (qoq)
2QFY15
% chg (yoy)
1HFY16
1HFY15
% chg
Infrastructure
9,241
7,201
28.3
8,899
3.9
16,442
15,654
5.0
Power
1,352
1,091
23.9
1,023
32.1
2,443
1,959
24.7
Metallurgical & Material Handling
646
528
22.4
779
(17.1)
1,174
1,682
(30.2)
Heavy Engineering
568
596
(4.7)
805
(29.5)
1,163
1,612
(27.8)
Electrical & Automation
1,038
869
19.4
984
5.4
1,907
1,754
8.7
Others
833
752
10.6
583
42.8
1,585
1,055
50.2
Less: Inter-segment Revenues
289
186
55.2
232
24.6
475
429
10.9
Gross Segmental Revenues
13,388
10,851
23.4
12,841
4.3
24,239
23,287
4.1
Source: Company, Angel Research
Exhibit 3: Segment-wise Unadj. EBIT & EBIT Margins (Standalone)
Particulars (` cr)
2QFY16
1QFY16
% chg (qoq) 2QFY15
% chg (yoy) 1HFY16
1HFY15
% chg
Infrastructure
703
744
(5.6)
899
(21.8)
1,447
1,548
(6.5)
EBIT Margin (%)
7.6
10.3
10.1
8.8
9.9
Power
82
20
304.1
49
68.5
103
84
22.5
EBIT Margin (%)
6.1
1.9
4.8
4.2
4.3
Metallurgical & Material Handling
7
(22.8)
(132.0)
53
(86.2)
(15.5)
141
(111.0)
EBIT Margin (%)
1.1
(4.3)
6.8
(1.3)
8.4
Heavy Engineering
(88)
40
(319.2)
88
(199.4)
(47.8)
161
(129.6)
EBIT Margin (%)
(15.5)
6.7
11.0
(4.1)
10.0
Electrical & Automation
103
97
6.4
118
(12.2)
201
181
10.7
EBIT Margin (%)
10.0
11.2
12.0
10.5
10.3
Others
162
155
4.1
101
59.7
317
201
57.4
EBIT Margin (%)
19.4
20.6
17.4
20.0
19.1
Segmental EBIT (unadj.)
969
1,034
(6.2)
1,308
(25.9)
2,003
2,317
(13.5)
Source: Company, Angel Research
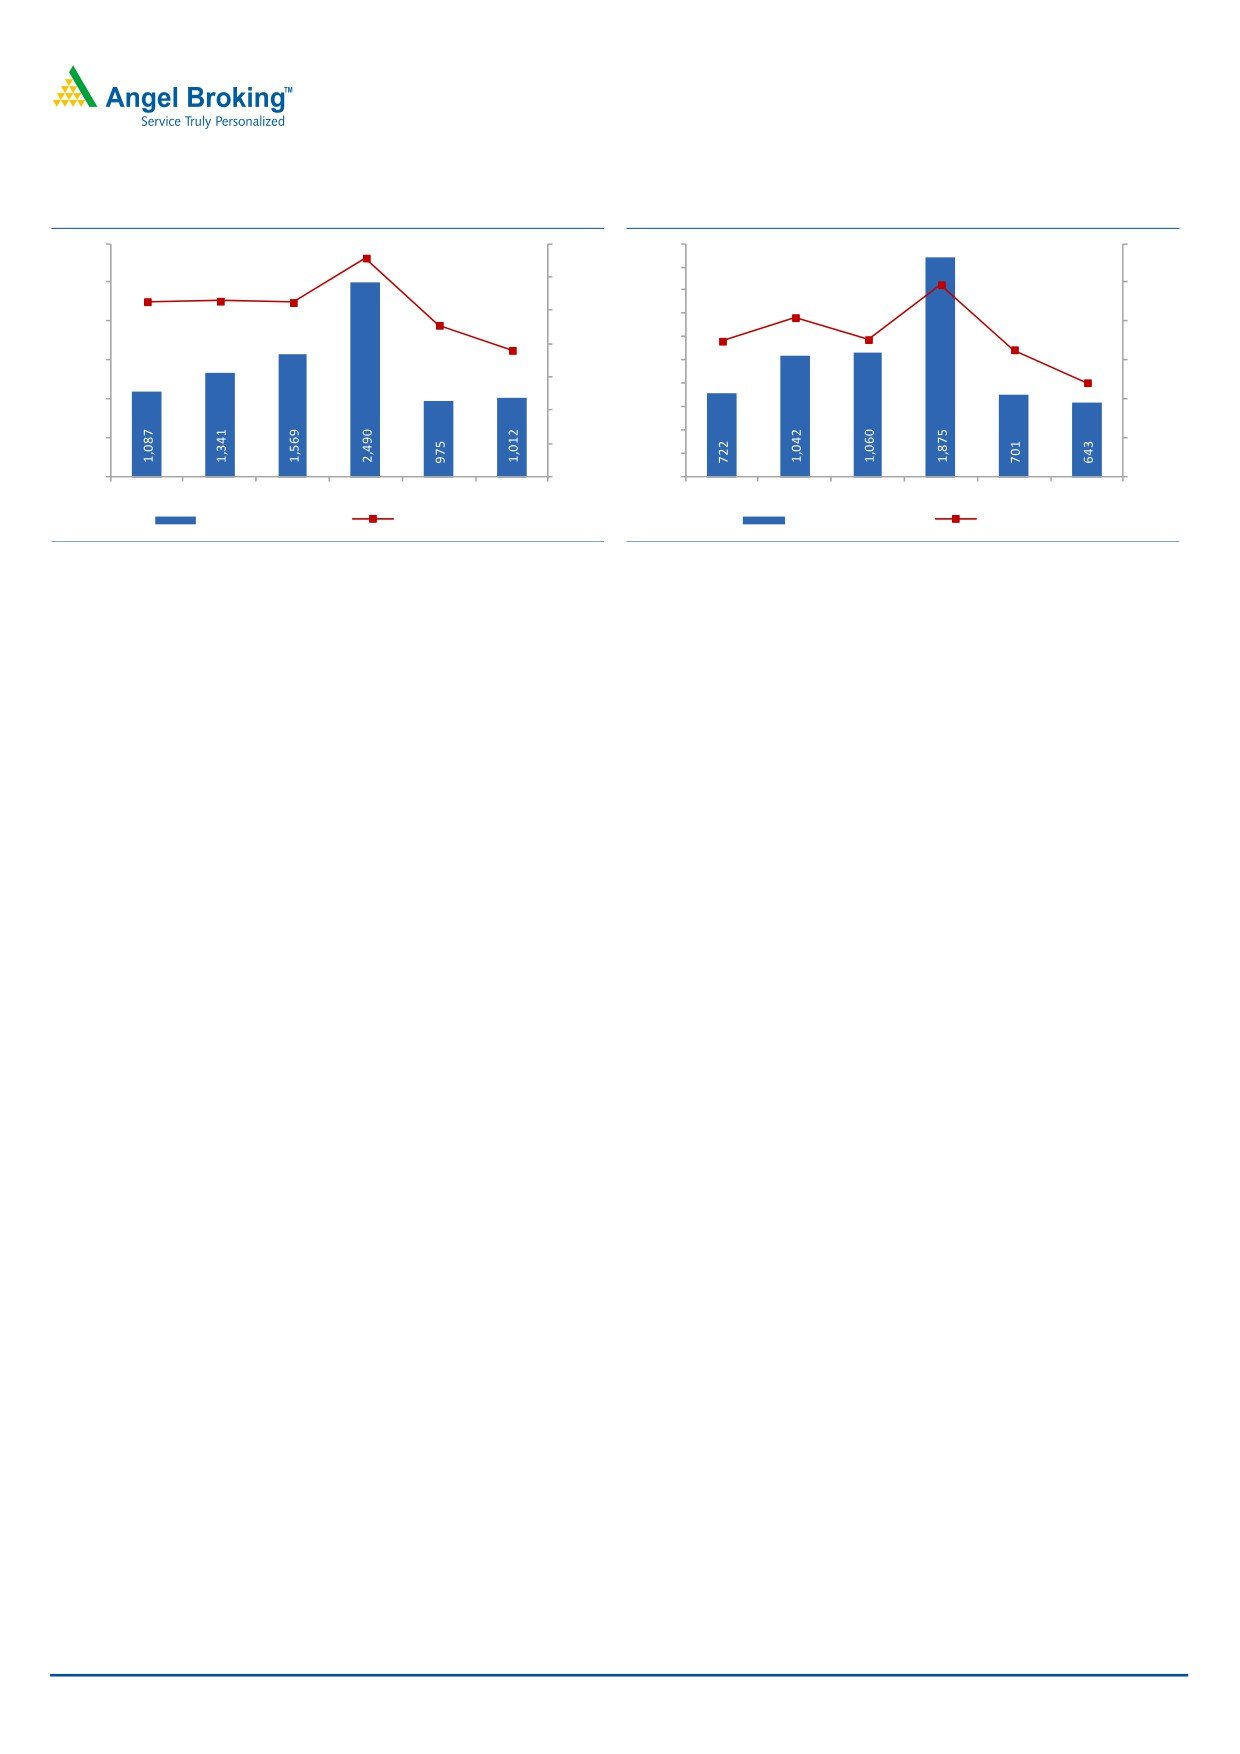
EBITDA margin continues to be under pressure
L&T reported an EBITDA of `1,012cr, lower than our estimate of `1,396cr.
Reported EBITDA margin for the quarter was down 290bps yoy to 7.6%, making it
the second consecutive quarter of a yoy EBITDA margin decline. Muted top-line
growth coupled with (a) 6.7% yoy increase in operating expenses (to `10,372cr),
and (b) 56.5% yoy increase in SAO expenses (to `596cr) led to a yoy decline in the
EBITDA margins.
At the segmental level, EBIT margin pressure, on a yoy basis, was seen across
Infrastructure (down 250bps to 7.6%), and Electrical & Automation (down 200bps
to 10.0%) segments. The Heavy Engineering segment reported a EBIT level loss of
`88cr. Margin compression in the Infrastructure segment is on account of shift in
the job mix.
November 2, 2015
3
Larsen & Toubro | 2QFY2016 Result Update
Exhibit 4: EBITDA margin declines to 7.6%
Exhibit 5: Adj. PAT margin dips below 5.0% levels
3,000
13.1
14.0
2,000
12.0
1,800
9.9
2,500
10.5
10.5
10.5
12.0
10.0
1,600
8.2
9.1
10.0
1,400
2,000
7.0
7.1
8.0
7.6
6.5
1,200
8.0
1,500
1,000
4.9
6.0
6.0
800
1,000
4.0
4.0
600
400
500
2.0
2.0
200
0
0.0
0
0.0
1QFY15
2QFY15
3QFY15
4QFY15
1QFY16
2QFY16
1QFY15
2QFY15
3QFY15
4QFY15
1QFY16
2QFY16
EBITDA (`cr, LHS)
EBITDAM (%, RHS)
PAT (` cr, LHS)
PATM (%, RHS)
Source: Company, Angel Research
Source: Company, Angel Research
Adj. PAT numbers report yoy decline
L&T reported a PAT of `1,188cr, ahead of our estimate of `1,084cr. On adjusting
for gains on divestment of part stake in a subsidiary company and stake in an
associate company (at `546cr), the Adjusted PAT of the company stood at `643cr.
Adj. PAT margins of the company declined from 8.2% a year ago to 4.9% in
2QFY2016. Decline in yoy PAT (adj. for exceptional items) is on account of decline
in EBITDA and 22.7% increase in interest expenses (to `383cr). PAT numbers were
also impacted due to 19.2% yoy decline in other income to `487cr.
Consolidated business
Revenue grew 10.6% yoy in 2QFY2016
L&T reported a 10.6% yoy and 15.5% qoq growth in its consolidated business’ top-
line to `23,393cr. Revenue growth on a yoy basis was owing to strong execution
seen across Infrastructure (13.3% increase to `11,145cr), Power (20.7% increase
to `1,406cr) and IT & Technology Services (23.5% increase to `2,317cr) segments.
Strong revenue growth across the 3 abovementioned segments was, to an extent,
offset by lower order book and weak execution across MMH (de-grew 16.8% to
`667cr) and HE segments (de-grew 26.7% to `648cr).
November 2, 2015
4
Larsen & Toubro | 2QFY2016 Result Update
Exhibit 6: Quarterly Performance (Consolidated)
Particulars (` cr)
2QFY16
1QFY16
% chg (qoq)
2QFY15
% chg (yoy)
1HFY16
1HFY15
% chg
Net Sales
23,393
20,252
15.5
21,159
10.6
43,645
40,134
8.7
Total Expenditure
20,802
17,962
15.8
18,825
10.5
38,764
35,293
9.8
Man. Cons. & Opex Exp. (MCO)
16,996
14,497
17.2
15,369
10.6
31,476
28,695
9.7
Employee benefits Expense
2,433
2,084
16.7
2,262
7.6
4,532
4,020
12.7
Sales, Admin & Other Expenses
1,372
1,381
(0.6)
1,194
14.9
2,755
2,578
6.9
EBITDA
2,592
2,290
13.2
2,334
11.0
4,882
4,841
0.8
EBIDTA %
11.1
11.3
11.0
11.2
12.1
Depreciation
694
622
11.5
549
26.5
1,316
1,356
(3.0)
EBIT
1,898
1,668
13.8
1,786
6.3
3,566
3,485
2.3
Interest and Financial Charges
828
707
17.1
691
19.9
1,535
1,461
5.1
Other Income
219
257
(14.9)
215
2.1
476
492
(3.1)
PBT before Exceptional Items
1,289
1,219
5.8
1,310
(1.6)
2,508
2,516
(0.3)
Exceptional Items
(310)
0
0
(310)
(249)
PBT after Exceptional Items
1,599
1,219
31.2
1,310
22.1
2,818
2,765
1.9
Tax
494
546
(9.6)
469
5.2
1,039
918
13.2
% of PBT
30.9
44.8
35.8
36.9
33.2
PAT before Minority Int.
1,105
673
64.3
841
31.5
1,778
1,847
(3.7)
Extra-Ordinary Items
0
0
0
0
0
Share in profit of Associates (net)
(1)
2
1
1
2
Adj. of Minority Interests
(109)
(69)
21
(177)
(21)
PAT after Minority Interest
996
606
64.3
862
15.6
1,602
1,829
(12.4)
Adj. PAT (for excep. Items)
686
606
13.2
862
(20.4)
1,293
1,579
(18.2)
Adj. PAT %
2.9
3.0
4.1
3.0
3.9
Dil. EPS
10.65
6.48
64.4
9.23
15.4
17.13
19.58
(12.5)
Source: Company, Angel Research
EBITDA margin declines slightly yoy to 11.1%
L&T reported a 5bps yoy expansion in the EBITDA margin in 2QFY2016 to 11.1%.
The muted expansion in yoy margins reflects
(1)
7.6% increase in employee
expenses to `2,433cr and (2) 14.9% increase in SAO expenses to `1,372cr. Surge
in employee expenses is on account of manpower augmentation, normal revisions
and higher staff mix from the international operations. Increase in yoy SAO
expenses is attributable to higher business development expenses and warranty
provisions.
Further, if we look at segment-wise details, then yoy margins were impacted due to
margin compression seen across Infrastructure, Electrical Automation, and Others
segments, while HE and Hydrocarbon businesses reported segment level losses for
the quarter.
Adj. PAT margin continues to report yoy decline
L&T reported a PAT of `996cr for 2QFY2016. On adjusting `310cr towards an
exceptional item (gain on divestment of part stake in a subsidiary company and
stake sale in an associate company), the adjusted PAT would stand at `686cr. Adj.
November 2, 2015
5
Larsen & Toubro | 2QFY2016 Result Update
PAT margins of the company were at 2.9%, lower the 4.1% in the corresponding
quarter of the previous year. Despite yoy EBITDA growth, higher interest and
depreciation expenses led to a 20.4% yoy decline in adj. PAT. A 26.5% increase in
yoy depreciation expenses is attributable to abiding with the related revision in the
Companies Act and operationalization of 3 Road BOT SPVs. A 19.9% yoy increase
in interest expenses is attributable to decline in g-sec rates (leading to increase in
pension costs by `50cr) and operationalization of 3 Road BOT SPVs.
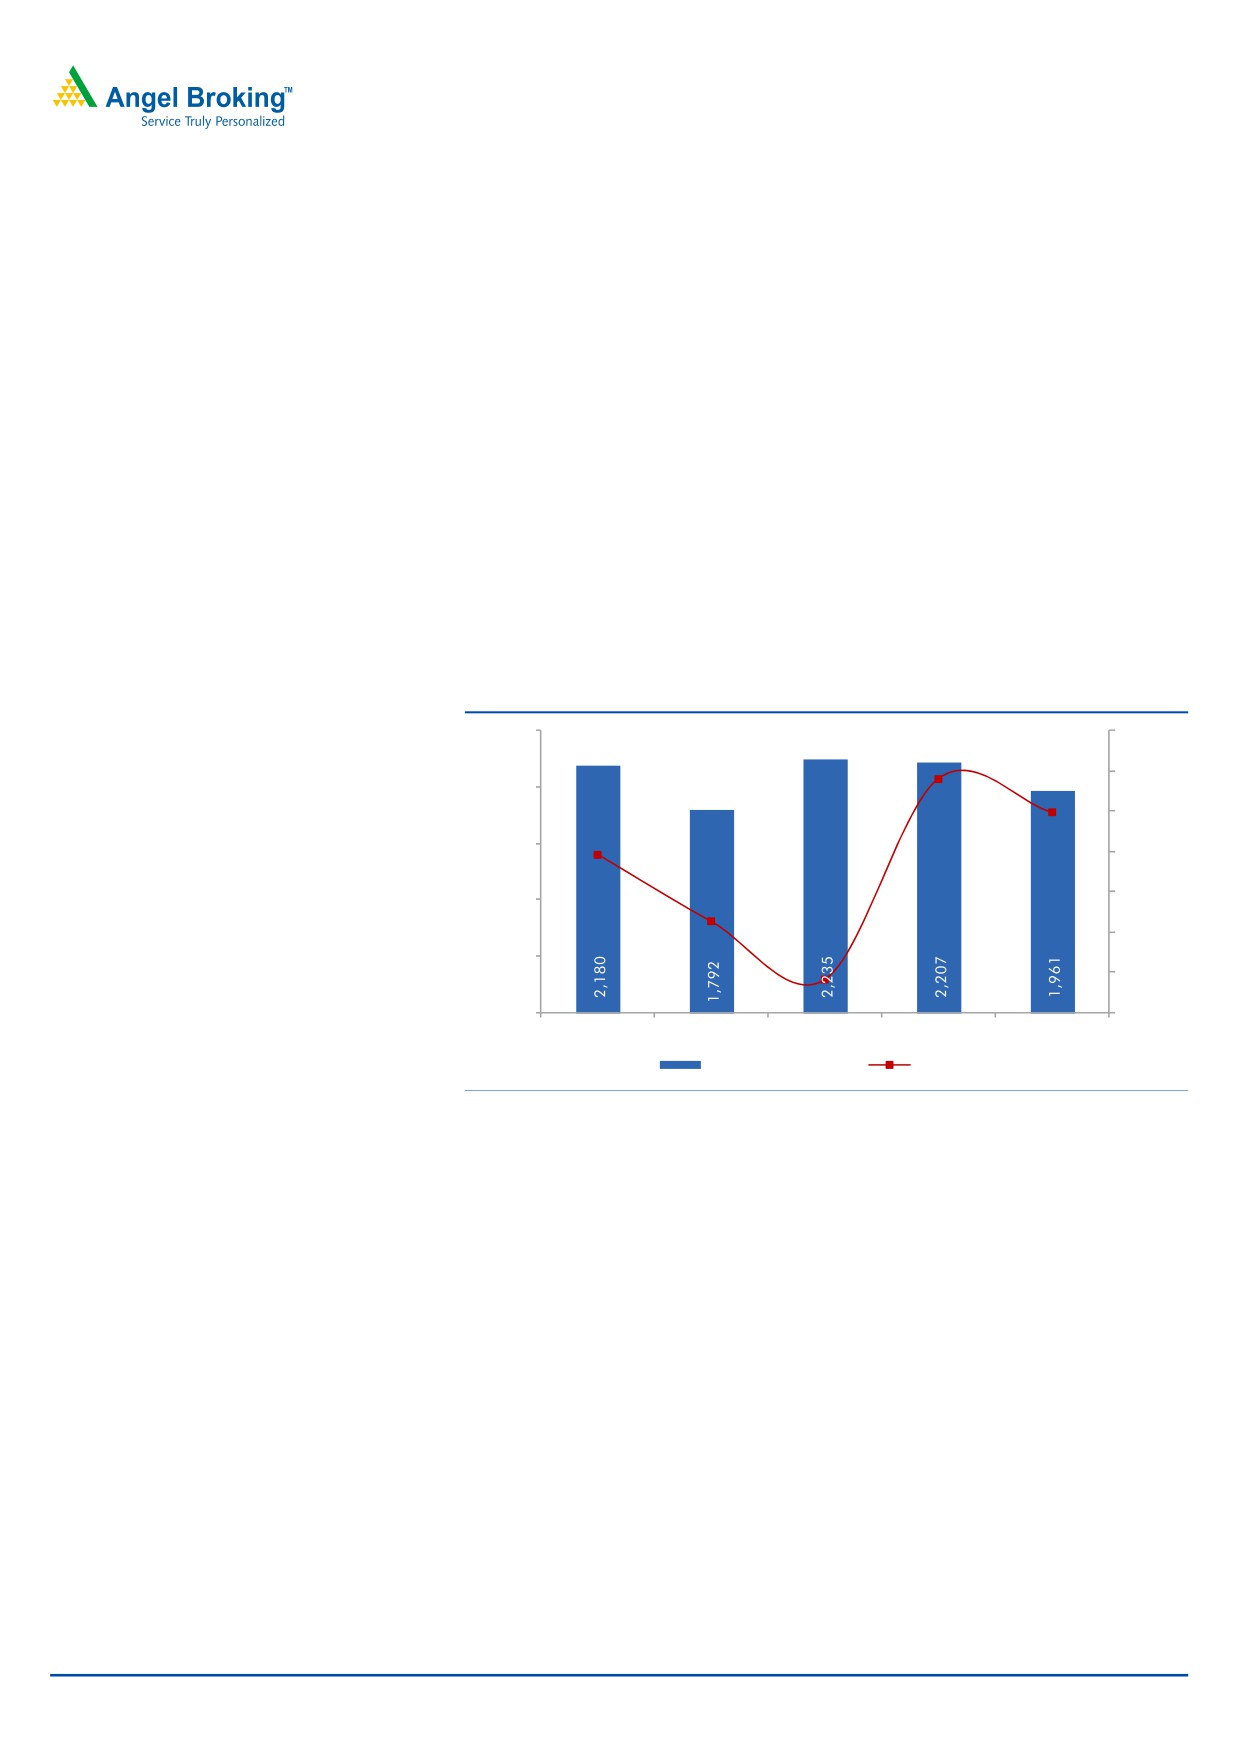
Hydrocarbon business recovery in sight
After reporting a turn-around in 1QFY2016, the Hydrocarbon business reported a
negligible EBIT loss of `2cr in 2QFY2016 (lower than `54cr of losses in the
corresponding previous year quarter).
At the backdrop of strong execution across domestic hydrocarbon projects, the
Hydrocarbon subsidiary reported revenues of `1,961cr, for the quarter.
Exhibit 7: Hydrocarbon - Quarterly Revenues & EBIT
2,500
100
40
(2)
50
2,000
(54)
(137)
0
1,500
(50)
(209)
(100)
1,000
(150)
500
(200)
0
(250)
2QFY15
3QFY15
4QFY15
1QFY16
2QFY16
Revenue (` cr, LHS)
EBIT (` cr, RHS)
Source: Company, Angel Research
During the quarter, the Hydrocarbon business reported a negative EBIT of `2cr vs
a negative EBIT of `54cr in 2QFY2015. EBIT level losses reflect underrecovery of
overheads across the Middle East projects, where L&T has built its localized
organization base in the last few quarters. The Management highlighted that
legacy order works are nearing completion and from 4QFY2016 the
Hydrocarbons business should see margin expansion.
IT & Technology Services business reports strong growth
L&T’s IT & Technology Services business reported an impressive 23.5% yoy
increase in revenues for the quarter to `2,317cr. Top-line growth was driven
across all the end-markets across sectors except energy and utility segment. On the
profitability front, the subsidiary’s EBIT margin was up 286bp yoy to 18.3%.
November 2, 2015
6
Larsen & Toubro | 2QFY2016 Result Update
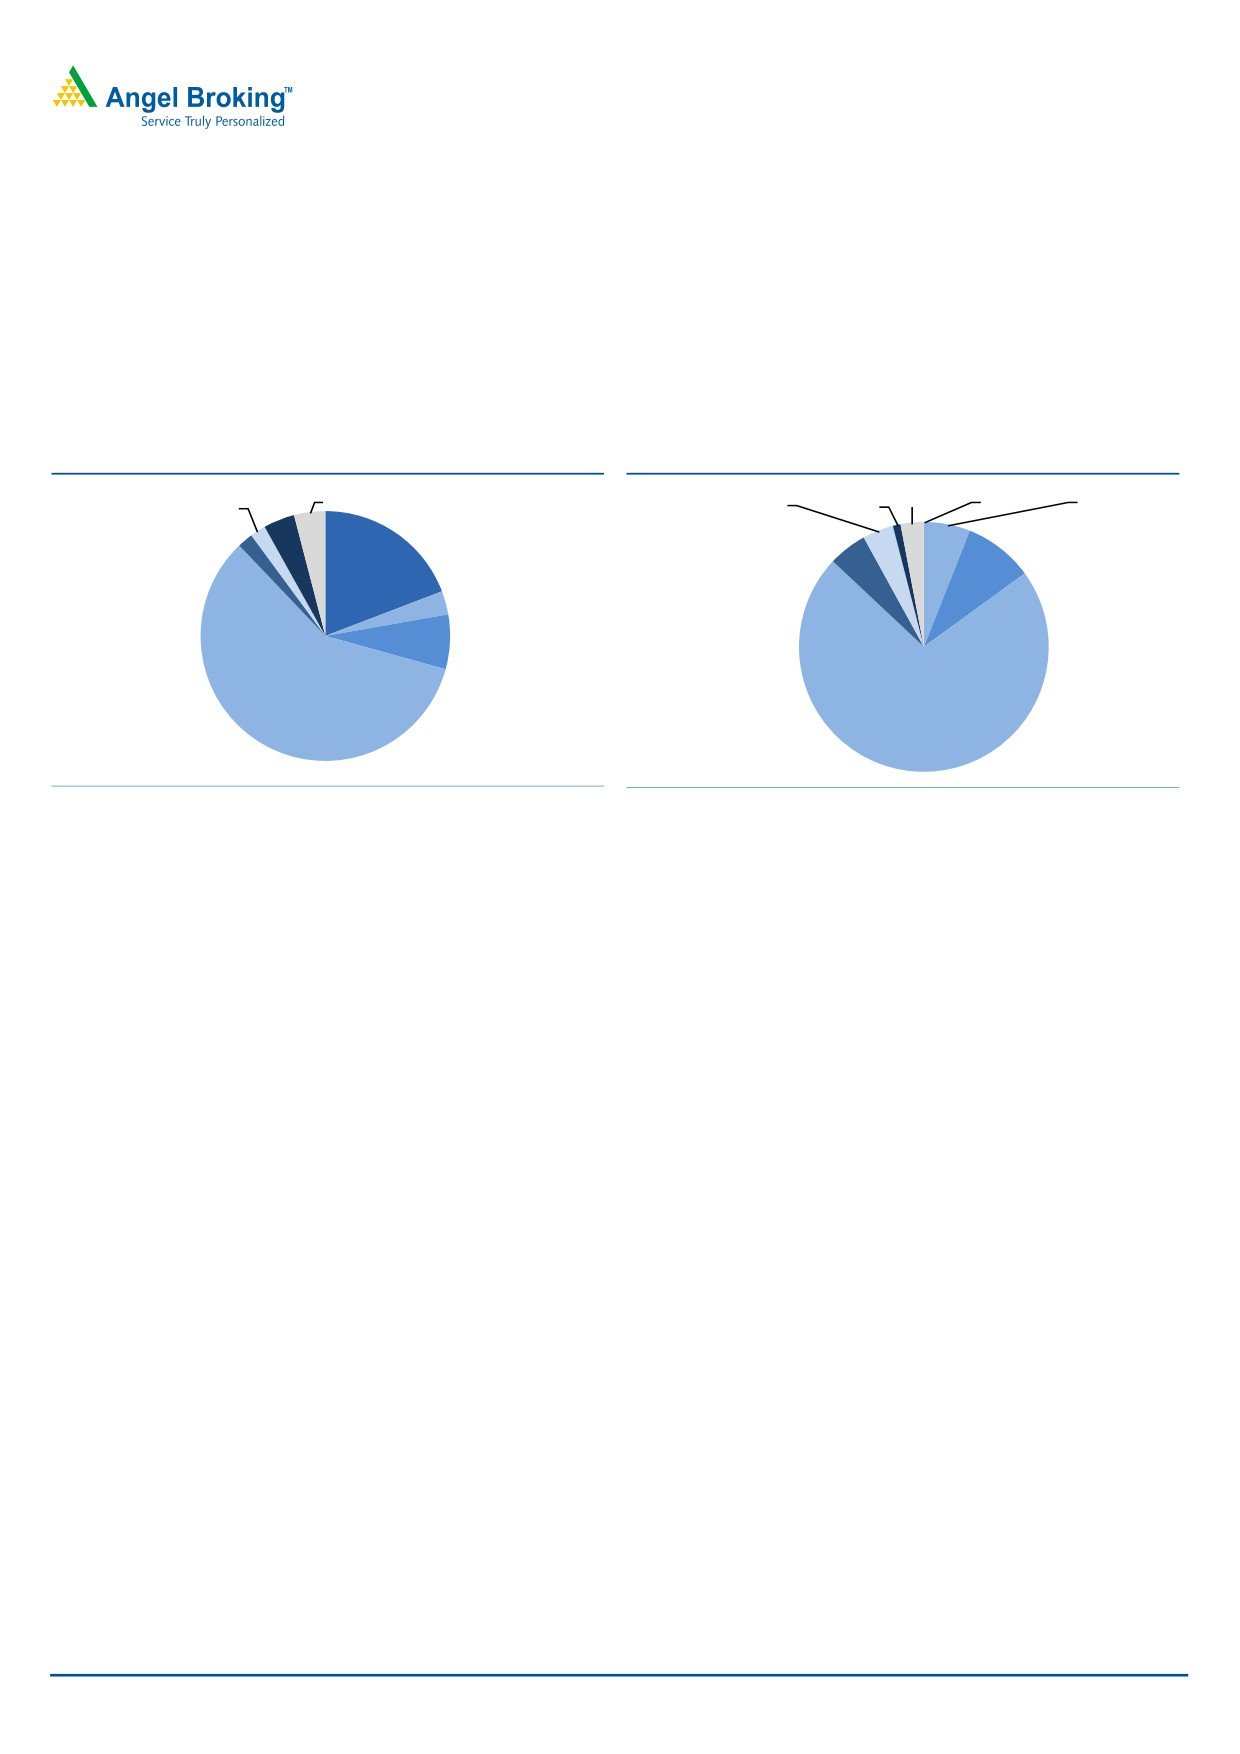
Order Inflow growth disappoints
The consolidated order inflow for the quarter declined 28.0% yoy to `28,620cr (on
excluding Services business’ orders, the order inflow reported a 34.9% yoy
decline). A major 62% of 2QFY2016 order inflows were from the domestic
markets.
On the whole, order inflows for 1HFY2016 declined 24.8% yoy to `54,996cr.
Exhibit 8: 2QFY16 Order Inflow mix (consol.)
Exhibit 9: 2QFY16 Order Book mix (consol.)
Others, 4%
Services, 0% Hydrocarbon,
HE, 2% EA, 4%
HE, 4%
EA, 1%Others, 3%
6%
MMH, 2%
MMH, 5%
Power,
Services, 19%
9%
Hydrocarbon,
3%
Power, 7%
Infrastructure,
58%
Infrastructure,
72%
Source: Company, Angel Research
Source: Company, Angel Research
L&T’s order book as of 2QFY2016-end stands at `2,44,097cr, indicating a 13.9%
yoy growth. As of 2QFY2016, L&T’s order book is majorly dominated by the Infra
(72%) segment, followed by Power (9%) and Hydrocarbon (6%) segments. MMH
(5%), HE (4%) and Others (3%) constitute the remaining order book. International
order book constitutes 28% of the total order book. The current order book gives
revenue visibility for over the next 30 months.
At the backdrop of lower than expected 1HFY2016 order inflows and reduced bid
pipeline of `3,70,000cr (of this `1,00,000cr is from the international markets)
from the earlier `5,00,000cr, the company’s Management has lowered its order
inflow growth guidance from the earlier 15% to 5-7% for FY2016. Given the
Management commentary that 2HFY2016 could see some large ticket awarding
activity, we are optimistic that L&T could attain its order inflow growth guidance of
5-7% for FY2016.
November 2, 2015
7
Larsen & Toubro | 2QFY2016 Result Update
Management guidance
The Management has lowered its order inflow growth guidance for FY2016
from the earlier 15% to 5-7%. At the backdrop of revival in award activity,
large projects coming-up for awarding, and L&T’s positioning, we are
optimistic that it would attain its order inflow growth guidance for FY2016.
Given the 8.7% yoy growth in the top-line for 1HFY2016, L&T’s Management
has lowered its revenue growth guidance from the earlier 15% to a 10-15%
range for FY2016. Considering the 13.9% yoy increase in its 2QFY2016 order
book, coupled with zero slow moving orders, we are comforted that execution
should catch-up in 2HFY2016.
The company’s Management has maintained its guidance of a 100bp swing
in margin in FY2016. With just 3 international legacy projects’ execution
pending in the Hydrocarbon space, and considering the segment’s EBIT level
profit of `37cr in 1HFY2016, there exists a strong case for a turnaround of the
Hydrocarbons vertical.
Revision of Estimates
Considering the slowdown witnessed in order inflow numbers, and lower-than-
expected revenue booking, we revise down our top-line and PAT estimates. We
now expect L&T (standalone entity) to report a PAT of `5,776cr and `6,155cr for
FY2016 and FY2017, respectively.
Exhibit 10: Revised estimates
FY2016E
FY2017E
Particulars (` cr)
Old
New
% chg.
Old
New
% chg.
Net Sales
65,065
64,148
(1.4)
77,009
73,241
(4.9)
EBITDA
7,483
7,377
(1.4)
9,010
8,569
(4.9)
EBITDA Margins (%)
11.5
11.5
11.7
11.7
Rep. PAT
5,337
5,776
8.2
6,530
6,155
(5.7)
Rep. PAT Margins (%)
8.2
9.0
8.5
8.4
Source: Company, Angel Research
Valuation
We recommend BUY with a target price of `1,646
We believe L&T has a good case to beat its revised order inflow guidance and also
attain its revenue growth guidance for FY2016. Also, on considering 1HFY2016
results for the Hydrocarbon vertical, we expect a possible turn-around in the
segment in FY2016. On the whole, L&T with its diverse business profile (E&C,
Power, Alternate Energy, Roads & Highways, Defense, Metros, Urban Infra), is well
positioned to benefit from a revival in the domestic infra capex cycle.
November 2, 2015
8
Larsen & Toubro | 2QFY2016 Result Update
Exhibit 11: Derivation of SOTP-based target price for L&T (FY2017E)
Business Segment
Methodology
Remarks
` cr
`/share
% to TP
L&T- Parent
P/E
18.0x FY2017E Earnings
110,793
1,172
71.2
Infrastructure Subsidiaries
IDPL
P/BV
1.0x FY2017E BV
7,422
79
4.8
Key Subsidiaries - Services
L&T InfoTech
P/E
15.0x FY2017E Earnings
16,574
175
10.7
L&T Finance
M-cap Basis
20% holding company discount
7,667
81
4.9
Realty Space
L&T Realty (inc. Seawoods Realty)
P/BV
1.0x FY2017E BV
3,180
34
2.1
Hydro-Carbons Business
Hydro-Carbons
P/BV
1.0x FY2017E BV
1,310
14
0.9
Key Subsidiaries - Manufacturing
L&T Power-equipment JVs
P/BV
1.0x FY2017E BV
698
7
0.5
Other Associate Companies
P/BV
1.0x FY2017E BV
5,420
58
3.5
International Business
International Subsidiaries
P/BV
1.5x FY2017E BV
2,322
25
1.5
Grand Total
108,360
1,646
100
Upside
16.6%
CMP
1,411
Source: Company, Angel Research
We have valued the company using sum-of-the-parts (SOTP) methodology, to
capture the value of all its businesses and investments. Ascribing separate values to
its parent business on a P/E basis and investments in subsidiaries (using P/E, P/BV
and M-cap basis), we arrive at a FY2017E based target price of `1,646. At the
current market price of `1,411, the standalone entity is trading at an implied P/E
multiple of 14x (FY2017), which is attractive. We are of the view that L&T is a proxy
play for investors wanting to play on the revival in the Indian Infrastructure growth
story. Given the 16.6% upside potential in the stock from current levels, we
maintain our BUY rating on the stock.
Investment arguments
Indian capex recovery is a matter of time: Recent burst of policy measures
would ease environment for capex. This, along with recent rate cuts, makes us
believe that a strong recovery is on the cards. Considering that the award
activity revival should further gain momentum, we sense that a full-fledged
recovery will be seen only in FY2017, but we can expect early signs of
improvement in L&T's execution and margin expansion from 2HFY2016
onwards.
Slowdown in order inflows from the Middle East markets coupled with revival
in domestic capex cycle should lead to a shift in the order inflow mix more
towards the domestic markets, going forward. On the back of shift in order
book towards domestic markets, we expect uptick in execution. Accordingly,
we have modeled a 13.3% top-line CAGR over FY2015-2017E.
November 2, 2015
9
Larsen & Toubro | 2QFY2016 Result Update
Given that L&T is currently sitting on an order book which gives revenue
visibility for over 30 months, this shift in order inflow mix should help the
company in faster margin recovery. We expect EBITDA margins to expand by
32bp during FY2015-17 to 11.7%.
Best stock to play the Indian infrastructure theme: We are of the view that L&T
is very well positioned to benefit from gradual recovery in the domestic capex
cycle, given its diverse range of sectoral exposure, strong balance sheet and
better cash flow generating potential in comparison to its peers, which are
struggling with higher leverage, and strained cash flows.
Company background
L&T, the largest Indian infrastructure conglomerate, is present across almost all the
infrastructure segments and is at the forefront of the Indian infra growth story.
Over the years, the company has diversified across various segments to encash the
untapped infra opportunity, not only in India but in other geographies as well, and
has an excellent track record of achieving the same. Currently, L&T manufactures
and services its business in over 30 countries worldwide.
November 2, 2015
10
Larsen & Toubro | 2QFY2016 Result Update
Profit & loss statement (Standalone)
Y/E March (` cr)
FY13
FY14
FY15
FY16E
FY17E
Net Sales
51,611
56,599
57,017
64,148
73,241
% Chg
9.7
0.7
12.5
14.2
Total Expenditure
46,138
49,932
50,530
56,771
64,672
Raw Mat. & Contracting Exp.
40,205
43,346
44,397
49,651
56,542
Employee benefits Expense
3,861
4,662
4,151
4,811
5,347
Sales, Admin. & Other Exps
2,072
1,923
1,982
2,309
2,783
EBITDA
5,473
6,667
6,488
7,377
8,569
% Chg
22
(3 )
14
16
EBIDTA %
10.6
11.8
11.4
11.5
11.7
Depreciation
728
792
1,008
1,173
1,342
EBIT
4,745
5,875
5,480
6,205
7,227
% Chg
23.8
(6.7)
13.2
16.5
Interest and Financial Charges
955
1,076
1,419
1,516
1,618
Other Income
1,887
1,881
2,283
2,428
2,547
PBT
5,678
6,679
6,344
7,116
8,156
Exceptional Item
(176)
(589)
(357)
(546)
(120)
PBT after Exceptional Item
5,854
7,268
6,701
7,662
8,276
Tax Expenses
1,541
1,775
1,645
1,886
2,120
% of PBT
27.1
26.6
25.9
26.5
26.0
PAT before Extra-Ordinary Items
4,313
5,493
5,056
5,776
6,155
Extra-Ordinary Item
(72)
0
0
0
0
PAT
4,385
5,493
5,056
5,776
6,155
% Chg
25.3
(8.0)
14.2
6.6
PAT %
8.5
9.7
8.9
9.0
8.4
EPS (after Extra-ord. Items)
53
59
54
62
66
% Chg
11.6
(8.3)
13.7
6.6
November 2, 2015
11
Larsen & Toubro | 2QFY2016 Result Update
Balance Sheet (Standalone)
Y/E March (` cr)
FY13
FY14
FY15
FY16E
FY17E
Sources of Funds
Equity Capital
123
185
186
186
186
Reserves Total
29,020
33,476
36,899
40,847
45,111
Networth
29,143
33,662
37,085
41,032
45,297
Total Debt
8,834
11,459
12,937
15,000
16,500
Other Long-term Liabilities
788
393
470
557
569
Deferred Tax Liability
242
410
363
363
363
Total Liabilities
39,007
45,924
50,854
56,952
62,729
Application of Funds
Gross Block
11,855
11,397
12,604
14,554
16,534
Accumulated Depreciation
3,550
3,836
4,844
6,016
7,359
Net Block
8,305
7,561
7,760
8,537
9,175
Capital WIP
597
676
222
250
250
Investments
16,103
19,215
23,053
26,103
28,413
Current Assets
47,419
50,853
55,869
58,596
62,451
Inventories
2,064
1,983
2,208
2,359
2,575
Sundry Debtors
22,613
21,539
23,051
23,876
24,475
Cash and Bank Balance
1,456
1,783
1,516
2,429
3,135
Loans, Advances & Deposits
9,413
10,067
10,533
12,088
13,279
Other Current Asset
11,873
15,481
18,562
17,845
18,987
Current Liabilities
33,417
32,381
36,050
36,534
37,560
Net Current Assets
14,002
18,472
19,820
22,062
24,891
Total Assets
39,007
45,924
50,854
56,952
62,729
Cash Flow Statement (Standalone)
Y/E March (` cr)
FY13
FY14
FY15P
FY16E
FY17E
Profit before tax
5,678
6,679
6,344
7,116
8,156
Depreciation
728
792
1,008
1,173
1,342
Change in Working Capital
(3,703)
(5,029)
(1,579)
(2,643)
(3,870)
Net Interest & Financial Charges
422
581
909
996
1,083
Direct taxes paid
(1,653)
(1,977)
(1,645)
(1,886)
(2,120)
Cash Flow from Operations
1,472
1,047
5,037
4,756
4,590
(Inc)/ Dec in Fixed Assets
(1,000)
(962)
(1,655)
(1,922)
(1,980)
(Inc)/ Dec in Investments
1,657
(252)
(2,345)
(984)
(191)
Cash Flow from Investing
657
(1,214)
(3,999)
(2,905)
(2,171)
Issue/ (Buy Back) of Equity
163
144
0
0
0
Inc./ (Dec.) in Loans
(1,515)
2,612
1,478
2,063
1,500
Dividend Paid (Incl. Tax)
(1,115)
(1,227)
(1,375)
(1,485)
(1,595)
Interest Expenses
(850)
(1,025)
(1,419)
(1,516)
(1,618)
Cash Flow from Financing
(3,316)
504
(1,316)
(938)
(1,713)
Inc/(Dec) in cash (inc. Dis. Opr)
(410)
337
(278)
913
707
Opening Cash balances
1,906
1,496
1,794
1,516
2,429
Closing Cash balances
1,496
1,794
1,516
2,429
3,135
November 2, 2015
12
Larsen & Toubro | 2QFY2016 Result Update
Key Ratios (Standalone)
Y/E March
FY13
FY14
FY15P
FY16E
FY17E
Valuation Ratio (x)
P/E (on FDEPS)
26.7
23.9
26.1
22.9
21.5
P/CEPS
23.5
20.9
21.8
19.1
17.7
Dividend yield (%)
0.0
0.0
0.0
0.0
0.0
EV/Sales
2.4
2.5
2.5
2.2
2.0
EV/EBITDA
22.9
21.0
22.0
19.5
16.9
EV / Total Assets
3.2
3.1
2.8
2.5
2.3
Per Share Data (`)
EPS (fully diluted)
52.9
59.0
54.1
61.5
65.6
Cash EPS
59.9
67.5
64.6
74.0
79.8
DPS
12.0
12.3
13.3
14.4
15.4
Book Value
464
493
542
607
668
Returns (%)
RoCE (Pre-tax)
17.5
18.7
16.3
16.3
16.6
Angel RoIC (Pre-tax)
17.5
17.2
15.5
15.4
15.8
RoE
14.2
15.6
13.3
13.4
14.0
Turnover ratios (x)
Asset Turnover (Gross Block) (X)
4.4
4.9
4.8
4.7
4.7
Inventory / Sales (days)
15
13
13
13
12
Receivables (days)
160
142
143
134
120
Payables (days)
134
122
127
119
103
Leverage Ratios (x)
D/E ratio (x)
0.3
0.3
0.3
0.4
0.4
Interest Coverage Ratio (x)
6.9
7.2
5.5
5.7
6.0
November 2, 2015
13
Larsen & Toubro | 2QFY2016 Result Update
Research Team Tel: 022 - 39357800
DISCLAIMER
Angel Broking Private Limited (hereinafter referred to as “Angel”) is a registered Member of National Stock Exchange of India Limited,
Bombay Stock Exchange Limited and MCX Stock Exchange Limited. It is also registered as a Depository Participant with CDSL and
Portfolio Manager with SEBI. It also has registration with AMFI as a Mutual Fund Distributor. Angel Broking Private Limited is a
registered entity with SEBI for Research Analyst in terms of SEBI (Research Analyst) Regulations, 2014 vide registration number
INH000000164. Angel or its associates has not been debarred/ suspended by SEBI or any other regulatory authority for accessing
/dealing in securities Market. Angel or its associates including its relatives/analyst do not hold any financial interest/beneficial
ownership of more than 1% in the company covered by Analyst. Angel or its associates/analyst has not received any compensation /
managed or co-managed public offering of securities of the company covered by Analyst during the past twelve months. Angel/analyst
has not served as an officer, director or employee of company covered by Analyst and has not been engaged in market making activity
of the company covered by Analyst.
This document is solely for the personal information of the recipient, and must not be singularly used as the basis of any investment
decision. Nothing in this document should be construed as investment or financial advice. Each recipient of this document should
make such investigations as they deem necessary to arrive at an independent evaluation of an investment in the securities of the
companies referred to in this document (including the merits and risks involved), and should consult their own advisors to determine
the merits and risks of such an investment.
Reports based on technical and derivative analysis center on studying charts of a stock's price movement, outstanding positions and
trading volume, as opposed to focusing on a company's fundamentals and, as such, may not match with a report on a company's
fundamentals.
The information in this document has been printed on the basis of publicly available information, internal data and other reliable
sources believed to be true, but we do not represent that it is accurate or complete and it should not be relied on as such, as this
document is for general guidance only. Angel Broking Pvt. Limited or any of its affiliates/ group companies shall not be in any way
responsible for any loss or damage that may arise to any person from any inadvertent error in the information contained in this report.
Angel Broking Pvt. Limited has not independently verified all the information contained within this document. Accordingly, we cannot
testify, nor make any representation or warranty, express or implied, to the accuracy, contents or data contained within this document.
While Angel Broking Pvt. Limited endeavors to update on a reasonable basis the information discussed in this material, there may be
regulatory, compliance, or other reasons that prevent us from doing so.
This document is being supplied to you solely for your information, and its contents, information or data may not be reproduced,
redistributed or passed on, directly or indirectly.
Neither Angel Broking Pvt. Limited, nor its directors, employees or affiliates shall be liable for any loss or damage that may arise from
or in connection with the use of this information.
Note: Please refer to the important ‘Stock Holding Disclosure' report on the Angel website (Research Section). Also, please refer to the
latest update on respective stocks for the disclosure status in respect of those stocks. Angel Broking Pvt. Limited and its affiliates may
have investment positions in the stocks recommended in this report.
Disclosure of Interest Statement
L&T
1. Analyst ownership of the stock
No
2. Angel and its Group companies ownership of the stock
No
3. Angel and its Group companies' Directors ownership of the stock
No
4. Broking relationship with company covered
No
Note: We have not considered any Exposure below ` 1 lakh for Angel, its Group companies and Directors
Ratings (Based on expected returns
Buy (> 15%)
Accumulate (5% to 15%)
Neutral (-5 to 5%)
over 12 months investment period):
Reduce (-5% to -15%)
Sell (< -15)
November 2, 2015
14