Quick take
LT Foods
BUY
CMP
`74
A Royal Daawat for investors
Target Price
`96
LT Foods Limited (LTFL) is a branded speciality foods company engaged in milling,
Investment Period
12 Months
processing and marketing of branded and non-branded basmati rice and
Sector
Food Processing
manufacturing of rice food products in the domestic and overseas markets. Its
Market Cap (` cr)
1,983
geographical segments include India, North America and Rest of the World. The
Net Debt (` cr)
1,565
major brands of the company are Daawat, Gold Seal Indus Valley, Rozana and
Beta
1.0
52 Week High / Low
85/ 21
817 Elephant.
Avg. Daily Volume
1,09,568
Market leadership with strong brand visibility: LTFL’s flagship brand Daawat
Face Value (`)
1
enjoys 22% market share in the branded rice market of India. The company has
BSE Sensex
33,731
strong market share in North America selling Basmati rice under the brand name
Nifty
10,452
‘Royal’. Historically, the company has been focusing on strong brand visibility, and
Reuters Code
LTOL.BO
in order to enhance brand visibility it spends on ad spends.
Bloomberg Code
LTFO.IN
Wide distribution network: Currently LTFL has an access to 1,40,000 traditional
retail outlets and reaches to 93% of towns with over 2 lakh population and 3,000
Shareholding Pattern (%)
wholesalers. Further, the company sells its products to premium hotels &
Promoters
67.2
restaurants (~50% share) and has an access to 6,000 foodservice outlets i.e.
MF / Banks / Indian Fls
1.3
‘DawatChefs Secretz”. Moreover, it has an access to 2,500 modern trade stores
FII / NRIs / OCBs
2.5
including 121 hypermarkets, 298 supermarkets and 1,462 mini markets. It is the
Indian Public / Others
29.1
1st Rice Company to place Brown Basmati Rice in Medical Chains.
Diversified product portfolio catering to varied customers: LTFL has a well-
Abs. (%)
3m
1yr
3yr
diversified product basket, which caters to consumers of all income groups. The
Sensex
4.5%
23%
21%
company is present in segments like Basmati rice, Speciality rice (non-Basmati)
LTFL
6.1%
184%
497.0%
and Other food products. It is also consistently working on adding new products to
its portfolio. LTFL has done JV with Japanese Snack Food major Kameda, which
would launch rice based snacks in India. LTFL has recently introduced ‘Daawat
Rozana GoldPlus’ brand.
Strong global footprint: LT Foods is now an emerging global Foods Company with
a focus on basmati and other speciality rice, organic foods and convenience rice
based products. LT Foods has a global footprint, selling their flagship basmati rice
brands i.e. Royal and Daawat into 65 countries. The company has established on
ground presence in the US, Europe and Middle East in order to unlock the full
potential of these territories.
Outlook and Valuation: Going forward, we expect the company to report healthy
top-line CAGR of 13.5% over the next two years on the back of strong distribution
network & brand, continuous expansion, wide product basket and addition of new
products in portfolio. On the bottom-line front, we expect ~20% CAGR on the
back of robust improvement in operating performance. We expect margin
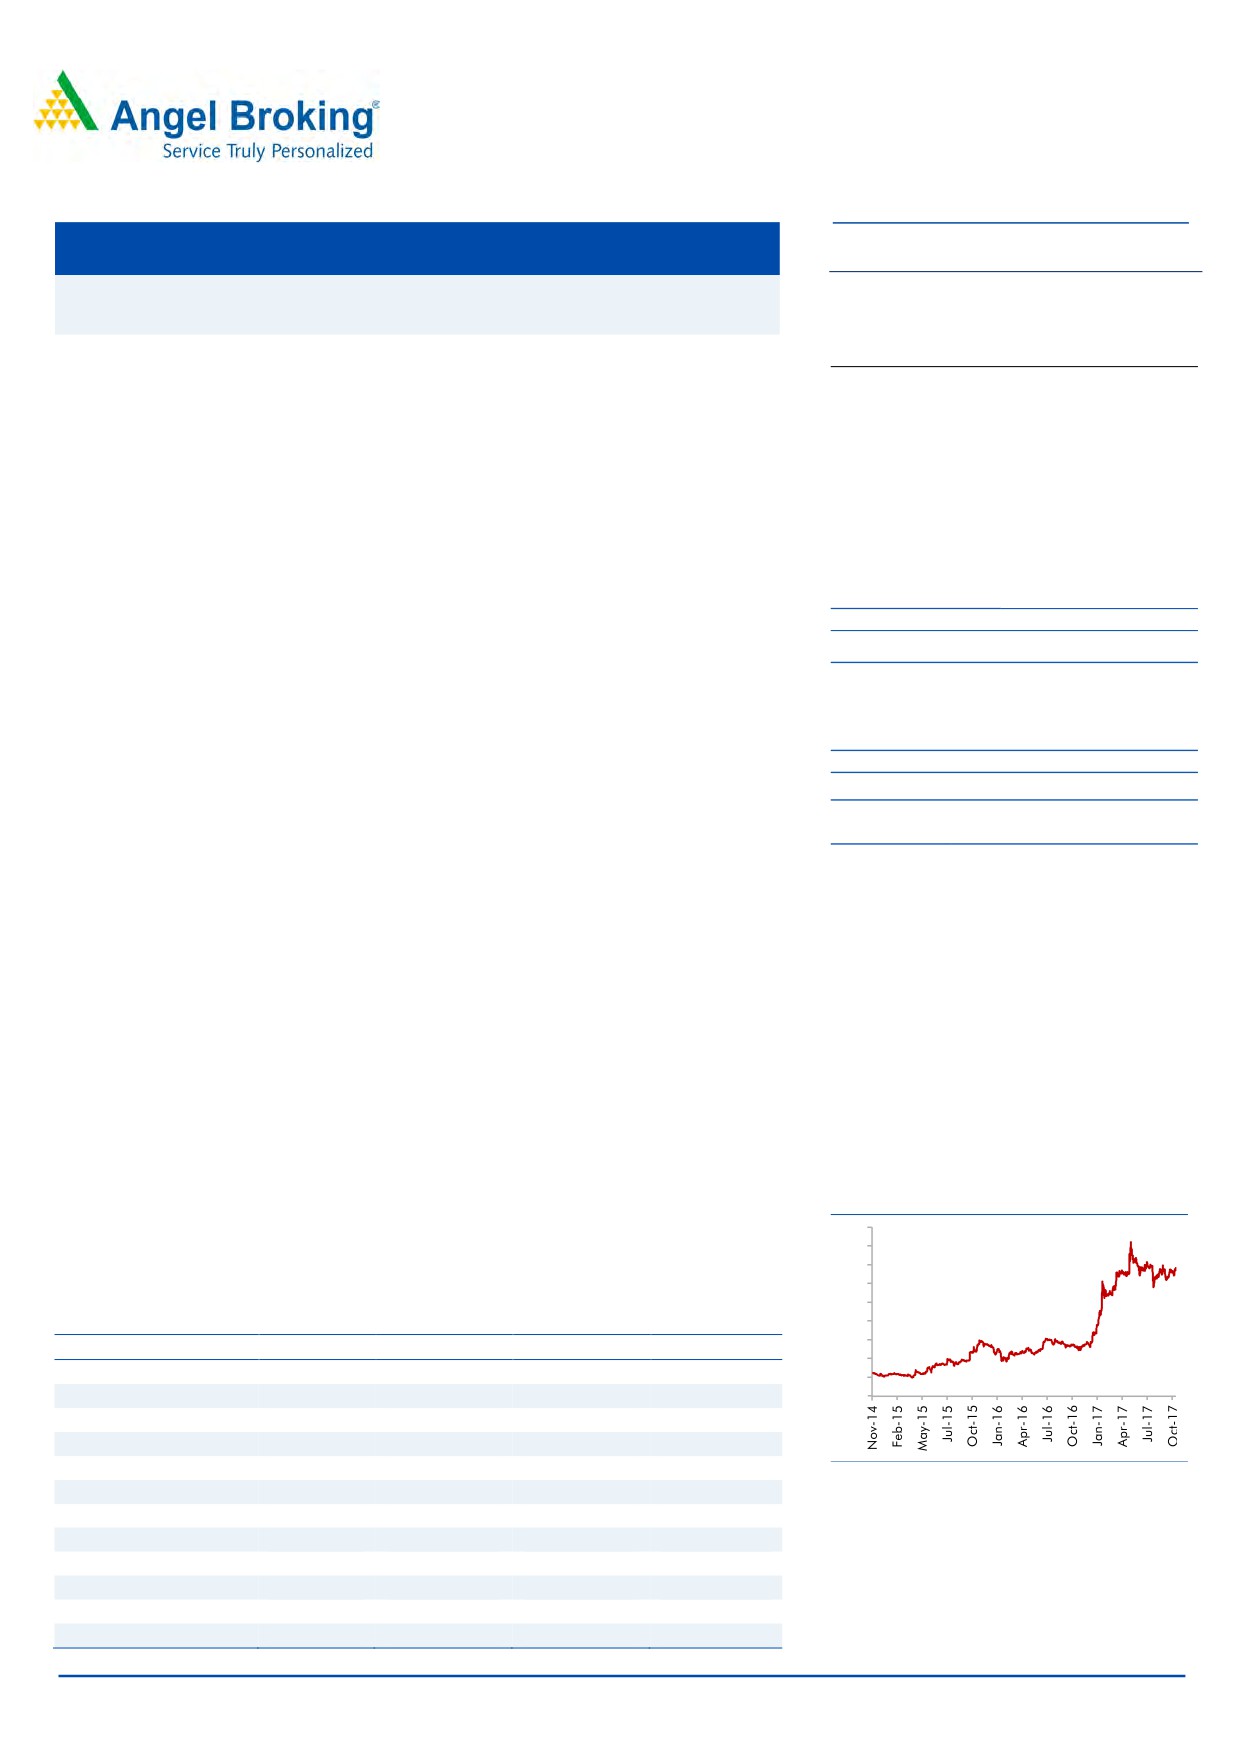
3 year daily price chart
expansion on the back of better manufacturing efficiency, increase in scale and
90
change in product mix. We initiate coverage on the stock with a Buy
80
recommendation and Target Price of `96 (15x FY2019E EPS), indicating an upside
70
of ~29% from the current levels.
60
50
Key financials
40
30
Y/E March (` cr)
FY2016
FY2017
FY2018E
FY2019E
20
Net sales
2,973
3,287
3,747
4,234
10
% chg
7.0
10.5
14.0
13.0
-
Net profit
99
117
139
170
% chg
36.3
18.9
18.2
22.6
EBITDA margin (%)
10.5
11.1
11.5
11.5
Source: Company, Angel Research
EPS (`)
3.7
4.4
5.2
6.4
P/E (x)
20.1
16.9
14.3
11.7
P/BV (x)
3.7
3.0
2.5
2.1
Amarjeet S Maurya
RoE (%)
18.4
17.9
17.5
17.6
022-39357800 Ext: 6831
RoCE (%)
12.2
13.8
15.4
16.3
EV/Sales (x)
1.2
1.1
0.9
0.8
EV/EBITDA (x)
11.3
9.7
8.2
7.3
Source: Company, Angel Research, Note: CMP as of Nov 06, 2017
Please refer to important disclosures at the end of this report
1
Quick take
LT Foods
Investment Arguments
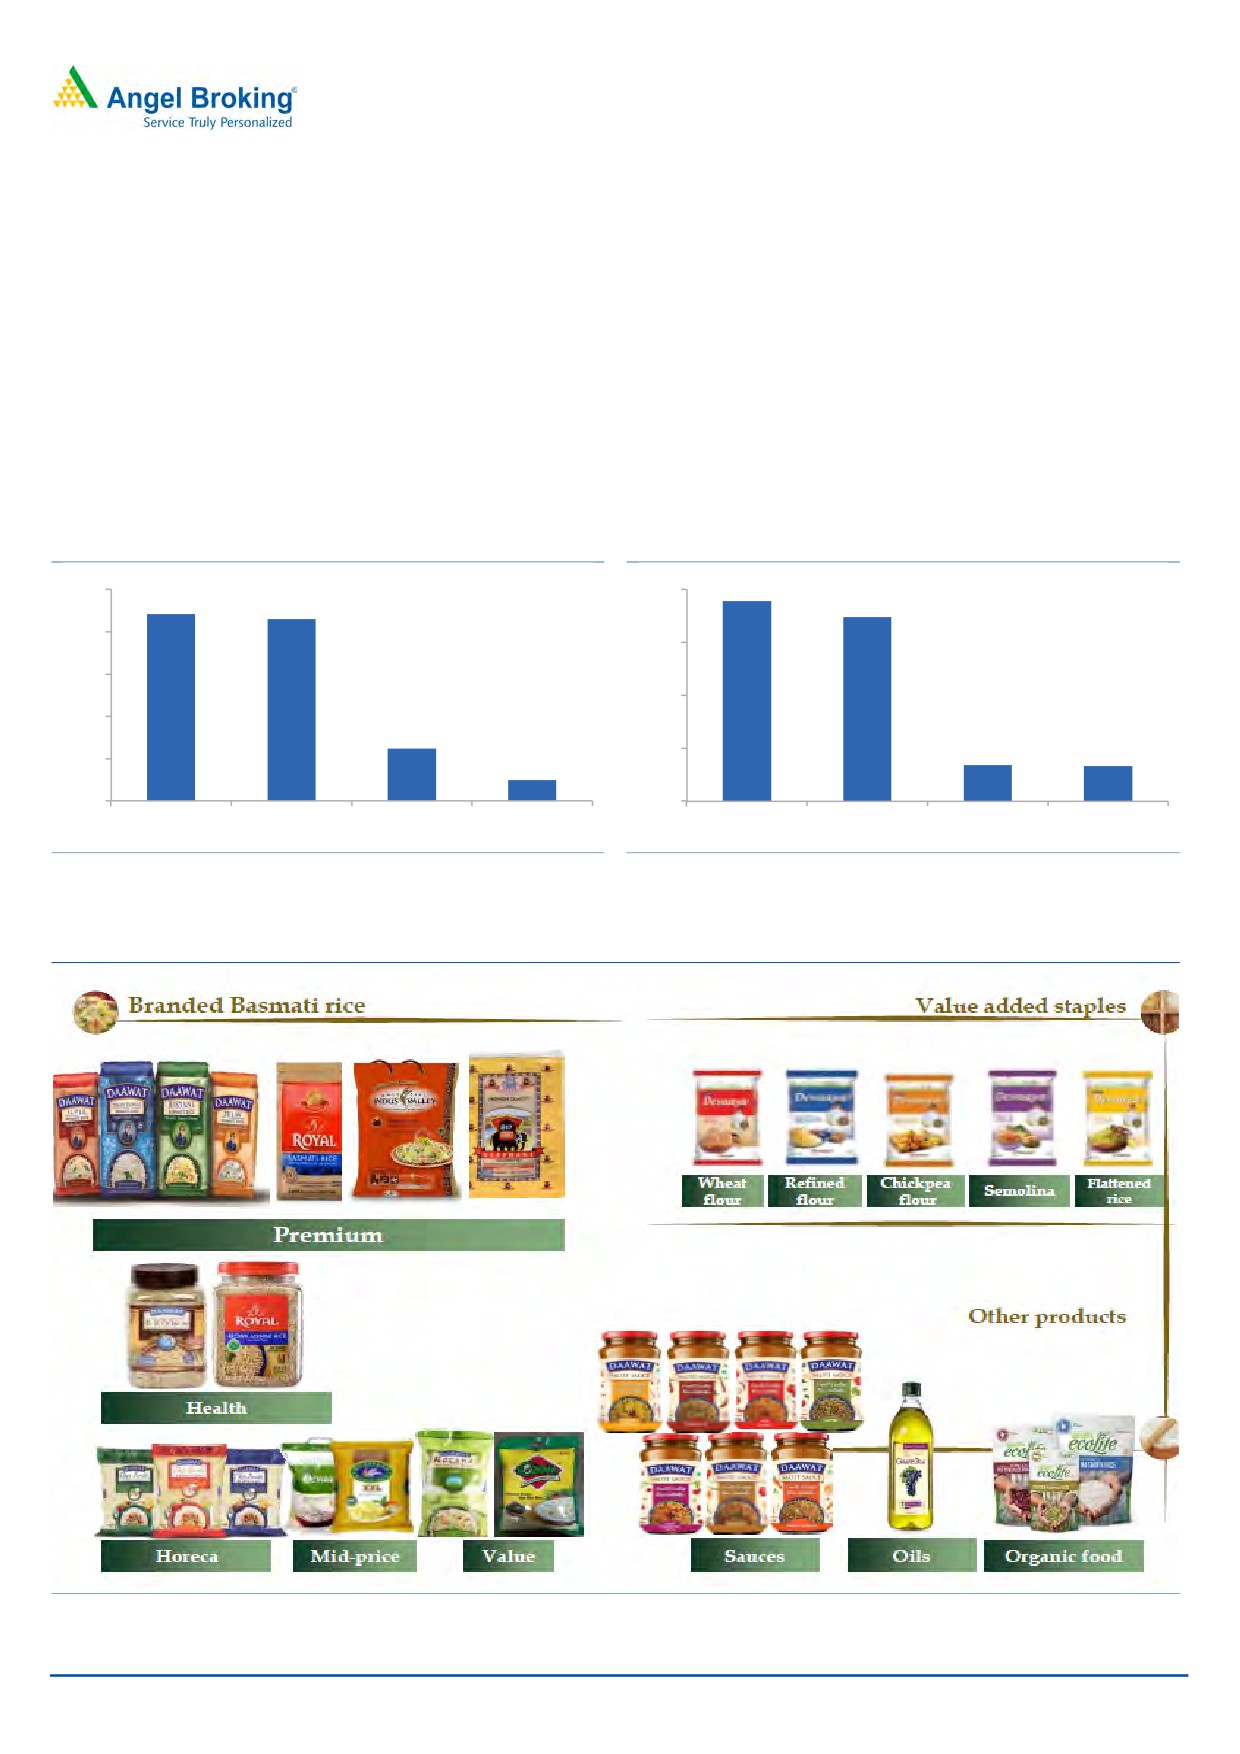
Market leadership with strong brand visibility
LTFL has a wide range of brands across price range catering to various customer
segments. The company’s flagship brand Daawat enjoys 22% market share in the
branded rice market of India. LTFL has been continuously focusing on strong
brand visibility. Hence, historically, the company has been spending on ad spends
in order to increase brand visibility. The company also has strong market share in
North America selling Basmati rice under the brand name ‘Royal’.
Exhibit 1: All India Rural &Urban Markets (%)
Exhibit 2: All India Modern Trade (%)
18.9
25
20
22.1
21.5
17.4
20
15
15
10
10
6.2
5
3.4
3.3
5
2.5
0
0
LT Foods
Peer 1
Peer 2
Peer 3
LT Foods
Peer 1
Peer 2
Peer 3
Source: Company, Angel Research
Source: Company, Angel Research
Exhibit 3: LTFL strong brand presence across the segment
Source: Company, Angel Research
November 07, 2017
2
Quick take
LT Foods
Wide distribution network
Currently LTFL has an access to 1,40,000 traditional retail outlets and reaches to
93% of towns with over 2 lakh population and 3,000 wholesalers. Further, the
company sells its products to premium hotels & restaurants (~50% share) and has
an access to 6,000 foodservice outlets i.e. ‘DawatChefs Secretz”. Moreover, it has
an access to 2,500 modern trade stores including 121 hypermarkets,
298
supermarkets and 1,462 mini markets. It is the 1st Rice Company to place Brown
Basmati Rice in Medical Chains.
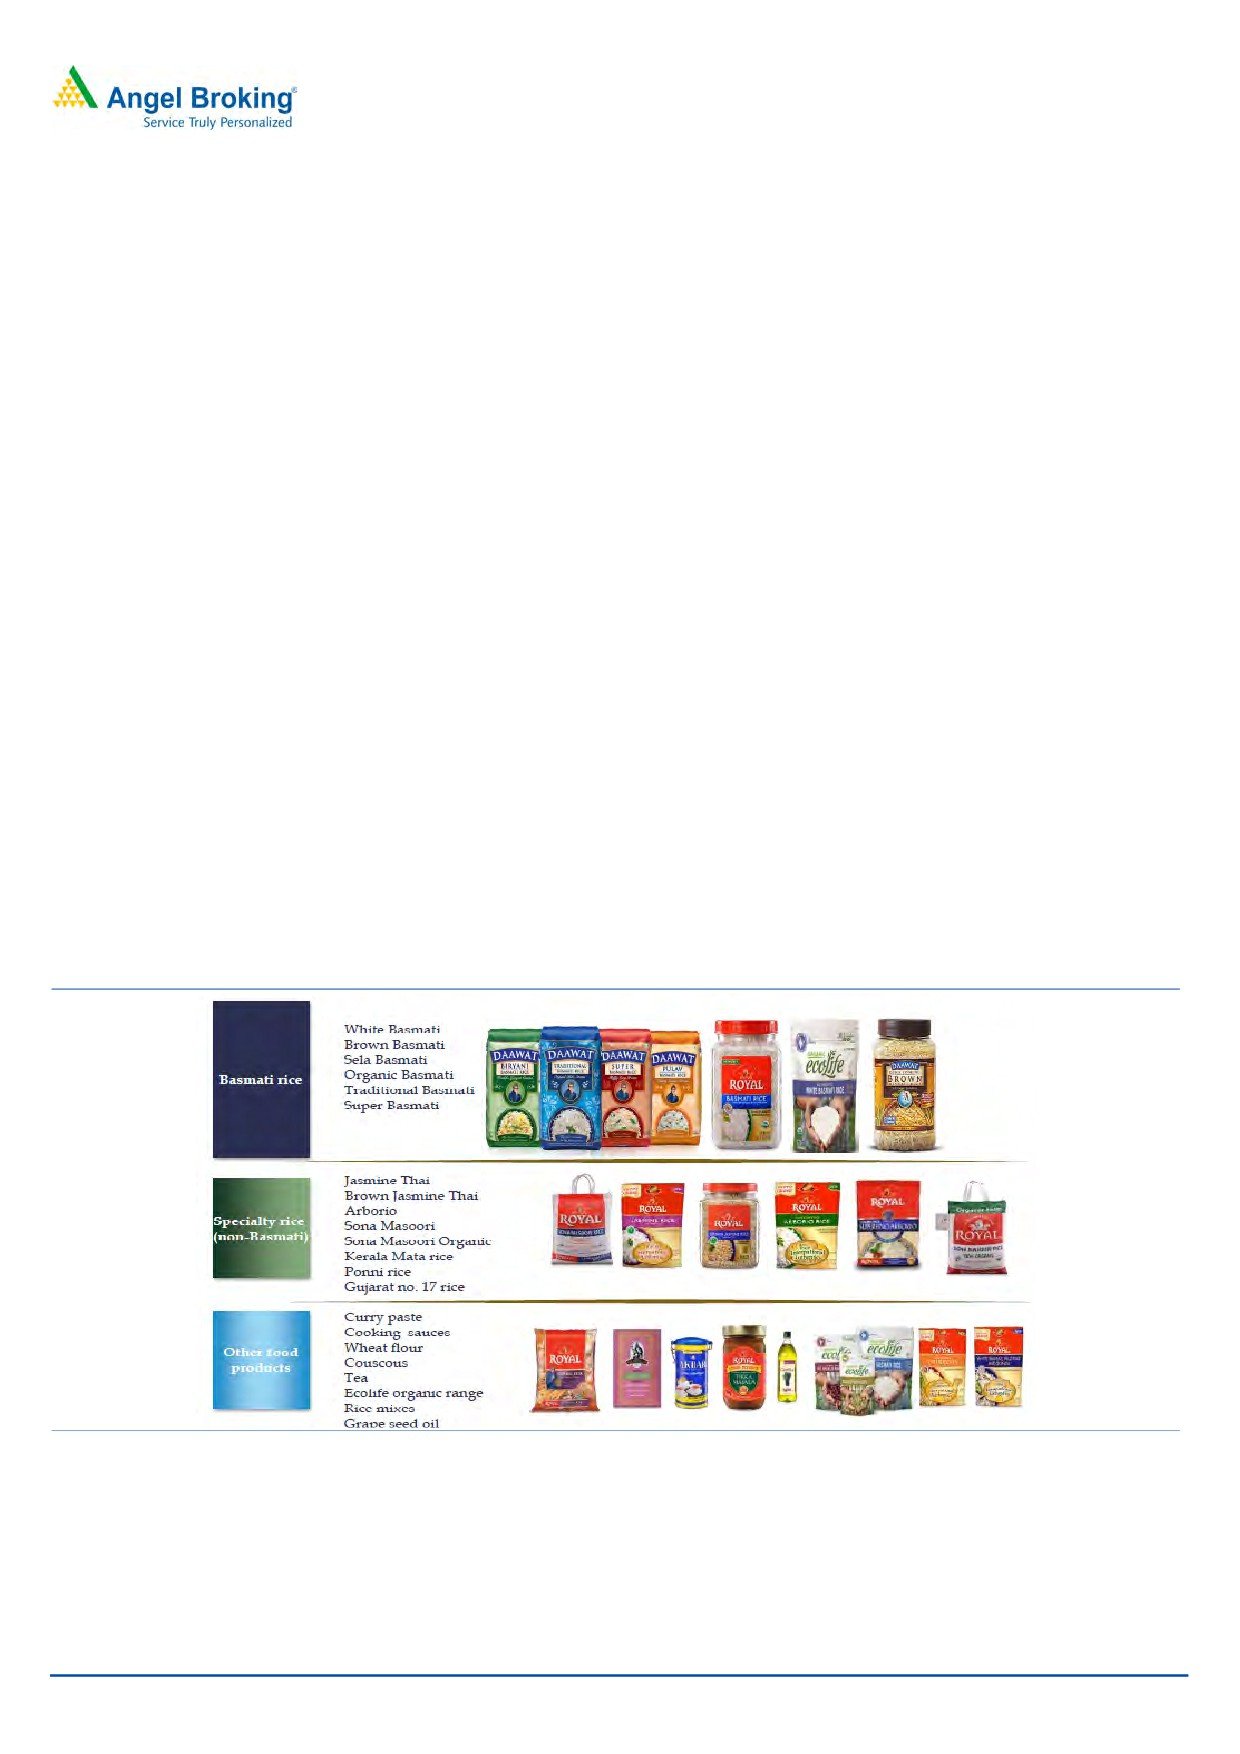
Diversified product portfolio catering to varied customers
The company has a well-diversified product basket catering to consumers of all
income groups. The company’s strong flagship brand is Daawat. In the basmati
rice segment, the company has products like White Basmati, Brown Basmati, Sela
Basmati, Organic Basmati, Traditional Basmati, and Super Basmati. The speciality
rice (non-Basmati) includes Jasmine Thai, Brown Jasmine Thai, Arborio, Sona
Masoori, Sona Masoori Organic, Kerala Mata rice, Ponni rice and Gujarat no. 17
rice. Furthermore, the company has wide range of Other food products like Curry
paste, Cooking sauces, Wheat flour, Couscous, Tea, Ecolife organic, range Rice
mixes and Grape seed oil.
LT Foods is also consistently working on adding new products to its portfolio. LTFL
has done JV with Japanese Snack Food major Kameda, which would launch rice
based snacks in India. LTFL had recently introduced “Daawat Rozana GoldPlus”
brand.
Exhibit 4: Broad Portfolio of Products
Source: Company, Angel Research
November 07, 2017
3
Quick take
LT Foods
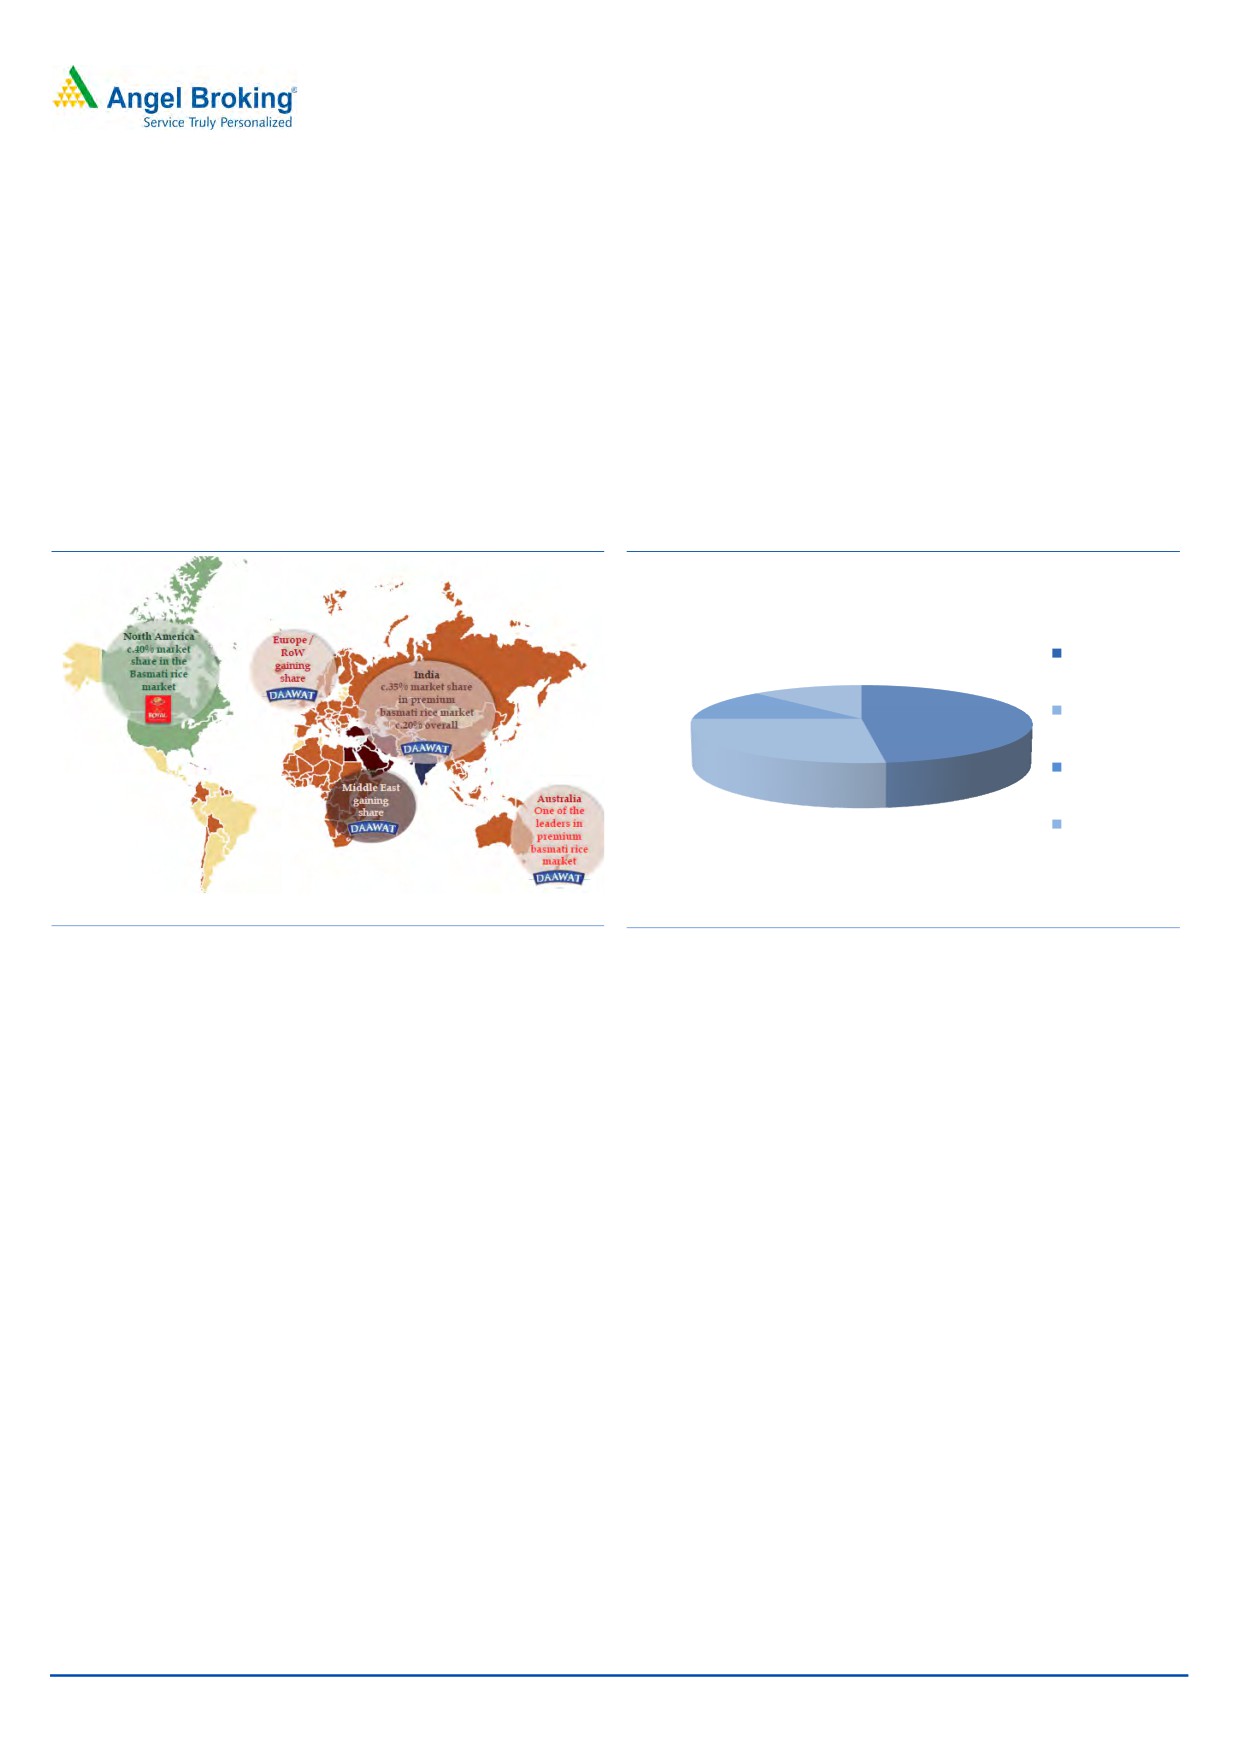
Strong global footprint
LT Foods is now an emerging global Foods Company with a focus on basmati and
other speciality rices, organic foods and convenience rice based products.
The company has a global footprint and sells its flagship basmati rice brands i.e.
Royal and Daawat, into 65 countries. Further, LT Foods has a dedicated network
for expanding its global reach. The company has established on ground presence
in the US, Europe and Middle East in order to unlock the full potential of these
territories. In addition, the company’s other product brands such as ecoLife and
Devaaya are also being strongly appreciated globally.
Exhibit 5: Global presence in over 65 countries
Exhibit 6: Revenue by geography in FY2017
India
12%
13%
North America
48%
MiddleEast
27%
RoW
Source: Company, Angel Research
Source: Company, Angel Research
November 07, 2017
4
Quick take
LT Foods
Outlook and Valuation
Going forward, we expect the company to report healthy top-line CAGR of 13.5%
over the next two years on the back of strong distribution network & brand,
continuous expansion, wide product basket and addition of new products in
portfolio. On the bottom-line front, we expect ~20% CAGR on the back of robust
improvement in operating performance. We expect margin expansion on the back
of better manufacturing efficiency, increase in scale and change in product mix.
We initiate coverage on the stock with a Buy recommendation and Target Price of
`96 (15x FY2019E EPS), indicating an upside of ~29% from the current levels.
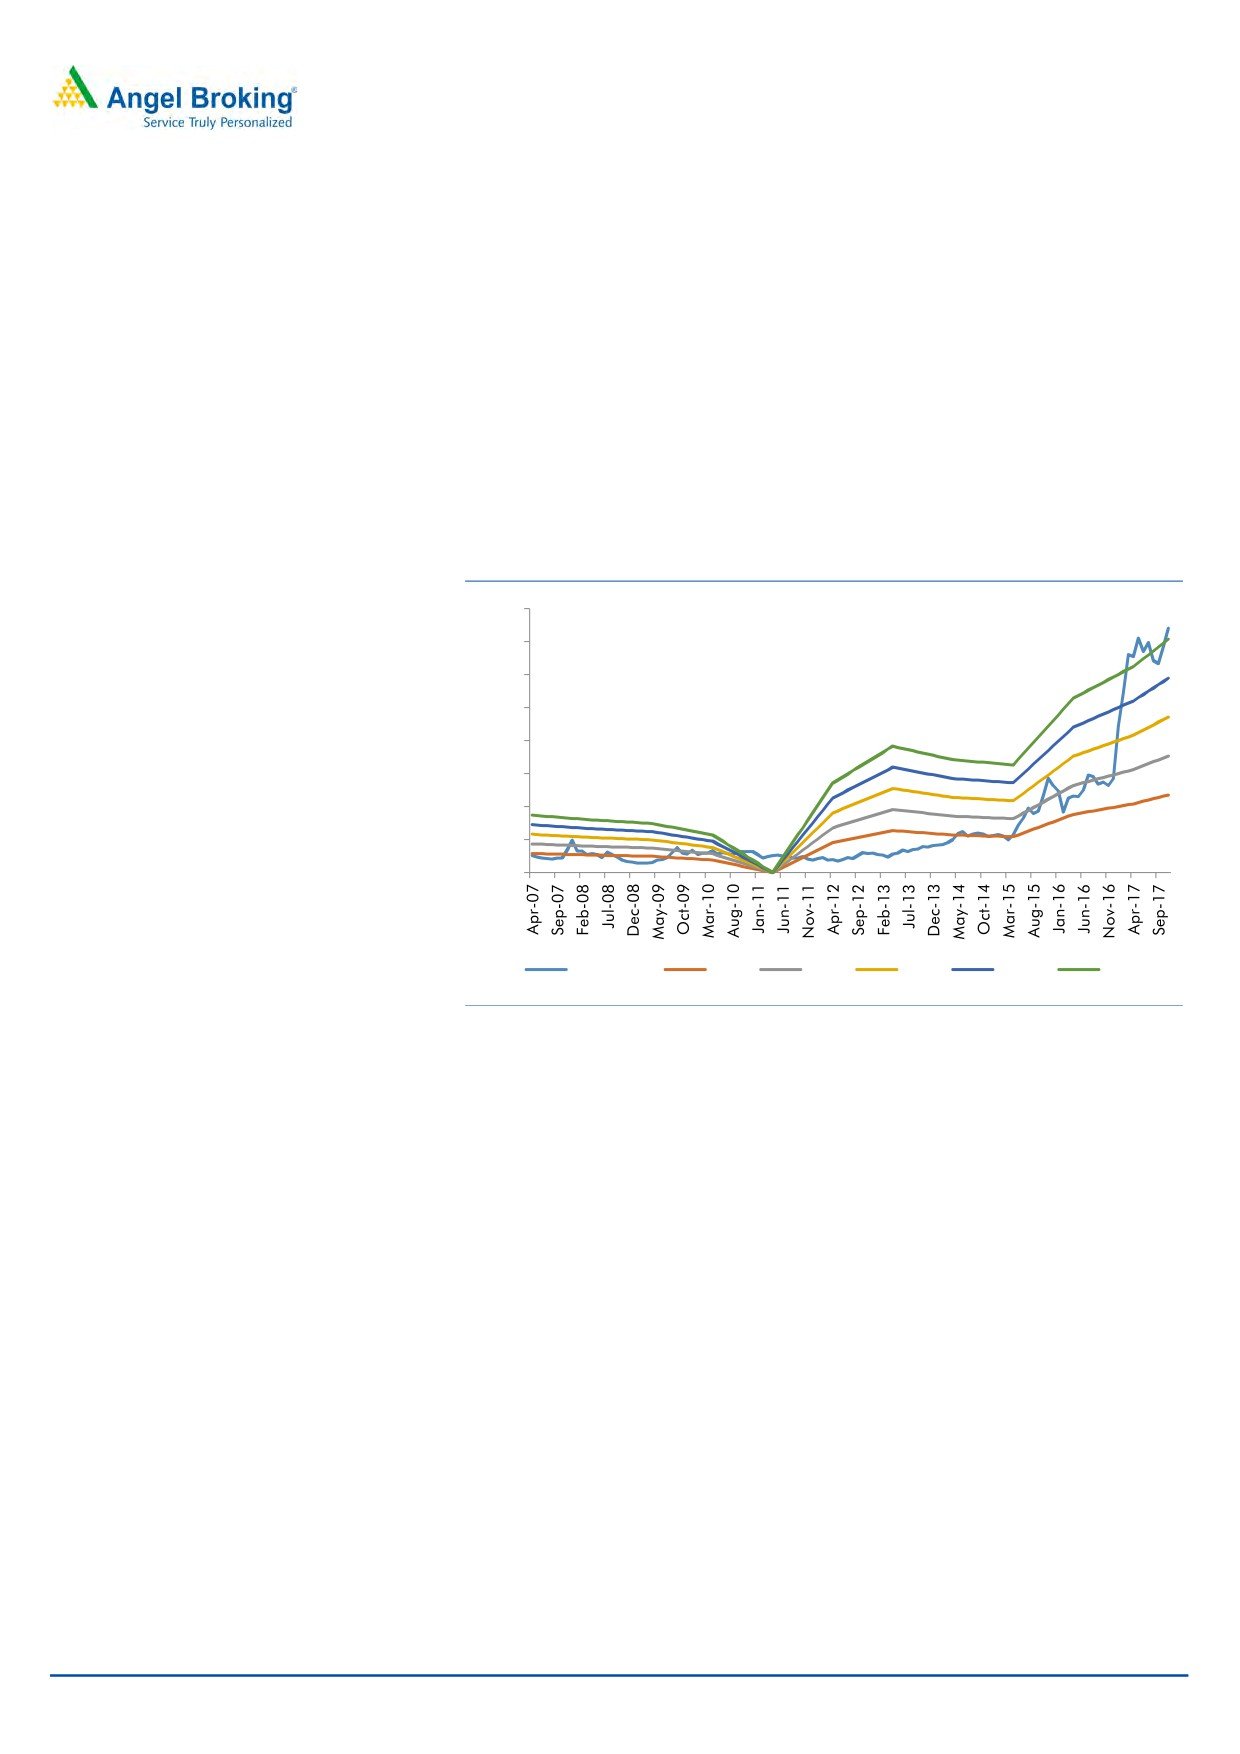
Exhibit 7: One year forward PE chart
80
70
60
50
40
30
20
10
0
Share Price
4.0 X
6.0 X
8.0 X
10.0 X
12.0 X
Source: Company, Angel Research
Key risks to our estimates
1) Increase in competition from unorganized players would impact overall growth
prospects of the company.
2) Basmati rice is an extremely volatile commodity. Hence, any unfavorable
change in Basmati rice prices could impact the company’s profitability.
3) Company derives ~52% revenue from overseas market; any unfavorable
change in currency could have an adverse impact on the company’s profitability.
November 07, 2017
5
Quick take
LT Foods
Company Background
LT Foods Limited (LTFL) is a branded speciality foods company. The company is
engaged in milling, processing and marketing of branded and non-branded
basmati rice and manufacturing of rice food products in the domestic and
overseas markets. Its geographical segments include India, North America and
Rest of the World. Its operations include contract farming, procurement, storage,
processing, packaging and distribution. Its rice product portfolio comprises of
brown rice, white rice, steamed rice, parboiled rice, organic rice, quick cooking
rice, value added rice and flavoured rice in the ready to cook segment. The
company's brands include (a) Royal, ecoLife, an organic food brand that includes
rice, pulses, oil seeds, cereal grains, spices, nuts & fruits and vegetables; (b)
Devaaya, which offers branded basmati rice, with staples, such as Atta, Suji,
Besan, Dalia, Poha and Maida; and (c) Heritage, a basmati rice brand. The other
brands of the company include Daawat, Gold Seal Indus Valley, Rozana and 817
Elephant.
Exhibit 8: Revenue break-up for LTFL (FY2017)
12%
13%
48%
India
North America
MiddleEast
RoW
27%
Source: Company, Angel Research
November 07, 2017
6
Quick take
LT Foods
Consolidated Profit & Loss Statement
Y/E March (` cr)
FY2015
FY2016
FY2017
FY2018E
FY2019E
Total operating income
2,779
2,973
3,287
3,747
4,234
% chg
11.5
7.0
10.5
14.0
13.0
Total Expenditure
2,471
2,661
2,920
3,316
3,747
Raw Material
2,076
2,105
2,405
2,743
3,099
Personnel
74
90
117
139
157
Others Expenses
321
466
398
435
491
EBITDA
308
313
366
431
487
% chg
9.6
1.6
17.2
17.6
13.0
(% of Net Sales)
11.1
10.5
11.1
11.5
11.5
Depreciation& Amortisation
47
52
54
57
60
EBIT
261
261
312
374
427
% chg
7.3
(0.0)
19.5
19.8
14.1
(% of Net Sales)
9.4
8.8
9.5
10.0
10.1
Interest & other Charges
151
148
155
157
159
Other Income
1
6
36
10
10
(% of PBT)
1.1
5.2
18.4
4.4
3.6
Share in profit of Associates
-
-
-
-
-
Recurring PBT
111
120
193
227
278
% chg
(15.1)
7.5
61.5
17.4
22.5
Tax
35
47
64
75
92
(% of PBT)
31.3
39.4
33.3
33.0
33.0
PAT (reported)
76
72
129
152
186
Minority Interest (after tax)
4
(0)
10
12
15
Profit/Loss of Associate Company
-
(1)
(1)
(1)
(1)
Extraordinary Items
-
(27)
-
-
-
ADJ. PAT
72
99
117
139
170
% chg
(7.5)
36.3
18.9
18.2
22.6
(% of Net Sales)
2.6
3.3
3.6
3.7
4.0
Basic EPS (`)
2.7
3.7
4.4
5.2
6.4
Fully Diluted EPS (`)
2.7
3.7
4.4
5.2
6.4
% chg
(7.5)
36.3
18.9
18.2
22.6
November 07, 2017
7
Quick take
LT Foods
Consolidated Balance Sheet
Y/E March (` cr)
FY2015
FY2016
FY2017
FY2018E FY2019E
SOURCES OF FUNDS
Equity Share Capital
26
27
27
27
27
Reserves& Surplus
436
510
630
768
938
Shareholders Funds
463
537
656
795
965
Minority Interest
34
34
45
45
45
Total Loans
1,692
1,597
1,612
1,632
1,652
Deferred Tax Liability
5
1
5
5
5
Total Liabilities
2,194
2,169
2,318
2,477
2,667
APPLICATION OF FUNDS
Gross Block
638
676
736
736
766
Less: Acc. Depreciation
268
315
365
422
482
Net Block
370
361
371
313
283
Capital Work-in-Progress
15
24
40
40
40
Investments
7
6
5
5
5
Current Assets
2,052
2,065
2,299
2,566
2,846
Inventories
1,362
1,300
1,448
1,653
1,856
Sundry Debtors
318
376
463
513
580
Cash
21
32
41
62
72
Loans & Advances
319
189
179
169
169
Other Assets
31
168
167
169
169
Current liabilities
256
296
410
460
521
Net Current Assets
1,796
1,769
1,889
2,105
2,325
Deferred Tax Asset
6
8
13
13
13
Mis. Exp. not written off
-
-
-
-
-
Total Assets
2,194
2,169
2,318
2,477
2,667
November 07, 2017
8
Quick take
LT Foods
Consolidated Cashflow Statement
Y/E March (` cr)
FY2015
FY2016
FY2017
FY2018E FY2019E
Profit before tax
111
163
195
227
278
Depreciation
47
52
54
57
60
Change in Working Capital
(245)
(69)
(125)
(195)
(211)
Interest / Dividend (Net)
145
140
143
157
159
Direct taxes paid
(50)
(34)
(44)
(75)
(92)
Others
1
45
(7)
0
0
Cash Flow from Operations
9
297
217
171
194
(Inc.)/ Dec. in Fixed Assets
(55)
(53)
(85)
(30)
(30)
(Inc.)/ Dec. in Investments
(3)
(1)
(4)
0
0
Cash Flow from Investing
(58)
(54)
(89)
(30)
(30)
Issue of Equity
1
5
2
0
0
Inc./(Dec.) in loans
184
(93)
23
20
20
Dividend Paid (Incl. Tax)
(6)
(5)
(4)
0
0
Interest / Dividend (Net)
(147)
(142)
(145)
(129)
(175)
Cash Flow from Financing
32
(235)
(124)
(109)
(155)
Inc./(Dec.) in Cash
(17)
8
4
32
9
Opening Cash balances
35
18
26
30
62
Closing Cash balances
18
26
30
62
72
November 07, 2017
9
Quick take
LT Foods
Key Ratios
Y/E March
FY2015
FY2016
FY2017
FY2018E
FY2019E
Valuation Ratio (x)
P/E (on FDEPS)
27.4
20.1
16.9
14.3
11.7
P/CEPS
16.1
16.0
10.8
9.5
8.1
P/BV
4.3
3.7
3.0
2.5
2.1
Dividend yield (%)
0.3
0.0
0.0
0.0
0.0
EV/Sales
1.3
1.2
1.1
0.9
0.8
EV/EBITDA
11.8
11.3
9.7
8.2
7.3
EV / Total Assets
1.7
1.6
1.5
1.4
1.3
Per Share Data (`)
EPS (Basic)
2.7
3.7
4.4
5.2
6.4
EPS (fully diluted)
2.7
3.7
4.4
5.2
6.4
Cash EPS
4.6
4.6
6.9
7.8
9.2
DPS
0.2
0.0
0.0
0.0
0.0
Book Value
17.3
20.1
24.6
29.8
36.2
Returns (%)
ROCE
12.1
12.2
13.8
15.4
16.3
Angel ROIC (Pre-tax)
12.3
12.5
14.0
15.9
16.8
ROE
15.7
18.4
17.9
17.5
17.6
Turnover ratios (x)
Asset Turnover (Gross Block)
4.4
4.4
4.5
5.1
5.5
Inventory / Sales (days)
179
160
161
161
160
Receivables (days)
42
46
51
50
50
Payables (days)
13
18
24
24
24
Working capital cycle (ex-cash) (days)
208
188
188
187
186
Source: Company, Angel Research
November 07, 2017
10
Quick take
LT Foods
Research Team Tel: 022 - 39357800
DISCLAIMER
Angel Broking Private Limited (hereinafter referred to as “Angel”) is a registered Member of National Stock Exchange of India Limited,
Bombay Stock Exchange Limited and MCX Stock Exchange Limited. It is also registered as a Depository Participant with CDSL and
Portfolio Manager with SEBI. It also has registration with AMFI as a Mutual Fund Distributor. Angel Broking Private Limited is a
registered entity with SEBI for Research Analyst in terms of SEBI (Research Analyst) Regulations, 2014 vide registration number
INH000000164. Angel or its associates has not been debarred/ suspended by SEBI or any other regulatory authority for accessing
/dealing in securities Market. Angel or its associates including its relatives/analyst do not hold any financial interest/beneficial
ownership of more than 1% in the company covered by Analyst. Angel or its associates/analyst has not received any compensation /
managed or co-managed public offering of securities of the company covered by Analyst during the past twelve months. Angel/analyst
has not served as an officer, director or employee of company covered by Analyst and has not been engaged in market making activity
of the company covered by Analyst.
This document is solely for the personal information of the recipient, and must not be singularly used as the basis of any investment
decision. Nothing in this document should be construed as investment or financial advice. Each recipient of this document should
make such investigations as they deem necessary to arrive at an independent evaluation of an investment in the securities of the
companies referred to in this document (including the merits and risks involved), and should consult their own advisors to determine
the merits and risks of such an investment.
Reports based on technical and derivative analysis center on studying charts of a stock's price movement, outstanding positions and
trading volume, as opposed to focusing on a company's fundamentals and, as such, may not match with a report on a company's
fundamentals.
The information in this document has been printed on the basis of publicly available information, internal data and other reliable
sources believed to be true, but we do not represent that it is accurate or complete and it should not be relied on as such, as this
document is for general guidance only. Angel Broking Pvt. Limited or any of its affiliates/ group companies shall not be in any way
responsible for any loss or damage that may arise to any person from any inadvertent error in the information contained in this report.
Angel Broking Pvt. Limited has not independently verified all the information contained within this document. Accordingly, we cannot
testify, nor make any representation or warranty, express or implied, to the accuracy, contents or data contained within this document.
While Angel Broking Pvt. Limited endeavors to update on a reasonable basis the information discussed in this material, there may be
regulatory, compliance, or other reasons that prevent us from doing so.
This document is being supplied to you solely for your information, and its contents, information or data may not be reproduced,
redistributed or passed on, directly or indirectly.
Neither Angel Broking Pvt. Limited, nor its directors, employees or affiliates shall be liable for any loss or damage that may arise from
or in connection with the use of this information.
Note: Please refer to the important ‘Stock Holding Disclosure' report on the Angel website (Research Section). Also, please refer to the
latest update on respective stocks for the disclosure status in respect of those stocks. Angel Broking Pvt. Limited and its affiliates may
have investment positions in the stocks recommended in this report.
Disclosure of Interest Statement
LT Foods
1. Analyst ownership of the stock
No
2. Angel and its Group companies ownership of the stock
No
3. Angel and its Group companies' Directors ownership of the stock
No
4. Broking relationship with company covered
No
Note: We have not considered any Exposure below ` 1 lakh for Angel, its Group companies and Directors
Ratings (Based on expected returns
Buy (> 15%)
Accumulate (5% to 15%)
Neutral (-5 to 5%)
over 12 months investment period):
Reduce (-5% to -15%)
Sell (< -15)