2QFY2017 Result Update | HFC
November 5, 2016
LIC Housing Finance
BUY
CMP
`533
Performance Highlights
Target Price
`630
Investment Period
12 months
Particulars (` cr)
2QFY17 1QFY17
% chg (qoq) 2QFY16
% chg (yoy)
NII
866
825
5.0
717
20.7
Pre-prov. profit
791
740
6.9
674
17.3
Stock Info
PAT
495
408
21.3
411
20.2
Sector
HFC
Source: Company, Angel Research
Market Cap (` cr)
26,934
LIC Housing Finance (LICHF)’s 2QFY17 results remained decent with the PAT
Beta
1.5
growing by 21.3% yoy. Balanced growth in retail as well as in developer portfolio
helped in improving the spread, while lower cost of funds helped in NIM improvement.
52 Week High / Low
624/389
Balanced growth across retail and non retail portfolio: LIC’s total loan book grew
Avg. Daily Volume
2,640,153
by 14.9% yoy, during 2QFY17. While LAP grew by 99% yoy; developer loans
Face Value (`)
2
witnessed some moderation, up by 22.4% yoy vs 38.7% in 1QFY17. However, the
BSE Sensex
27,274
core retail loans continued to be sluggish, up by 9.7% yoy. The share of LAP+
developer loans in the books increased to 12.5% vs 12.2% qoq. We believe there
Nifty
8,434
is further scope for LICHF to increase the share of non individual portfolio, but
Reuters Code
LICH.BO
feel the management will increase it in a calibrated manner.
Bloomberg Code
LICHF@IN
Favorable cost of funds helped NIM improvement: During the quarter, the
incremental yield on assets stood at 10.58% down 10 bps while the incremental
costs stood at 8.4% down 30 bps. As a result, incremental spread improved by 20
Shareholding Pattern (%)
bps to 2.18% and NIM improved by 7 bps to 2.68%. We expect the NIM to
remain steady going ahead with a positive bias, drawing support from the
Promoters
40.3
increasing exposure to high yielding LAP and developer loans. LICH has been
MF / Banks / Indian Fls
5.2
able to reduce it overall cost of funds and we don’t expect negative trend for the
FII / NRIs / OCBs
39.4
same in the near term.
Indian Public / Others
15.1
Asset quality stabilized during the quarter: In absolute terms, GNPAs declined to
`750cr vs `757cr and GNPA% declined marginally to 0.57% vs 0.59% QoQ.
Ageing of two NPA accounts from the developer loans segment had resulted rise
Abs. (%)
3m
1yr
3yr
in provisions during 1QFY17, which has come back to normalized level during
the quarter at `30.3cr.
Sensex
(1.6)
2.70
30.0
Outlook and valuation: While the core retail portfolio continues to be sluggish
LICHF
13.9
4.2
155.0
growing by less than 10%, other segments like LAP & Developer loans have been
driving the growth. However, there is visible sign of pick up in the growth in some
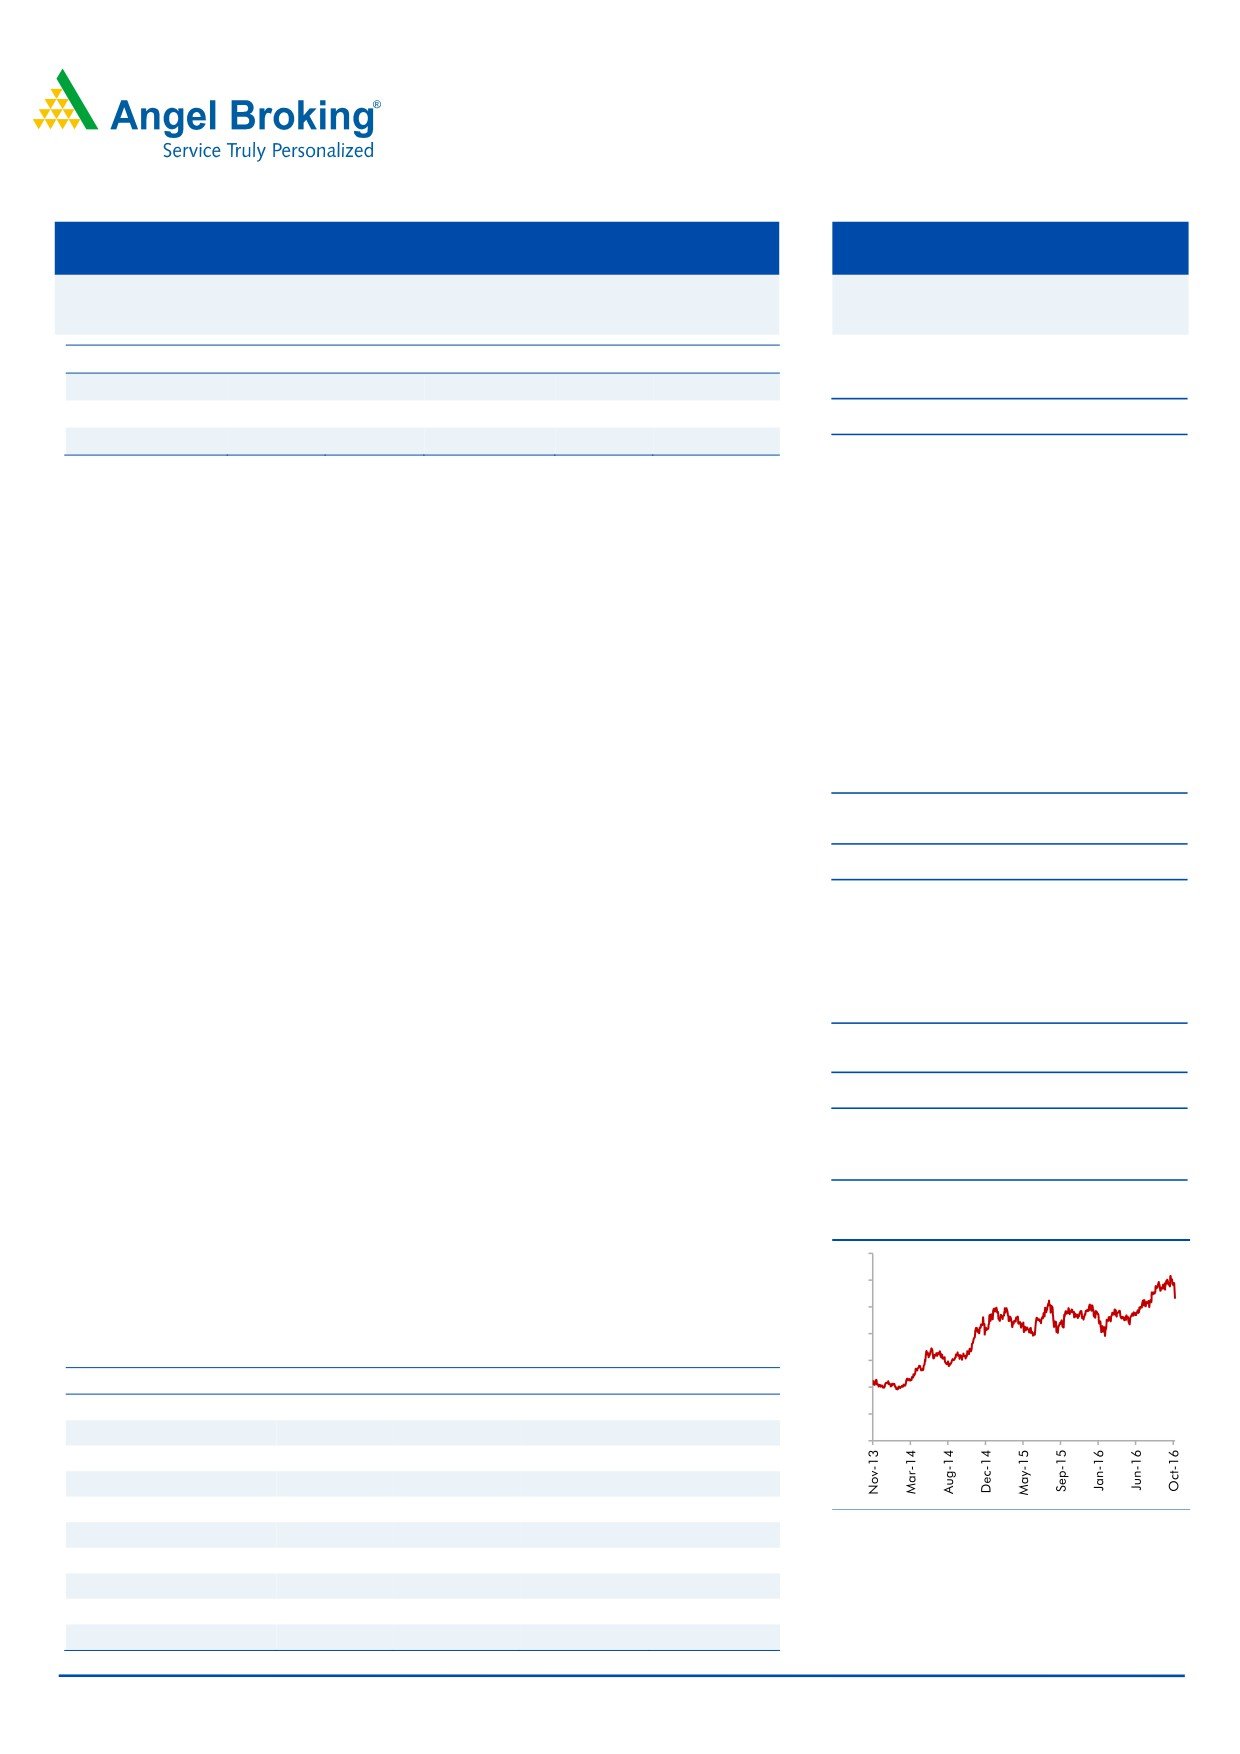
3-Year Daily Price Chart
pockets for the core retail loans. We expect the company to post a loan book
700
CAGR of 19% over FY16-18E, translating into an earnings CAGR of 18.0% over
600
the same period. The stock currently trades at 2.2x its FY2018E ABV. We maintain
500
our Buy rating on the stock with a revised target price of `630.
400
Key financials (standalone)
300
Y/E March (` cr)
FY2015
FY2016
FY2017E
FY2018E
200
NII
2,349
2,944
3,542
4,116
100
% chg
16.4
25.3
20.3
16.2
0
Net profit
1,386
1,661
1,968
2,323
% chg
5.2
19.8
18.5
18.0
NIM (%)
2.3
2.6
2.6
2.5
Source: Company, Angel Research
EPS (`)
27.5
32.9
39.0
46.0
P/E (x)
19.4
16.2
13.7
11.6
P/ABV (x)
3.5
3.0
2.6
2.2
Siddharth Purohit
RoA (%)
1.4
1.4
1.4
1.4
022 - 3935 7800 Ext: 6872
RoE (%)
18.1
19.6
19.9
20.1
Source: Company, Angel Research; Note: CMP as of November 4, 2016
Please refer to important disclosures at the end of this report
1
LIC Housing Finance | 2QFY2017 Result Update
Exhibit 1: 2QFY2017 performance (standalone)
Particulars (` cr)
2QFY17
1QFY17
% chg (qoq)
2QFY16
% chg (yoy)
FY2016
FY2015
% chg
Interest earned
3,428
3,326
3.1
3,026
13.3
12,396
10,669
16
Interest expenses
2,563
2,502
2.4
2,309
11.0
9,307
8,310
12.0
Net interest income
866
825
5.0
717
20.7
3,089
2,359
31.0
Non-interest income
62
54
15.1
63
(2.7 )
89
129
(30.9)
Operating income
927
878
5.6
780
18.8
3,179
2,488
27.7
Operating expenses
136
138
(1.3 )
106
28.7
469
379
23.6
Pre-prov. profit
791
740
6.9
674
17.3
2,710
2,109
28.5
Provisions & cont.
30
116
(74.0)
30
0.8
146
7
1,920.0
PBT
761
623
22.0
644
18.1
2,564
2,102
22.0
Prov. for taxes
266
216
23.3
233
14.4
903
716
26.1
PAT
495
408
21.3
412
20.2
1,661
1,386
19.8
EPS (`)
9.3
8.1
8.2
32.9
27.5
19.8
Cost-to-income ratio (%)
14.7
15.7
13.6
14.7
15.2
Effective tax rate (%)
35.0
34.6
36.1
35.2
34.1
Net NPA (%)
0.28
0.28
0.32
0.2
0.2
Source: Company, Angel Research
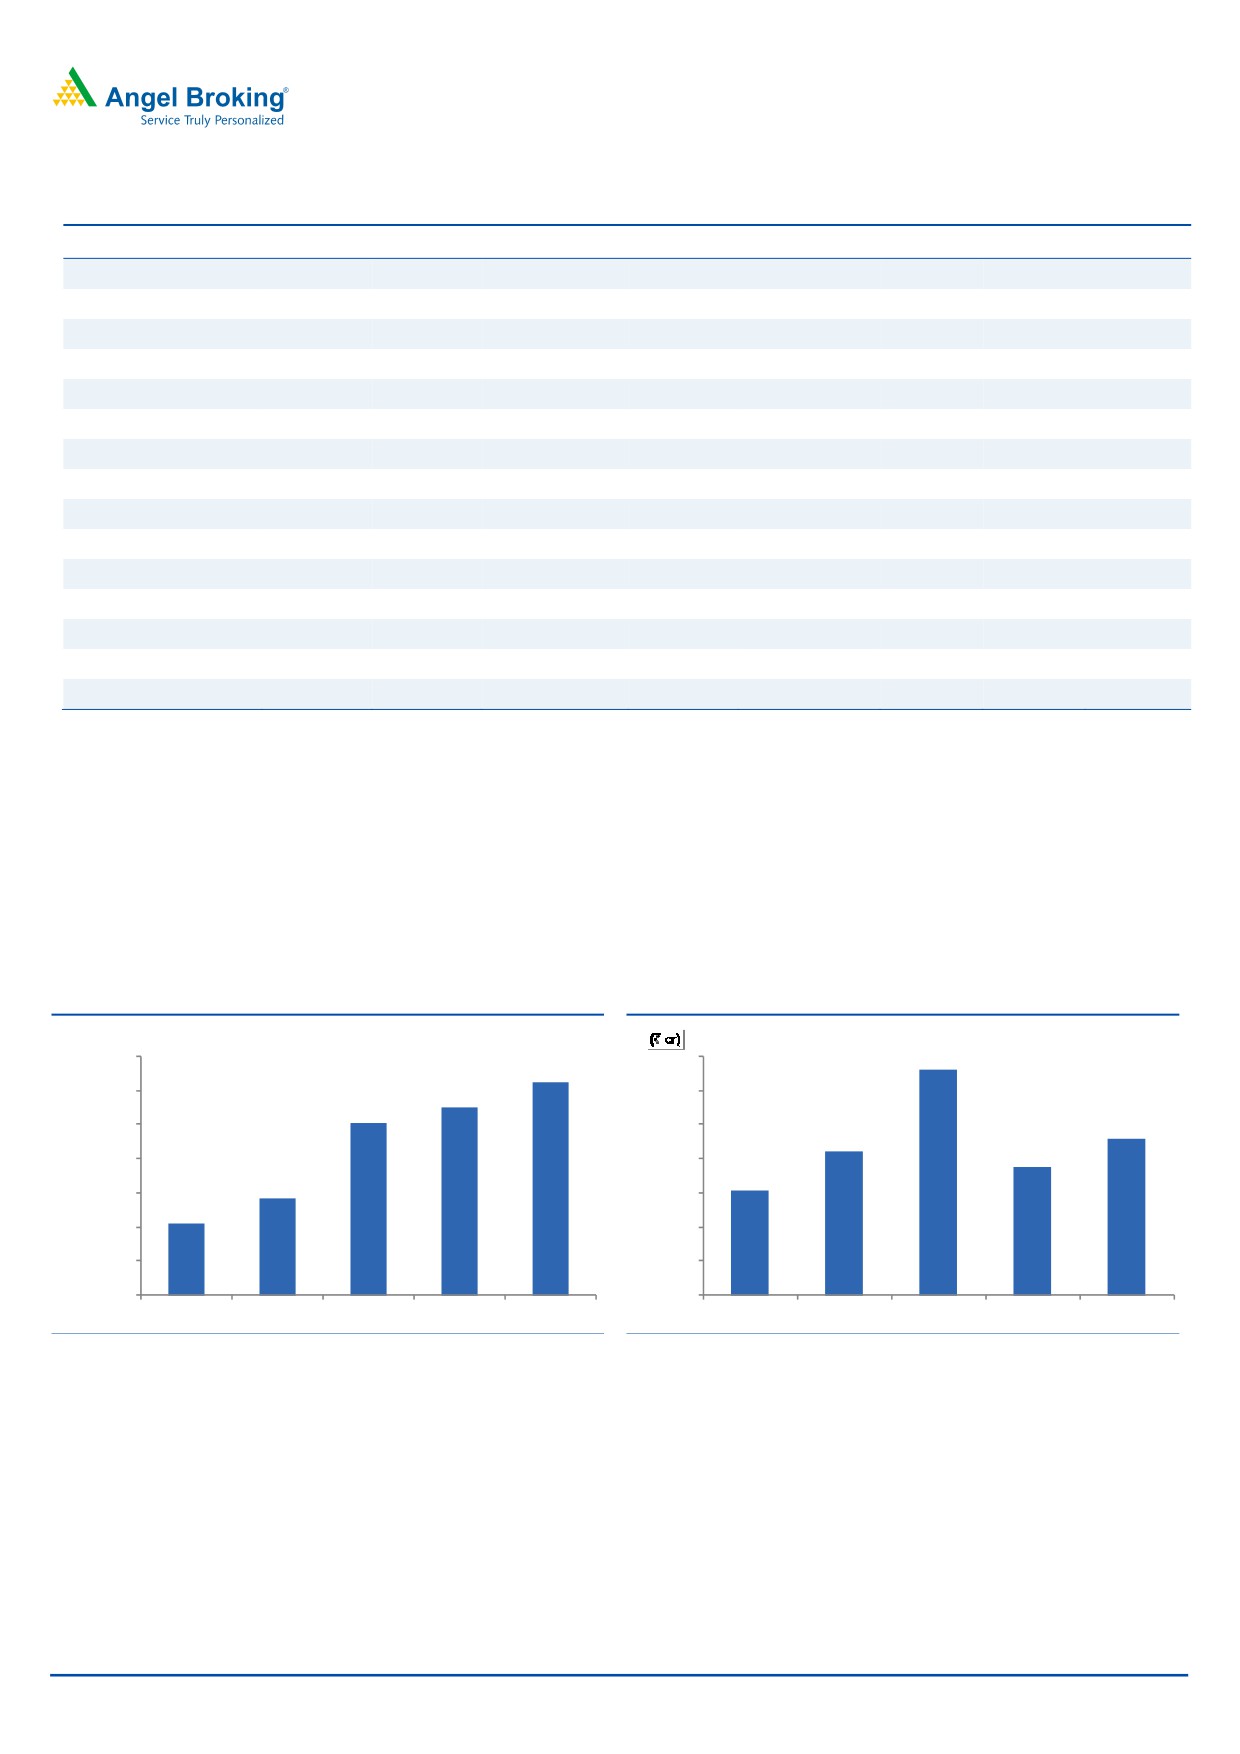
Balanced growth across retail and non retail portfolio: LIC’s total loan book grew
by 14.9% yoy during 2QFY17. While LAP grew by 99% yoy; developer loans
witnessed some moderation, up by 22.4% yoy vs 38.7% in 1QFY17. However, the
core retail loans continued to be sluggish up by 9.7% yoy. The share of LAP+
developer loans in the books increased to 12.5% vs 12.2%. We believe there is
further scope for LICHF to increase the share of non individual portfolio, but feel
the management will increase it in a calibrated manner.
Exhibit 2: Moderate growth in Advances
Exhibit 3: Disbursements remained healthy
(` cr)
1,35,000
14,000
13,216
1,31,096
1,30,000
1,27,437
12,000
1,25,173
1,25,000
10,000
9,123
8,390
7,542
1,20,000
8,000
6,124
1,14,069
1,15,000
6,000
1,10,411
1,10,000
4,000
1,05,000
2,000
1,00,000
-
Q1FY16
Q2FY16
Q4FY16
Q1FY17
Q2FY17
Q1FY16
Q2FY16
Q4FY16
Q1FY17
Q2FY17
Source: Company, Angel Research
Source: Company, Angel Research
November 5, 2016
2
LIC Housing Finance | 2QFY2017 Result Update
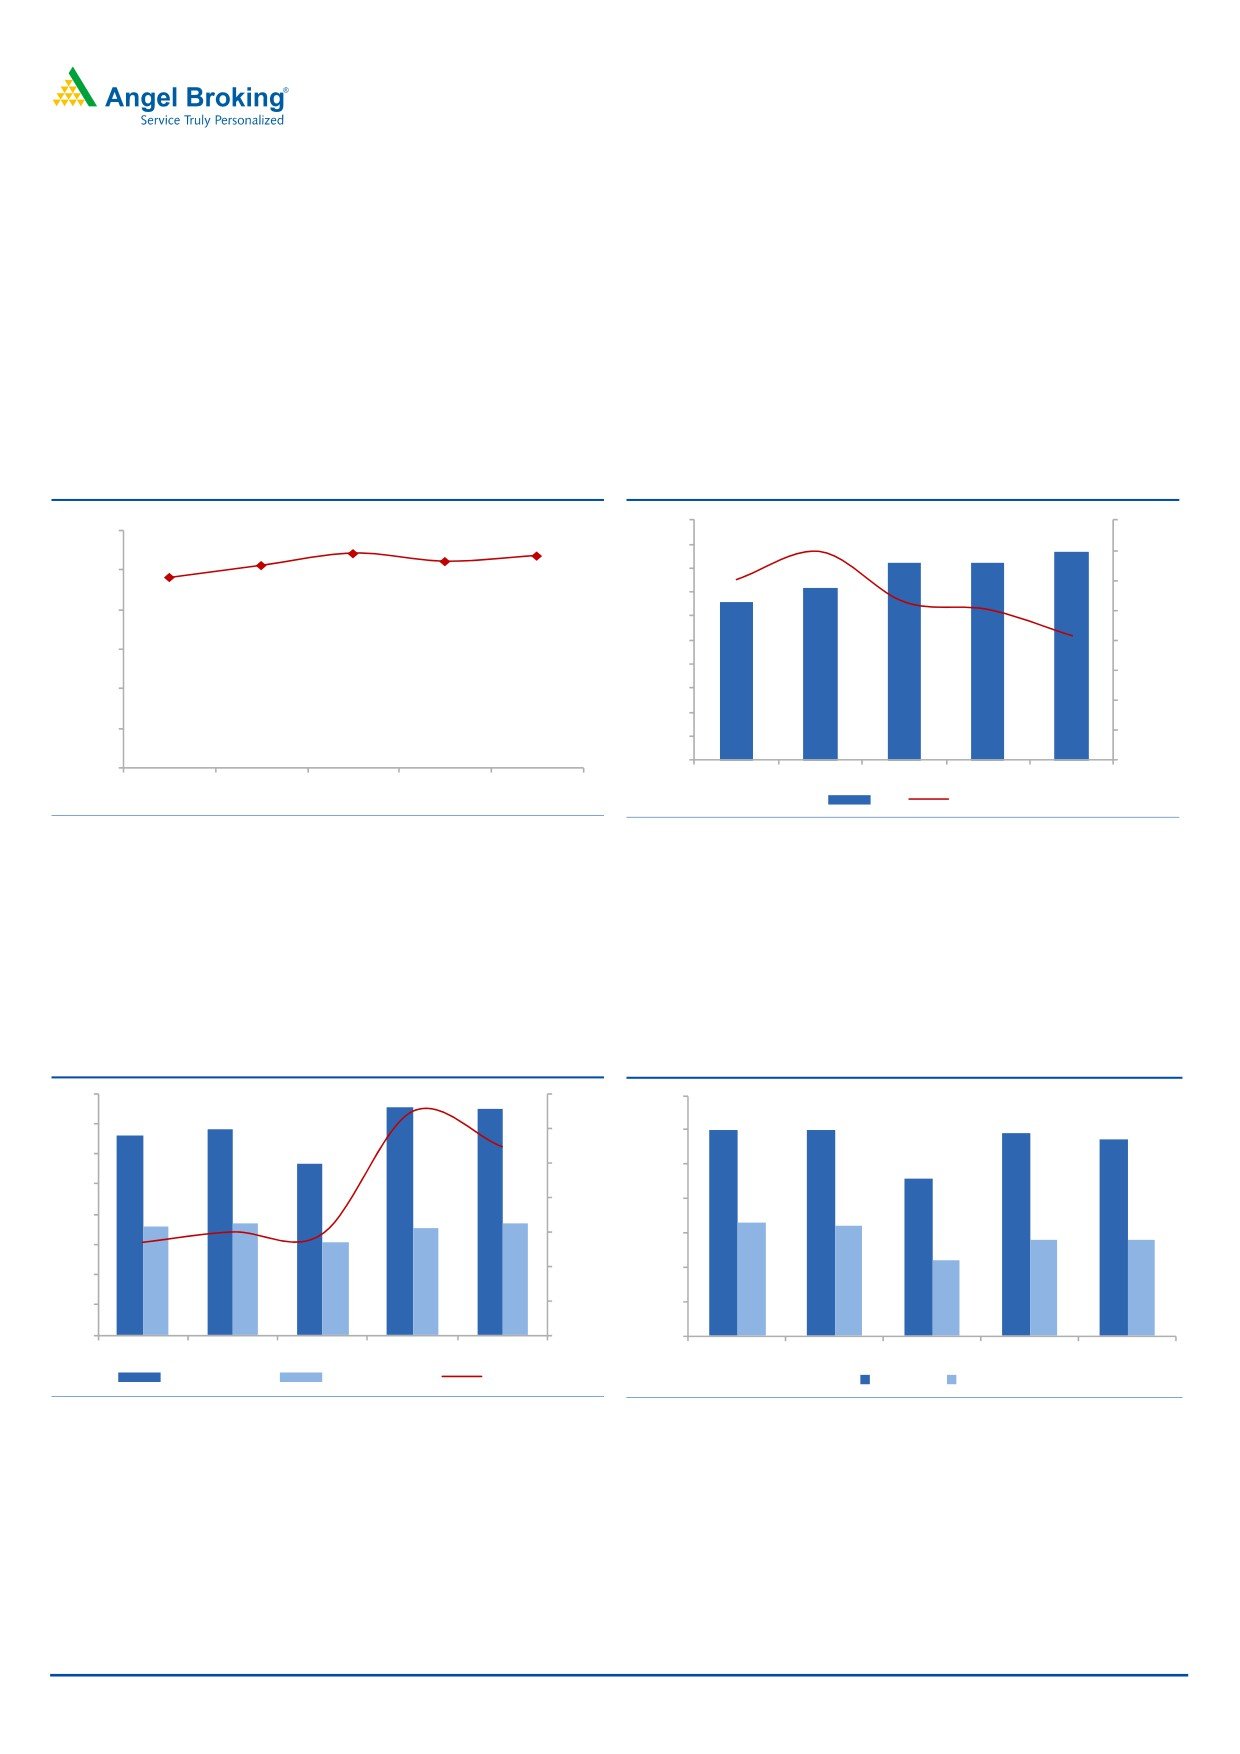
Favorable cost of funds helped NIM improvement: During the quarter, the
incremental yield on assets stood at 10.58% down 10 bps while the incremental
costs stood at 8.4% down 30 bps. As a result, incremental spread improved by 20
bps to 2.18% and NIM improved by 7 bps to 2.68%. We expect the NIM to remain
steady going ahead with a positive bias, drawing support from the increasing
exposure to high yielding LAP and developer loans. LICH has been able to reduce
it overall cost of funds and we don’t expect negative trend for the same in the near
term.
Exhibit 4: Low cost funds added to NIM
Exhibit 5: NII growth trend
1,000
40.0%
3.00%
2.71%
2.68%
866
2.56%
2.61%
900
821
825
35.0%
2.41%
2.50%
800
717
659
30.0%
700
2.00%
25.0%
600
500
20.0%
1.50%
400
15.0%
1.00%
300
10.0%
200
0.50%
5.0%
100
-
0.0%
0.00%
Q1FY16
Q2FY16
Q4FY16
Q1FY17
Q2FY17
Q1FY16
Q2FY16
Q4FY16
Q1FY17
Q2FY17
NII
% YoY
Source: Company, Angel Research
Source: Company, Angel Research
Asset quality stabilized during the quarter: In absolute terms, GNPAs declined to
`750cr vs `757cr and GNPA% declined marginally to 0.57% vs 0.59% QoQ.
Ageing of two NPA accounts from the developer loans segment had resulted rise in
provisions during 1QFY17, which has come back to normalized level during the
quarter at `30.3cr.
Exhibit 6: Stable Asset quality
Exhibit 7: Gross and Net NPAs remained stable
800
757
750
54.0%
0.70%
683
0.60%
0.60%
0.59%
700
659
0.57%
52.0%
0.60%
567
600
50.0%
0.50%
0.46%
500
48.0%
0.40%
360
369
356
368
0.33%
0.32%
400
307
0.28%
0.28%
46.0%
0.30%
300
0.22%
44.0%
0.20%
200
100
42.0%
0.10%
0
40.0%
0.00%
Q1FY16
Q2FY16
Q4FY16
Q1FY17
Q2FY17
Q1FY16
Q2FY16
Q4FY16
Q1FY17
Q2FY17
GNPAs (` Cr)
NNPAs (` Cr)
PCR %
GNPAs % NNPAs%
Source: Company, Angel Research
Source: Company, Angel Research
November 5, 2016
3
LIC Housing Finance | 2QFY2017 Result Update
Outlook and valuation
While the core retail portfolio continues to be sluggish growing by less than 10%,
other segments like LAP & Developers loans have been driving the growth.
However, there is visible sign of pick up in the growth in some pockets for the core
retail loans. We expect the company to post a loan book CAGR of 19% over FY16-
18E, translating into an earning CAGR of 18.0% over the same period. The stock
currently trades at 2.2x its FY2018E ABV. We maintain our Buy rating on the stock
with a revised target price of `630.
Company Background
LIC Housing Finance (LICHF) is one of the largest specialized mortgage lenders in
India, with a balance sheet size of more than `1,35,600cr. The credit portfolio for
LICHF is ~`1,31,000cr, of which ~97% is derived from the retail segment. The
company has a network of ~245 marketing offices spread across the country and
is promoted by the state-owned life insurance behemoth, Life Insurance
Corporation of India (LIC), which holds a 40.3% stake in the company.
The company has a low-risk business model as ~82% of the loans are disbursed
to salaried customers. Loans to individuals account for 87.5% of the outstanding
loan book and the segment is the key focus area of the company. LAP accounts for
9.7% and loans to developers account for 2.8% of the total outstanding loan book.
The company’s incremental average ticket size of the loans stood at ~`18.5 lakh
while the average cumulative ticket size stood at ~`12lakh.
Exhibit 8: Key Operating Indicators
Key Operating Indicators
FY13
FY14
FY15
FY16
Floating Loan Portfolio
49.0
42.0
37.0
47.0
LTV
59.7
54.5
50.9
46.6
Pre Payment Ratio
7.8
9.3
8.4
11.9
Income to Installment Ratio
33.9
34.7
33.9
33.3
Source: Company, Angel Research
November 5, 2016
4
LIC Housing Finance | 2QFY2017 Result Update
Income statement (standalone)
Y/E March (` cr)
FY2013 FY2014 FY2015
FY2016
FY2017E
FY2018E
NII
1,605
2,019
2,349
2,944
3,542
4,116
- YoY Growth (%)
8.4
25.8
16.4
25.3
20.3
16.2
Other Income
128
142
139
235
170
178
- YoY Growth (%)
(10.6)
10.5
(1.9)
68.8
(27.6)
4.7
Operating Income
1,733
2,160
2,488
3,179
3,712
4,293
- YoY Growth (%)
6.7
24.6
15.2
27.7
16.8
15.7
Operating Expenses
282
313
379
469
505
588
- YoY Growth (%)
18.9
11.1
21.1
23.6
7.8
16.3
Pre - Provision Profit
1,451
1,847
2,109
2,710
3,207
3,706
- YoY Growth (%)
4.6
27.3
14.2
28.5
18.3
15.6
Prov. & Cont.
79
21
7
146
223
183
- YoY Growth (%)
(49.5)
(72.8)
(66.2)
1,920.0
52.1
(17.8)
Profit Before Tax
1,372
1,826
2,102
2,564
2,984
3,522
- YoY Growth (%)
11.5
33.0
15.1
22.0
16.4
18.0
Prov. for Taxation
347
508
716
903
1,016
1,199
- as a % of PBT
25.3
27.8
34.1
35.2
34.1
34.1
PAT
1,026
1,317
1,386
1,661
1,968
2,323
- YoY Growth (%)
12.2
28.4
5.2
19.8
18.5
18.0
Balance sheet (standalone)
Y/E March (` cr)
FY2013 FY2014 FY2015 FY2016
FY2017E
FY2018E
Share Capital
101
101
101
101
101
101
Reserve & Surplus
6,380
7,432
7,717
9,016
10,555
12,371
Loan Funds
68,764
81,486
96,532
1,11,509
1,30,465
1,53,917
- Growth (%)
22.6
18.5
18.5
15.5
17.0
18.0
Other Liab. & Prov.
4,407
4,414
5,622
6,409
7,509
8,995
Total Liabilities
79,653
93,432
1,09,972
1,27,035
1,48,631
1,75,384
Investments
185
199
237
274
320
378
Advances
77,813
91,341
1,08,361
1,25,173
1,46,452
1,72,814
- Growth (%)
23.4
17.4
18.6
15.5
17.0
18.0
Fixed Assets
62
76
80
92
108
127
Other Assets
1,593
1,817
1,295
1,496
1,750
2,065
Total Assets
79,653
93,432
1,09,972
1,27,035
1,48,631
1,75,384
November 5, 2016
5
LIC Housing Finance | 2QFY2017 Result Update
Ratio analysis (standalone)
Y/E March
FY2013
FY2014
FY2015
FY2016
FY2017E
FY2018E
Profitability ratios (%)
NIMs
2.3
2.4
2.3
2.6
2.6
2.5
Cost to Income Ratio
16.3
14.5
15.2
14.7
13.6
13.7
RoA
1.4
1.5
1.4
1.4
1.4
1.4
RoE
16.9
18.8
18.1
19.6
19.9
20.1
Asset Quality (%)
Gross NPAs
0.61
0.67
0.46
0.45
0.54
0.50
Net NPAs
0.35
0.39
0.22
0.22
0.24
0.23
Provision Coverage
41.4
41.9
52.6
52.4
55.0
54.0
Per Share Data (`)
EPS
20.3
26.1
27.5
32.9
39.0
46.0
ABVPS (75% cover.)
125.2
145.2
152.6
178.0
207.9
243.4
DPS
3.8
4.5
5.0
6.0
7.1
8.4
Valuation Ratios
PER (x)
26.8
20.4
19.4
16.2
13.7
11.6
P/ABVPS (x)
4.3
3.7
3.5
3.0
2.6
2.2
Dividend Yield
0.8
0.9
1.0
1.2
1.4
1.7
DuPont Analysis
NII
2.2
2.3
2.3
2.5
2.6
2.5
(-) Prov. Exp.
0.1
0.0
0.0
0.1
0.2
0.1
Adj. NII
2.1
2.3
2.3
2.4
2.4
2.4
Treasury
(0.0)
0.0
0.0
0.0
0.0
0.0
Int. Sens. Inc.
2.1
2.3
2.3
2.4
2.4
2.4
Other Inc.
0.2
0.2
0.1
0.2
0.1
0.1
Op. Inc.
2.3
2.5
2.4
2.6
2.5
2.5
Opex
0.4
0.4
0.4
0.4
0.4
0.4
PBT
1.9
2.1
2.1
2.2
2.2
2.2
Taxes
0.5
0.6
0.7
0.8
0.7
0.7
RoA
1.4
1.5
1.4
1.4
1.4
1.4
Leverage
11.9
12.4
13.2
14.0
13.9
14.0
RoE
16.9
18.8
18.1
19.6
19.9
20.1
November 5, 2016
6
LIC Housing Finance | 2QFY2017 Result Update
Research Team Tel: 022 - 39357800
DISCLAIMER
Angel Broking Private Limited (hereinafter referred to as “Angel”) is a registered Member of National Stock Exchange of India Limited,
Bombay Stock Exchange Limited and Metropolitan Stock Exchange Limited. It is also registered as a Depository Participant with CDSL
and Portfolio Manager with SEBI. It also has registration with AMFI as a Mutual Fund Distributor. Angel Broking Private Limited is a
registered entity with SEBI for Research Analyst in terms of SEBI (Research Analyst) Regulations, 2014 vide registration number
INH000000164. Angel or its associates has not been debarred/ suspended by SEBI or any other regulatory authority for accessing
/dealing in securities Market. Angel or its associates/analyst has not received any compensation / managed or co-managed public
offering of securities of the company covered by Analyst during the past twelve months.
This document is solely for the personal information of the recipient, and must not be singularly used as the basis of any investment
decision. Nothing in this document should be construed as investment or financial advice. Each recipient of this document should
make such investigations as they deem necessary to arrive at an independent evaluation of an investment in the securities of the
companies referred to in this document (including the merits and risks involved), and should consult their own advisors to determine
the merits and risks of such an investment.
Reports based on technical and derivative analysis center on studying charts of a stock's price movement, outstanding positions and
trading volume, as opposed to focusing on a company's fundamentals and, as such, may not match with a report on a company's
fundamentals. Investors are advised to refer the Fundamental and Technical Research Reports available on our website to evaluate the
contrary view, if any.
The information in this document has been printed on the basis of publicly available information, internal data and other reliable
sources believed to be true, but we do not represent that it is accurate or complete and it should not be relied on as such, as this
document is for general guidance only. Angel Broking Pvt. Limited or any of its affiliates/ group companies shall not be in any way
responsible for any loss or damage that may arise to any person from any inadvertent error in the information contained in this report.
Angel Broking Pvt. Limited has not independently verified all the information contained within this document. Accordingly, we cannot
testify, nor make any representation or warranty, express or implied, to the accuracy, contents or data contained within this document.
While Angel Broking Pvt. Limited endeavors to update on a reasonable basis the information discussed in this material, there may be
regulatory, compliance, or other reasons that prevent us from doing so.
This document is being supplied to you solely for your information, and its contents, information or data may not be reproduced,
redistributed or passed on, directly or indirectly.
Neither Angel Broking Pvt. Limited, nor its directors, employees or affiliates shall be liable for any loss or damage that may arise from
or in connection with the use of this information.
Disclosure of Interest Statement
LIC Housing Finance
1. Financial interest of research analyst or Angel or his Associate or his relative
No
2. Ownership of 1% or more of the stock by research analyst or Angel or associates or relatives
No
3. Served as an officer, director or employee of the company covered under Research
No
4. Broking relationship with company covered under Research
No
Ratings (Based on expected returns
Buy (> 15%)
Accumulate (5% to 15%)
Neutral (-5 to 5%)
over 12 months investment period):
Reduce (-5% to -15%)
Sell (< -15)
November 5, 2016
7