2QFY2016 Result Update | Auto Ancillary
November 5, 2015
L G Balakrishnan & Bros
NEUTRAL
CMP
`456
Performance Highlights
Target Price
-
Quarterly Data (Standalone)
Investment Period
-
(` cr)
2QFY16
2QFY15
% yoy
2QFY16
% qoq
Revenue
282
267
5.6
247
14.1
Stock Info
EBITDA
36
36
(0.2)
24
47.7
Sector
Auto Ancillary
OPM (%)
12.8
13.5
(74)
9.8
291
Adj. PAT
17
17
4.6
9
92.5
Market Cap (` cr)
714
Source: Company, Angel Research
Net Debt (` cr)
133
LG Balakrishnan & Bros (LGBBL) reported a slightly better-than-expected standalone top-
Beta
0.5
line and bottom-line growth for 2QFY2016. The Transmission segment, which contributed
52 Week High / Low
764 / 401
~79% to the company’s total standalone revenue, reported a growth of 11% yoy, while the
Avg. Daily Volume
4,825
Others segment reported a decline on the sales front. On the bottom-line (standalone) front, the
Face Value (`)
10
company unperformed due to subdued sales growth and poor operating performance.
BSE Sensex
26,553
Top-line grew by ~6% yoy: The standalone top-line grew by ~6% yoy to ~`282cr, which is
Nifty
8,040
higher than our estimate of
~`267cr. The Transmission segment revenue was up
Reuters Code
LGB.BO
~11% yoy; the segment accounted for ~79% of the standalone revenue of the company.
Bloomberg Code
LGBB@IN
The Others segment reported a decline in sales.
Poor operating performance and lower other income mar profitability: The company
Shareholding Pattern (%)
reported an operating profit of ~`36cr, which is down 0.2% yoy. The operating margin
Promoters
47.3
contracted by by 74bp yoy to 12.8%, primarily on account of higher employee costs and
MF / Banks / Indian Fls
13.4
other expenditure. The reported standalone net profit declined by ~19% yoy to ~`17cr, but
is higher than our estimate of ~`16cr. However, on adjusting for the one-time exceptional
FII / NRIs / OCBs
0.0
gain incurred in 2QFY2015, the PAT during 2QFY2016 actually grew by 5% yoy.
Indian Public / Others
39.2
Outlook and valuation: LGBBL is a market leader in two-wheeler automotive chains with
~70% market share in the OEM segment. The company has been reporting lower growth
Abs. (%)
3m 1yr
3yr
in earnings since the last three quarters, which is mainly due to overall slowdown in the
Sensex
(5.4)
(4.7)
41.5
two-wheeler industry. The two-wheeler industry has been impacted mainly due to the rural
LGBL
(7.4)
10.7
261.6
slowdown. However, sales are expected to rebound in 2HFY2016 on expectations of a
normal monsoon which will boost crop output, thus leading to revival in rural demand. The
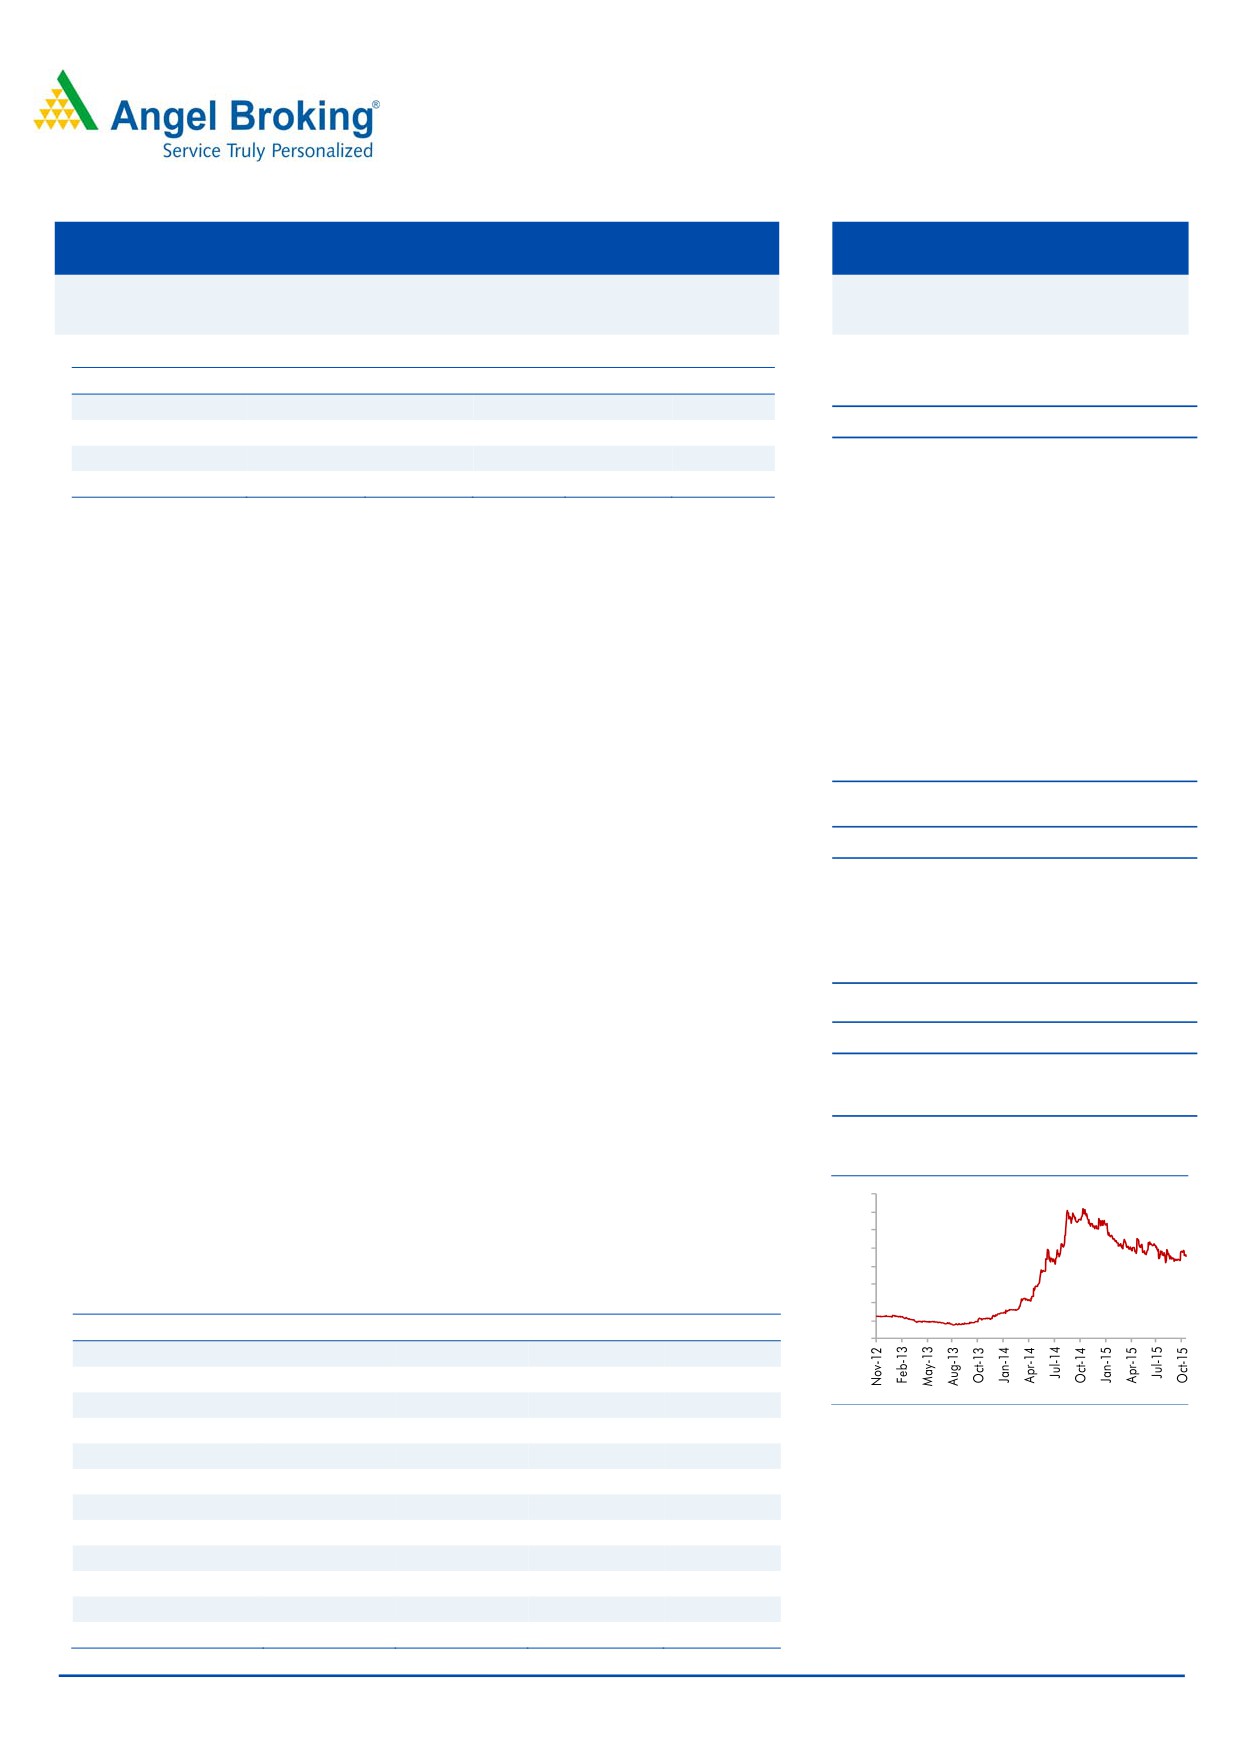
3-year price chart
company’s volume growth in the automotive chains segment is expected to improve over
800
FY2015-17E with its key clients like HMCL, HMSI, Yamaha, TVS Motor and others having
700
600
plans of capacity expansion and with they launching new models. We have a Neutral rating
500
on the stock.
400
300
Key financials (Consolidated)
200
100
Y/E March (` cr)
FY2014
FY2015
FY2016E
FY2017E
0
Net Sales
1,109
1,173
1,196
1,277
% chg
15.9
5.8
2.0
6.7
Adj. Net Profit
63
71
55
64
Source: Company, Angel Research
% chg
92.0
5.1
(16.2)
16.3
EBITDA margin (%)
11.4
12.1
11.7
12.2
EPS (`)
40.0
45.4
35.3
41.0
P/E (x)
11.4
10.8
12.9
11.1
P/BV (x)
2.3
2.0
1.7
1.5
RoE (%)
20.3
19.3
13.3
13.6
RoCE (%)
20.3
19.4
16.3
16.7
Amarjeet S Maurya
EV/Sales (x)
0.8
0.7
0.7
0.7
022-39357800 Ext: 6831
EV/EBITDA (x)
6.7
6.0
6.0
5.4
Source: Company, Angel Research; Note: CMP as of November 4, 2015
Please refer to important disclosures at the end of this report
1
L G Balakrishnan & Bros | 2QFY2016 Result Update
Exhibit 1: Quarterly performance (Standalone)
Y/E March (` cr)
2QFY16
2QFY15
% yoy
2QFY16
% qoq
FY2015
FY2014
% chg
Net Sales
282
267
5.6
247
14.1
1,048
988
6.1
Consumption of RM
126
122
3.1
110
14.8
486
483
0.6
(% of Sales)
44.8
45.9
44.5
46.4
48.9
Staff Costs
37
32
13.1
35
3.7
130
115
12.7
(% of Sales)
13.0
12.2
14.3
12.4
11.7
Operating Expense
83
76
9.2
77
7.2
303
278
9.3
(% of Sales)
29.4
28.4
31.3
28.9
28.1
Total Expenditure
246
231
6.5
223
10.4
919
876
5.0
Operating Profit
36
36
(0.2)
24
47.7
129
112
15.1
OPM (%)
12.8
13.5
9.8
12.3
11.3
Interest
4.5
4
11.1
4
6.0
16
17
Depreciation
10
10
4.3
9
10.7
37
31
19.0
Other Income
1
7
(85.2)
1
54.6
3
5
(40.0)
Exceptional items
7
PBT
22
29
(24.0)
11
95.3
85
69
23.7
(% of Sales)
7.8
10.8
4.5
8.1
6.9
Provision for Taxation
5
7
(37.7)
2
106.4
20
14
43.6
(% of PBT)
20.8
25.4
19.7
24.0
20.7
Minority Interest
0
0
Reported PAT
17
22
(19.4)
9.0
92.5
64
54
18.5
Adj. PAT
17
17
4.6
9.0
92.5
64
54
18.5
Source: Company, Angel Research
2
November 5, 2015
L G Balakrishnan & Bros | 2QFY2016 Result Update
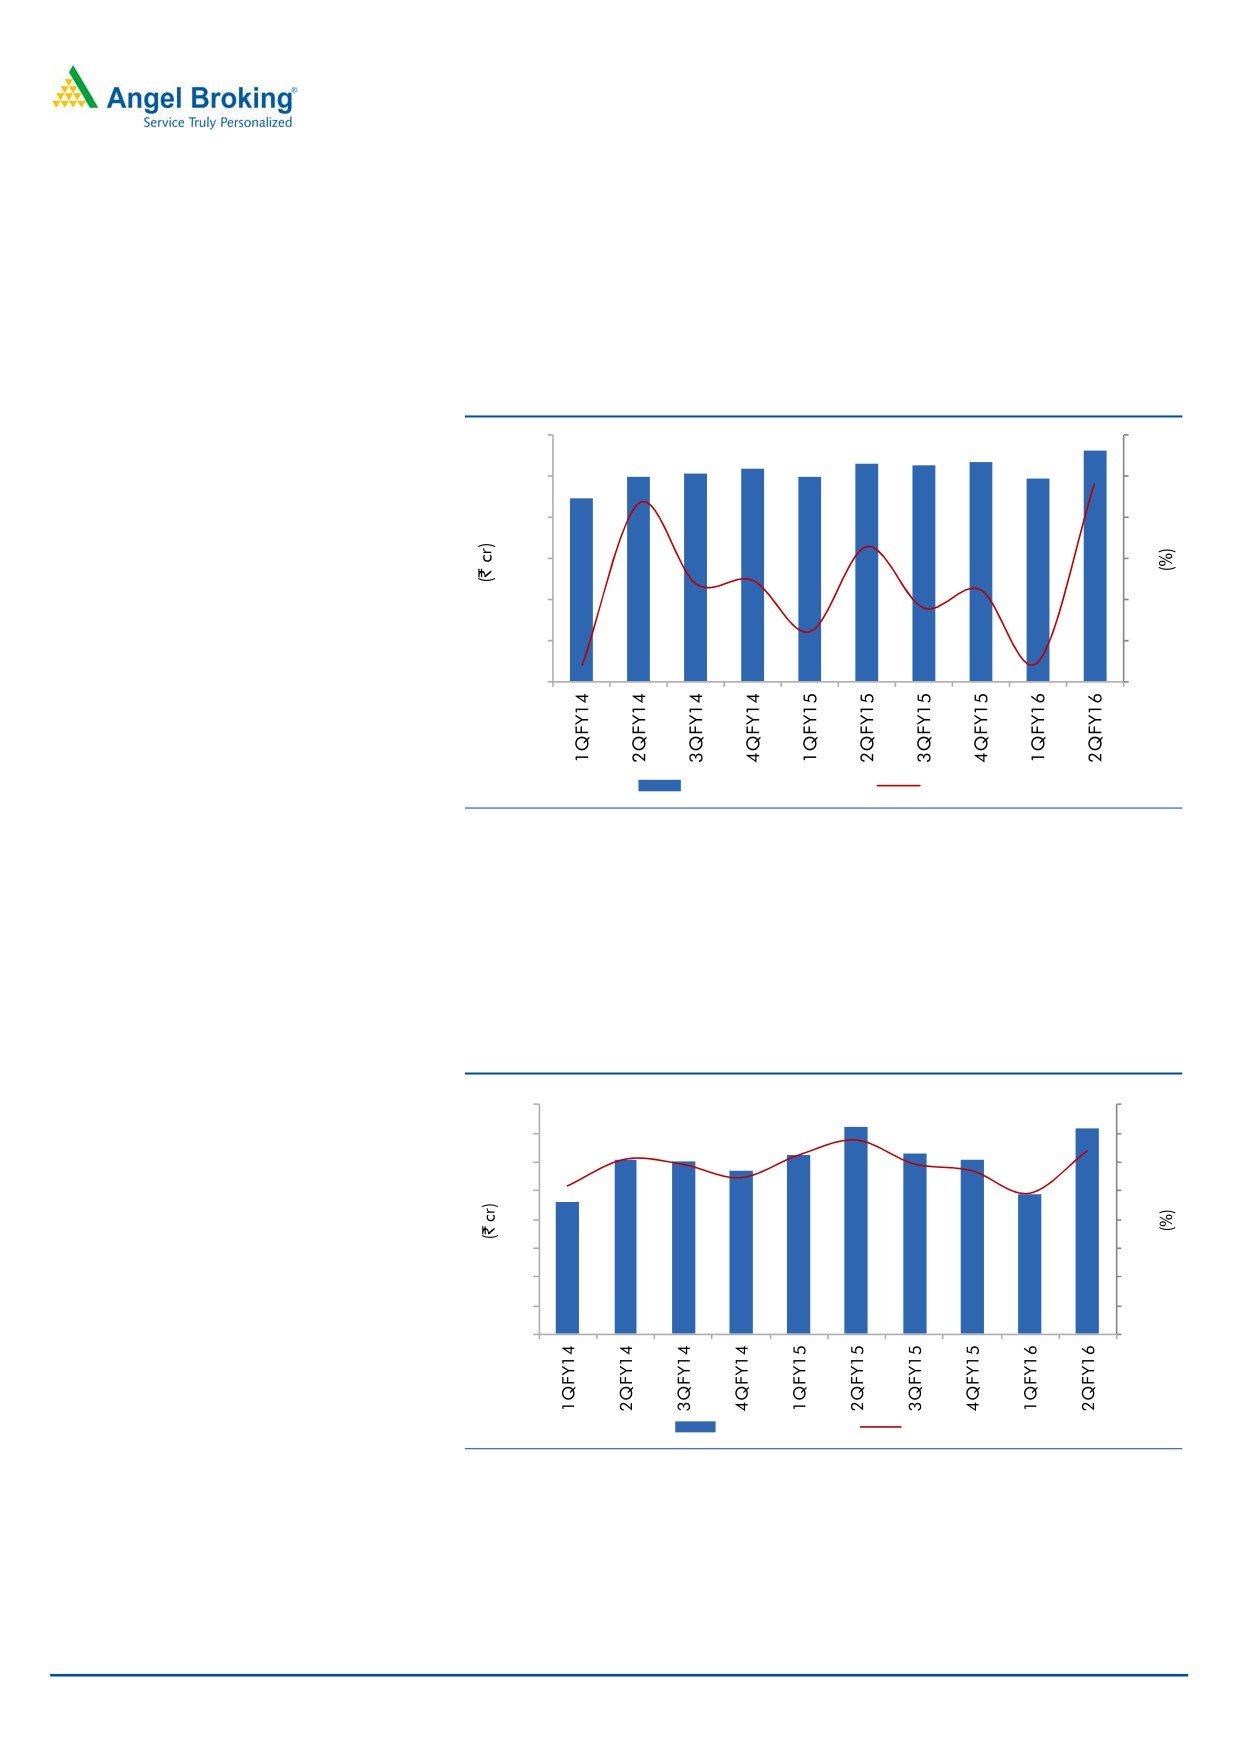
Top-line grows ~6% yoy
The standalone top-line grew by ~6% yoy to ~`282cr, which is higher than our
estimate of ~`267cr. The Transmission segment revenue was up ~11% yoy; the
segment accounted for ~79% of the standalone revenue of the company. The
Others segment reported a decline in sales.
Exhibit 2: Top-line growth trend
300
20
250
15
200
10
150
5
100
0
50
(5)
0
(10)
Standalone net sales
QoQ growth (%)
Source: Company, Angel Research
Operating margin contracts by 74bp yoy
The company reported an operating profit of ~`36cr, which is down 0.2% yoy. The
operating margin contracted by 74bp yoy to 12.8%, primarily on account of higher
employee costs and other expenditure.
Exhibit 3: Operating profit and margin trend
40
16
35
14
30
12
25
10
20
8
15
6
10
4
5
2
0
0
Operating profit
Margin (%)
Source: Company, Angel Research
3
November 5, 2015
L G Balakrishnan & Bros | 2QFY2016 Result Update
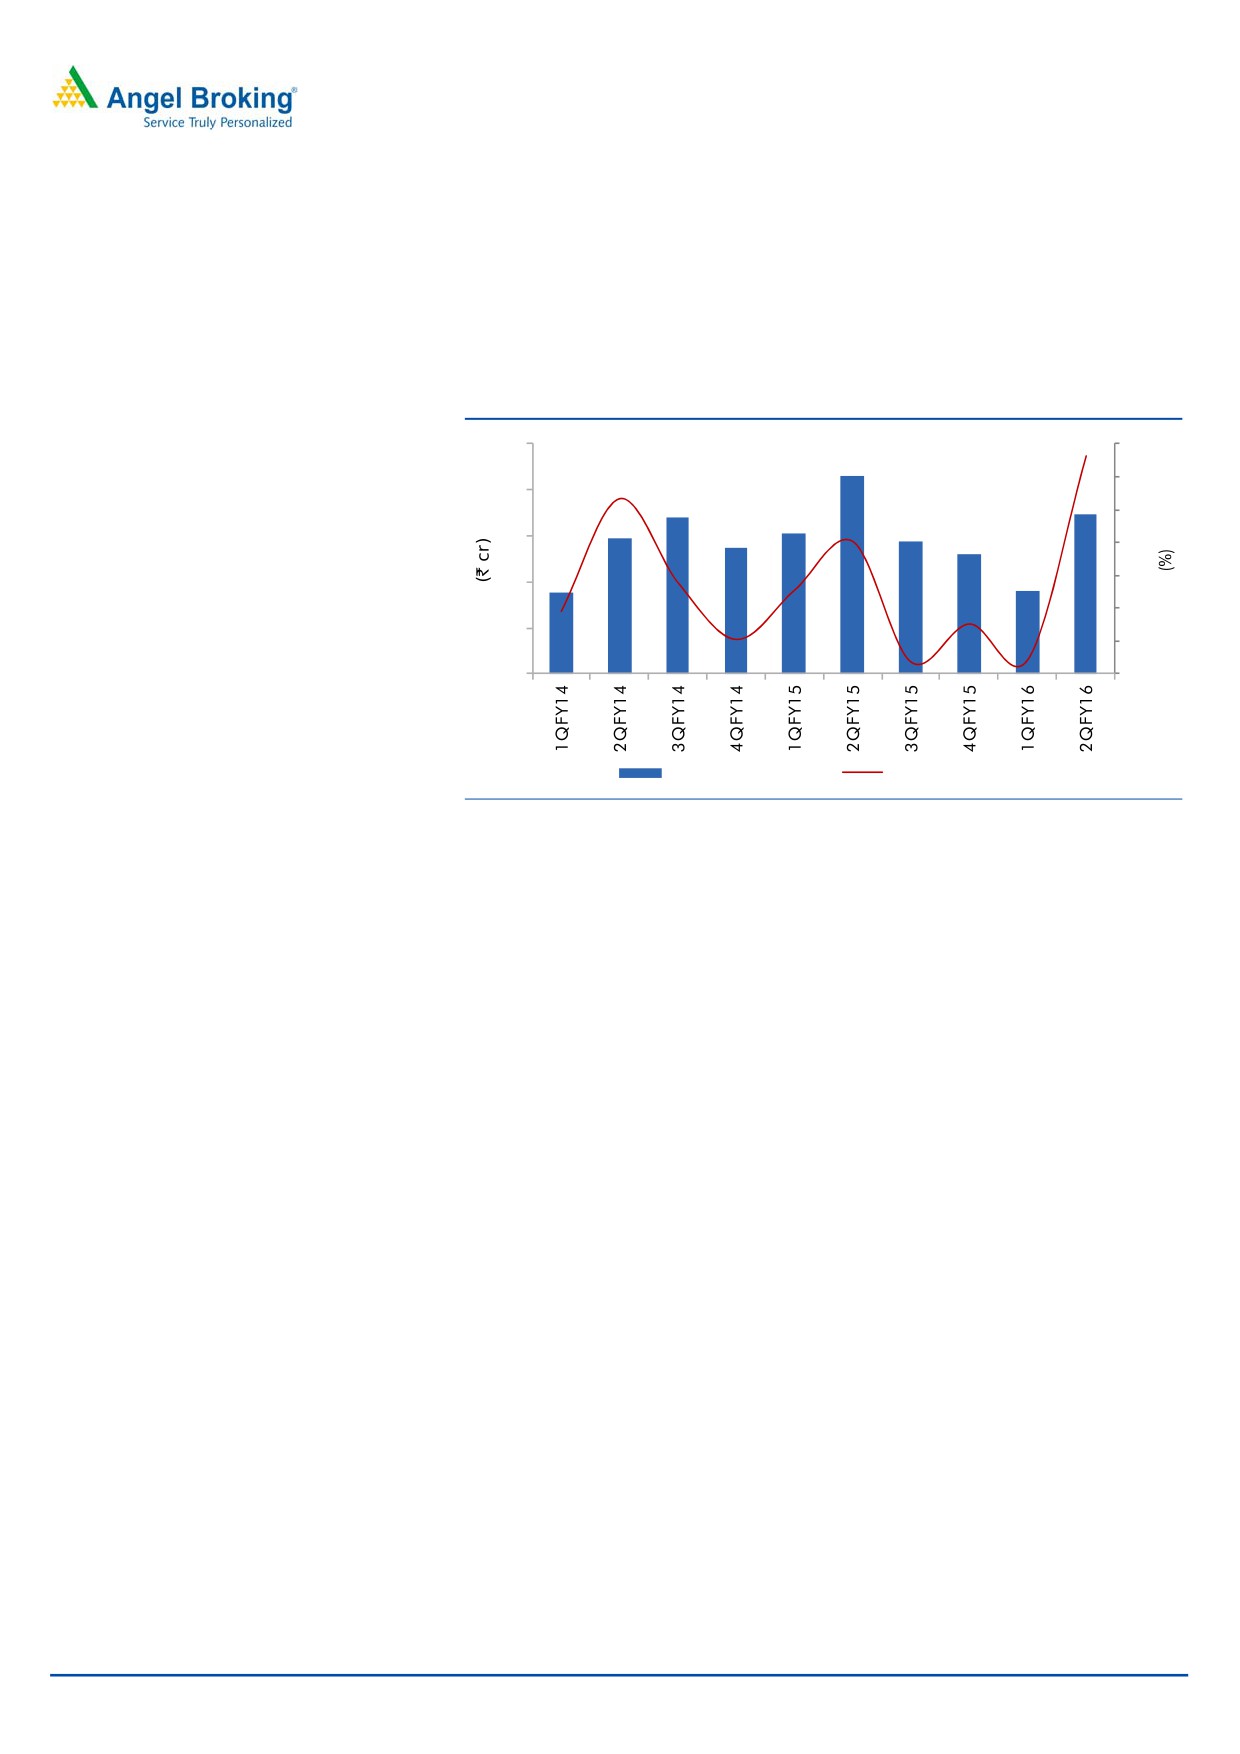
Subdued top-line growth, poor operating performance and
lower other income drag profitability
The reported standalone net profit declined by ~19% yoy to ~`17cr, but is higher than
our estimate of ~`16cr. However, on adjusting for the one-time exceptional gain
incurred in 2QFY2015, the PAT during 2QFY2016 actually grew by 5% yoy.
Exhibit 4: Net Profit trend
25
100
80
20
60
15
40
20
10
0
5
(20)
0
(40)
Standalon net profit
QoQ growth (%)
Source: Company, Angel Research
Investment rationale
Capacity expansion at key clients to drive growth for LGBBL
The company’s automotive chains segment caters to the OEM market for
two-wheelers. In the OEM segment, where the company has a 70% market share,
the company has tied up with leading two-wheeler players like Bajaj Auto, Hero
MotoCorp (HMCL), Honda Motorcycle and Scooter India (HMSI), TVS Motor,
Yamaha Motor etc., all of which have good growth prospects. These OEMs are
increasing their capacity and also entering newer geographies for export which
would drive growth of the industry. Hence, going forward, we believe that
expansion plans at various OEM clients would trigger volume growth for LGBBL.
4
November 5, 2015
L G Balakrishnan & Bros | 2QFY2016 Result Update
Outlook and valuation
LGBBL is a market leader in two-wheeler automotive chains with ~70% market
share in the OEM segment. The company has been reporting lower growth in
earnings since the last three quarters, which is mainly due to overall slowdown in
the two-wheeler industry. The two-wheeler industry has been impacted mainly due
to rural slowdown. However, sales are expected to rebound in 2HFY2016 on
expectations of a normal monsoon which will boost crop output, thus leading to
revival in rural demand. The company’s volume growth in the automotive chains
segment is expected to improve over FY2015-17E with its key clients like HMCL,
HMSI, Yamaha, TVS Motor and others having plans of capacity expansion and
with they launching new models. We have a Neutral rating on the stock.
Company Background
LG Balakrishnan & Bros Ltd is engaged in the manufacturing of chains, sprockets
and metal formed parts for automotive applications. It operates in three segments:
Transmission, Metal Forming and Others. The company's Transmission products
include chains, sprockets, tensioners, belts and brake shoe. The company's Metal
Forming products include fine blanking for precision sheet metal parts, machined
components and wire drawing products for internal use as well as for other chain
manufacturing plants, spring steel suppliers, and umbrella manufacturers. The
company's Others segment includes trading goods. It has manufacturing units
spread across Tamil Nadu, Maharashtra, Uttarakhand, Karnataka and Delhi.
5
November 5, 2015
L G Balakrishnan & Bros | 2QFY2016 Result Update
Profit and Loss Statement(Consolidated)
Y/E March (` cr)
FY12
FY13
FY14
FY15
FY16E
FY17E
Total operating income
913
956
1,109
1,173
1,196
1,277
% chg
27.7
4.8
15.9
5.8
2.0
6.7
Total Expenditure
809
867
982
1,031
1,056
1,121
Cost of Materials
484
511
545
550
563
599
Personnel
88
100
134
150
156
169
Others
238
256
303
331
337
354
EBITDA
104
89
126
142
140
156
% chg
19.1
(13.8)
41.2
12.4
(1.3)
11.3
(% of Net Sales)
11.4
9.3
11.4
12.1
11.7
12.2
Depreciation& Amortisation
29
30
33
39
46
51
EBIT
75
59
93
102
94
105
% chg
22.3
(20.6)
57.0
9.6
(8.5)
12.3
(% of Net Sales)
8.2
6.2
8.4
8.7
7.8
8.2
Interest & other Charges
18
23
18
18
18
18
Other Income
2
4
5
3
4
5
(% of PBT)
2.9
9.5
5.7
3.1
5.0
5.4
Share in profit of Associates
-
-
-
-
-
-
Recurring PBT
59
40
80
87
80
92
% chg
22.5
(31.5)
98.4
9.1
(8.4)
15.7
Prior Period & Extra. Exp./(Inc.)
-
-
-
(7)
-
-
PBT (reported)
59
40
80
94
80
92
Tax
15
8
15
20
22
26
(% of PBT)
24.9
19.1
18.6
21.8
28.0
28.0
PAT (reported)
44
33
65
73
58
67
Add: Share of earnings of asso.
-
-
1
1
1
1
Less: Minority interest (MI)
-
(0)
3
3
3
3
PAT after MI (reported)
44
33
63
71
55
64
ADJ. PAT
44
33
63
66
55
64
% chg
(4.5)
(26.0)
92.0
5.1
(16.2)
16.3
(% of Net Sales)
4.8
3.4
5.7
5.6
4.6
5.0
Basic & Fully Diluted EPS (`)
28.2
20.8
40.0
45.4
35.3
41.0
Adjusted EPS (`)
28.2
20.8
40.0
42.1
35.3
41.0
% chg
(4.5)
(26.0)
92.0
5.1
(16.2)
16.3
6
November 5, 2015
L G Balakrishnan & Bros | 2QFY2016 Result Update
Balance sheet(Consolidated)
Y/E March (` cr)
FY12
FY13
FY14
FY15
FY16E
FY17E
SOURCES OF FUNDS
Equity Share Capital
8
8
8
16
16
16
Reserves& Surplus
225
251
301
354
402
458
Shareholders Funds
233
258
309
370
418
473
Minority Interest
-
5
10
10
10
10
Total Loans
138
168
150
157
157
157
Deferred Tax Liability
18
18
17
17
17
17
Total Liabilities
388
450
486
554
602
657
APPLICATION OF FUNDS
Gross Block
367
428
486
556
636
716
Less: Acc. Depreciation
171
200
231
271
317
368
Net Block
197
228
255
285
319
348
Capital Work-in-Progress
3
3
9
12
14
14
Investments
14
19
18
18
18
18
Current Assets
341
372
408
433
456
505
Inventories
193
196
208
230
229
245
Sundry Debtors
109
124
146
147
151
161
Cash
6
10
7
7
14
19
Loans & Advances
33
41
47
47
60
77
Other Assets
0
1
0
1
2
4
Current liabilities
166
172
204
194
205
228
Net Current Assets
175
200
204
239
251
278
Mis. Exp. not written off
-
-
-
-
-
-
Total Assets
388
450
486
554
602
657
7
November 5, 2015
L G Balakrishnan & Bros | 2QFY2016 Result Update
Cash flow statement(Consolidated)
Y/E March (` cr)
FY12
FY13
FY14
FY15
FY16E
FY17E
Profit before tax
59
40
80
87
80
92
Depreciation
29
30
33
39
46
51
Change in Working Capital
(49)
(12)
(15)
(34)
(6)
(21)
Interest / Dividend (Net)
17
23
18
18
18
18
Direct taxes paid
(17)
(8)
(17)
(20)
(22)
(26)
Others
(1)
(3)
(3)
7
-
-
Cash Flow from Operations
38
70
96
96
115
114
(Inc.)/ Dec. in Fixed Assets
(30)
(58)
(61)
(73)
(82)
(80)
(Inc.)/ Dec. in Investments
-
(5)
0
1
-
-
Cash Flow from Investing
(30)
(63)
(60)
(72)
(82)
(80)
Issue of Equity
-
6
-
8
-
-
Inc./(Dec.) in loans
20
-
-
7
-
-
Dividend Paid (Incl. Tax)
(9)
(15)
(6)
(13)
(9)
(11)
Interest / Dividend (Net)
(18)
7
(33)
(26)
(18)
(18)
Cash Flow from Financing
(8)
(2)
(39)
(23)
(27)
(29)
Inc./(Dec.) in Cash
1
5
(4)
1
6
5
Opening Cash balances
5
6
10
7
7
14
Closing Cash balances
6
10
7
7
14
19
8
November 5, 2015
L G Balakrishnan & Bros | 2QFY2016 Result Update
Key ratios
Y/E March
FY12
FY13
FY14
FY15
FY16E FY17E
Valuation Ratio (x)
P/E (on FDEPS)
16.2
21.9
11.4
10.8
12.9
11.1
P/CEPS
9.8
11.4
7.5
6.5
7.0
6.2
P/BV
3.1
2.8
2.3
2.0
1.7
1.5
Dividend yield (%)
1.1
1.2
0.8
1.3
1.3
1.5
EV/Sales
0.9
0.9
0.8
0.7
0.7
0.7
EV/EBITDA
8.1
9.6
6.7
6.0
6.0
5.4
EV / Total Assets
1.5
1.4
1.2
1.1
1.0
0.9
Per Share Data (`)
EPS (Basic)
28.2
20.8
40.0
45.4
35.3
41.0
EPS (fully diluted)
28.2
20.8
40.0
45.4
35.3
41.0
Cash EPS
46.5
39.9
60.9
70.5
64.8
73.3
DPS
5.0
5.5
3.8
6.0
6.0
7.0
Book Value
146.5
163.0
195.2
233.8
264.4
299.9
Returns (%)
RoCE
20.2
13.9
20.3
19.4
16.3
16.7
Angel RoIC (Pre-tax)
21.3
15.0
21.5
20.4
17.2
17.7
RoE
19.0
12.7
20.3
19.3
13.3
13.6
Turnover ratios (x)
Asset Turnover
2.5
2.2
2.3
2.1
1.9
1.8
Inventory / Sales (days)
77
75
68
72
70
70
Receivables (days)
44
47
48
46
46
46
Payables (days)
45
48
49
47
50
53
Net WC (days)
76
74
67
70
66
63
9
November 5, 2015
L G Balakrishnan & Bros | 2QFY2016 Result Update
Research Team Tel: 022 - 39357800
DISCLAIMER
Angel Broking Private Limited (hereinafter referred to as “Angel”) is a registered Member of National Stock Exchange of India Limited,
Bombay Stock Exchange Limited and Metropolitan Stock Exchange of India Limited. It is also registered as a Depository Participant with
CDSL and Portfolio Manager with SEBI. It also has registration with AMFI as a Mutual Fund Distributor. Angel Broking Private Limited is
a registered entity with SEBI for Research Analyst in terms of SEBI (Research Analyst) Regulations, 2014 vide registration number
INH000000164. Angel or its associates has not been debarred/ suspended by SEBI or any other regulatory authority for accessing
/dealing in securities Market. Angel or its associates including its relatives/analyst do not hold any financial interest/beneficial
ownership of more than 1% in the company covered by Analyst. Angel or its associates/analyst has not received any compensation /
managed or co-managed public offering of securities of the company covered by Analyst during the past twelve months. Angel/analyst
has not served as an officer, director or employee of company covered by Analyst and has not been engaged in market making activity
of the company covered by Analyst.
This document is solely for the personal information of the recipient, and must not be singularly used as the basis of any investment
decision. Nothing in this document should be construed as investment or financial advice. Each recipient of this document should
make such investigations as they deem necessary to arrive at an independent evaluation of an investment in the securities of the
companies referred to in this document (including the merits and risks involved), and should consult their own advisors to determine
the merits and risks of such an investment.
Reports based on technical and derivative analysis center on studying charts of a stock's price movement, outstanding positions and
trading volume, as opposed to focusing on a company's fundamentals and, as such, may not match with a report on a company's
fundamentals.
The information in this document has been printed on the basis of publicly available information, internal data and other reliable
sources believed to be true, but we do not represent that it is accurate or complete and it should not be relied on as such, as this
document is for general guidance only. Angel Broking Pvt. Limited or any of its affiliates/ group companies shall not be in any way
responsible for any loss or damage that may arise to any person from any inadvertent error in the information contained in this report.
Angel Broking Pvt. Limited has not independently verified all the information contained within this document. Accordingly, we cannot
testify, nor make any representation or warranty, express or implied, to the accuracy, contents or data contained within this document.
While Angel Broking Pvt. Limited endeavors to update on a reasonable basis the information discussed in this material, there may be
regulatory, compliance, or other reasons that prevent us from doing so.
This document is being supplied to you solely for your information, and its contents, information or data may not be reproduced,
redistributed or passed on, directly or indirectly.
Neither Angel Broking Pvt. Limited, nor its directors, employees or affiliates shall be liable for any loss or damage that may arise from
or in connection with the use of this information.
Note: Please refer to the important ‘Stock Holding Disclosure' report on the Angel website (Research Section). Also, please refer to the
latest update on respective stocks for the disclosure status in respect of those stocks. Angel Broking Pvt. Limited and its affiliates may
have investment positions in the stocks recommended in this report.
Disclosure of Interest Statement
L G Balakrishnan & Bros
1. Analyst ownership of the stock
No
2. Angel and its Group companies ownership of the stock
No
3. Angel and its Group companies' Directors ownership of the stock
No
4. Broking relationship with company covered
No
Note: We have not considered any Exposure below ` 1 lakh for Angel, its Group companies and Directors
Ratings (Based on expected returns
Buy (> 15%)
Accumulate (5% to 15%)
Neutral (-5 to 5%)
over 12 months investment period):
Reduce (-5% to -15%)
Sell (< -15)
10
November 5, 2015