1QFY2018 Result Update | Banking
August 4, 2017
Karur Vysya Bank
ACCUMULATE
CMP
`140
Performance Highlights
Target Price
`160
Particulars (` cr)
1QFY18 4QFY17
% chg (qoq) 1QFY17
% chg (yoy)
Investment Period
12 months
NII
539
580
(7)
481
12
Pre-prov. profit
449
508
(12)
283
59
Stock Info
PAT
148
219
(32)
146
1
Source: Company, Angel Research
Sector
Banks
KVB’s 1QFY18 results were in line with expectations. While PAT remained flat YoY
Market Cap (` cr)
8,530
and loan growth remained 7.7%, overall growth should pick in 2HFY18. While
Beta
0.7
slippages were high during the quarter, they were largely from the watch list. Next
52 Week High / Low
153/80
two quarters could be challenging, but FY19 looks much stronger for the bank.
Avg. Daily Volume
1,11,269
Loan continued to be in single digit; however the management commentary
remains positive: For FY17 KVB had a muted loan growth of 4.7% and the
Face Value (`)
2
management had indicated at pick up in credit growth in FY18. Growth for
BSE Sensex
32,325
1QFY18 too remained tepid at 7.7%. Loan to corporate grew by 4%, while retail
Nifty
10,066
loans had a decent growth of 10% However, the management remains confident
of achieving double digit growth in FY18, which we believe is doable. We have
Reuters Code
KARU.BO
factored in 10%/12% growth in advances for FY18/19 respectively.
Bloomberg Code
KVB@IN
Deposit growth has been in sync with loan growth: Overall deposits grew by 7.8%
which is in sync with the growth in loan book. However, the CASA growth
continued to outpace the overall growth, up 29.4% and accordingly the CASA
Shareholding Pattern (%)
ratio has improved further to 29.2% vs 27.7% QoQ. KVB had seen a 590 bps
Promoters
2.1
jump in its CASA base post demonetization; though there were some outflows in
the deposits subsequently, overall CASA ratio remains fairly strong.
MF / Banks / Indian Fls
30.4
Slippages remained elevated, however were largely from the watch list: Slippages
FII / NRIs / OCBs
21.0
during the quarter stood at `389 cr, though it was lower than `560 cr in Q4FY17,
Indian Public / Others
46.5
overall it remained elevated. During the quarter one large account slipped from
the watch list and few more accounts remain under stress. At the end of Q4FY17
the management had indicated at around `650 cr under watch list and with the
Abs.(%)
3m 1yr 3yr
one large account slipping into NPA , the watch list is down to `450 cr. On QoQ
basis GNPAs & NNPAs went up 69 bps and 32 bps to 4.27% and 2.85%.With
Sensex
8.5
16.1
26.3
recovery process gaining steam we expect overall GNPAs to be under control.
KVB
16.0
44.0
49.0
Outlook and valuation: While credit cost will still remain elevated in FY18, we
expect FY19 to be a more meaningful year for the bank with RoE improving to
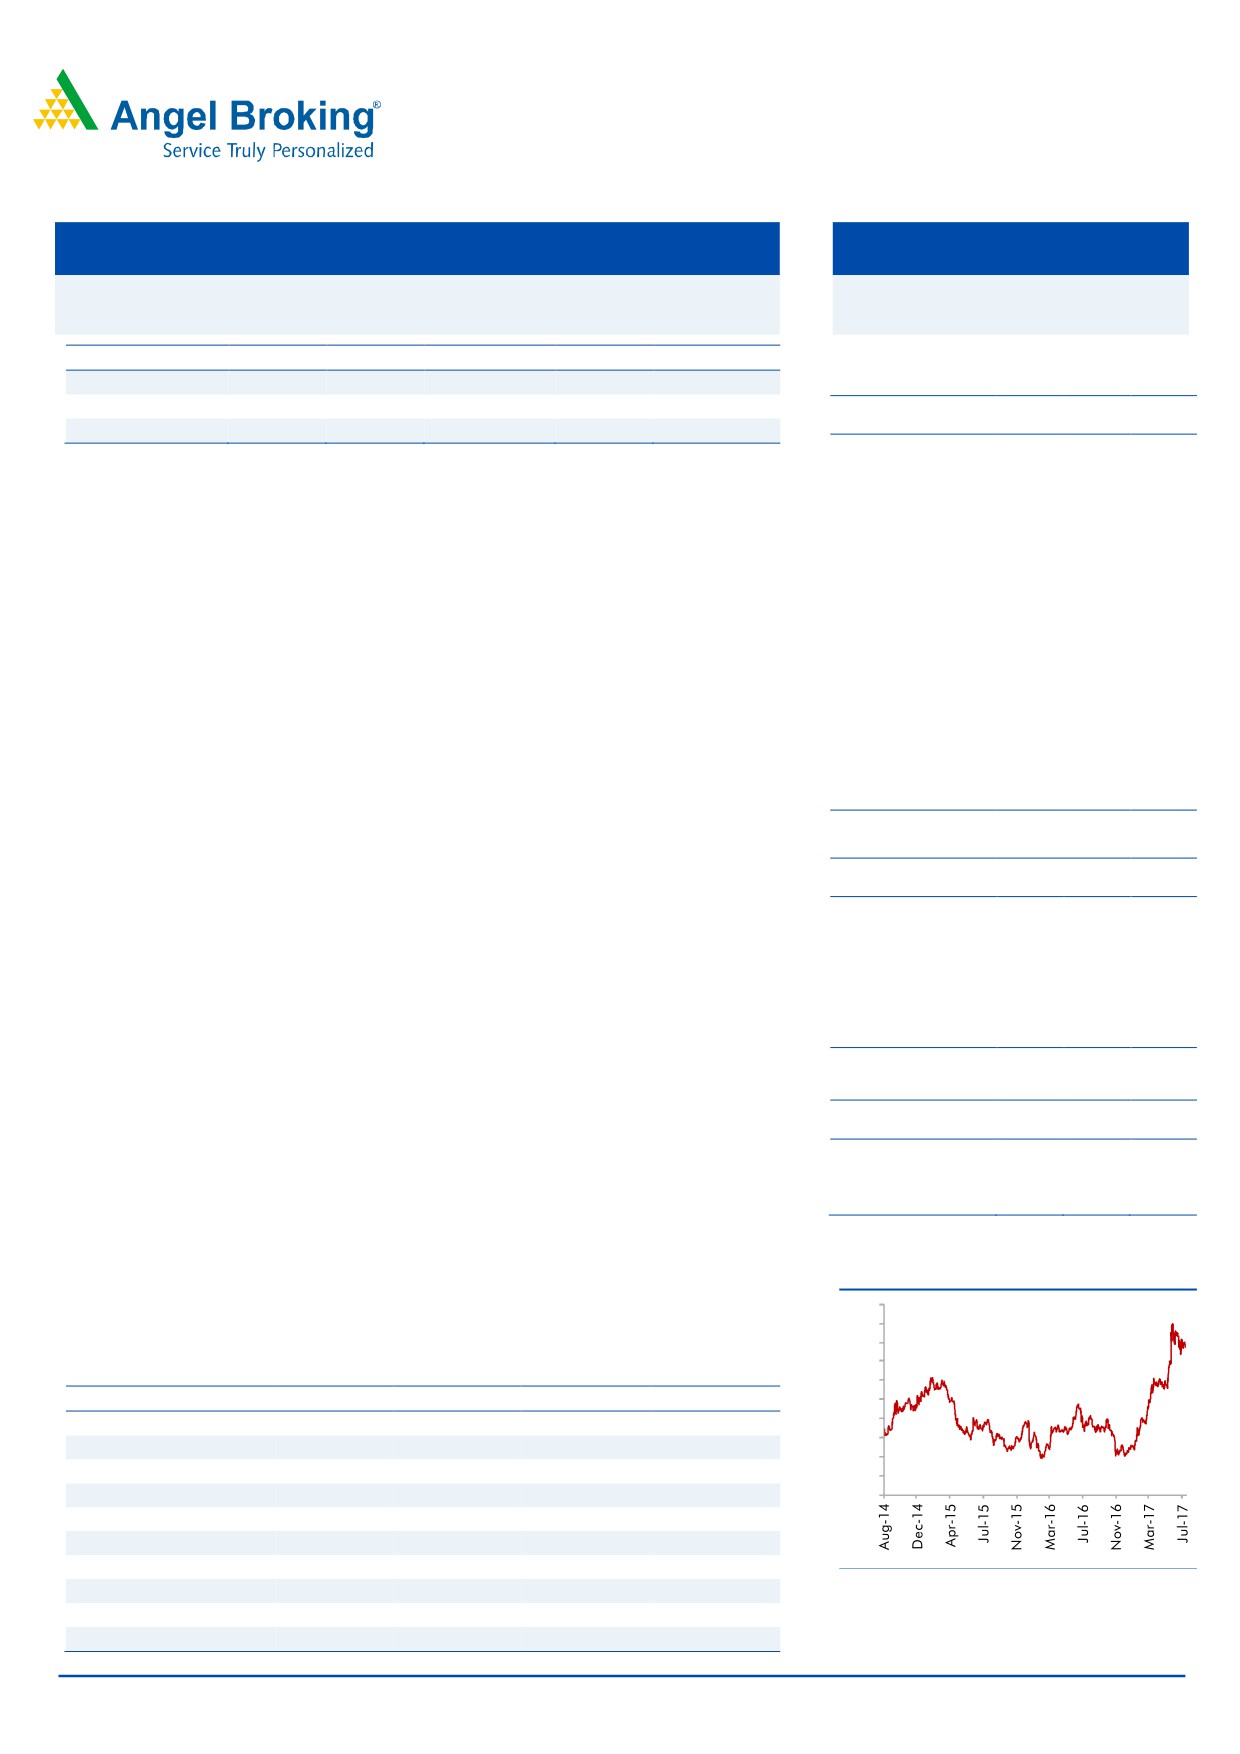
3- Year Daily Price Chart
14.7% from 12.6% in FY17. Despite the recent run up, the stock is trading at 1.6x
160
it FY19 Adj BV, and we believe this leaves further scope for re-rating. We
150
maintain ACCUMULATE on the stock with a target price of `160.
140
130
Key financials (standalone)
120
Y/E March (` cr)
FY2016
FY2017
FY2018E
FY2019E
110
100
NII
1,781
2,074
2,388
2,757
90
% chg
21.5
16.4
15.1
15.4
80
Net profit
568
607
660
858
70
% chg
24.7
6.9
8.8
29.9
60
NIM (%)
3.2
3.5
3.7
3.9
EPS (`)
9.3
10.0
10.8
14.1
P/E (x)
15.0
14.1
12.9
9.9
P/ABV (x)
2.0
2.1
1.9
1.6
Siddharth Purohit
RoA (%)
1.0
1.0
1.0
1.2
RoE (%)
12.9
12.6
12.5
14.7
022 - 3935 7800 Ext: 6872
Source: Company, Angel Research; Note: CMP as of August 04, 2017
Please refer to important disclosures at the end of this report
1
Karur Vysya Bank | 1QFY2018 Result Update
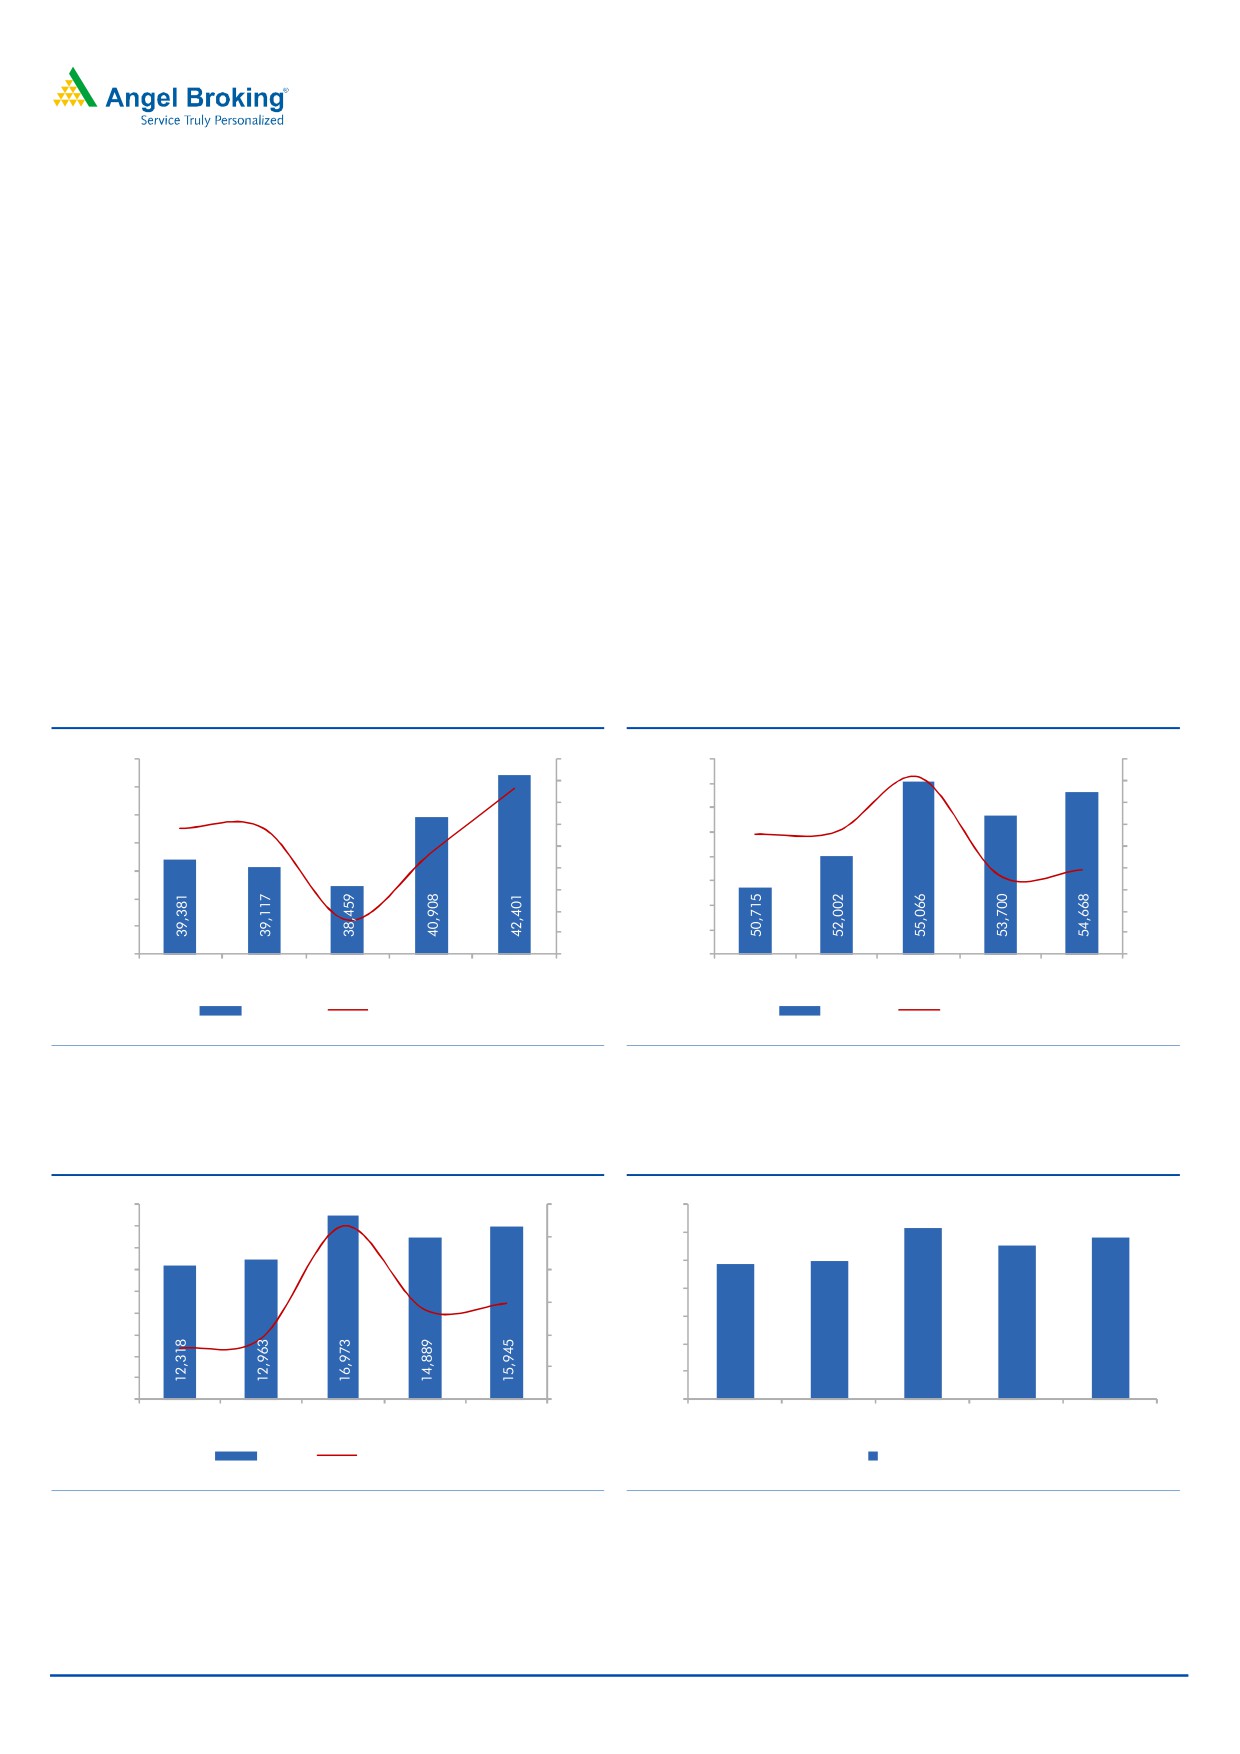
Exhibit 1: Income Statement (Quarterly )
Particulars (` cr)
Q3FY16
Q4FY16
Q1FY17
Q2FY17
Q3FY17
Q4FY17
Q1FY18
% YoY
% QoQ
Interest earned
1,352
1,370
1,385
1,393
1,411
1,433
1,384
(0.1)
(3)
Interest expenses
904
898
904
898
894
853
846
(6.5)
(1))
Net interest income
448
473
481
495
518
580
539
11.9
(7)
Non Interest Income
173
166
162
218
170
233
236
45.7
1.3
Operating income
621
639
643
713
688
813
775
20.4
(5)
Operating expenses
295
380
360
393
416
305
325
(9.7)
6.7
Pre-prov. profit
326
259
283
320
272
508
449
58.8
(12)
Provisions & cont.
93
-13
67
119
94
218
233
248.8
7.3
PBT
233
271
216
200
178
291
216
(0.1)
(26)
Prov. for taxes
80
134
70
74
62
72
68
(2.5)
(5.6)
PAT
153
138
146
126
116
219
148
1.1
(32)
EPS (`)
2.5
2.3
2.4
2.1
1.9
3.6
2.4
1.1
(32.4)
Effective tax rate (%)
34.4
49.2
32.3
36.9
34.8
24.8
31.5
(2.4)
27
Source: Company, Angel Research
Exhibit 2: Loan Break Up & Growth (%)
Advances Break Up
Q4FY16 Q1FY17
Q2FY17 Q3FY17 Q4FY17
Q1FY18
Commercial
32%
33%
34%
34%
33%
34%
Agriculture
18%
18%
18%
17%
17%
18%
Retail
15%
15%
16%
16%
15%
16%
Corporate
35%
34%
33%
34%
35%
32%
Advances Growth Break Up
Total Advances
7.6%
5.8%
5.4%
1.6%
5.0%
7.7%
Commercial
8.4%
9.5%
9.4%
7.0%
6.7%
11.7%
Agriculture
12.7%
12.0%
10.2%
3.1%
-0.8%
5.1%
Retail
12.2%
11.5%
11.4%
7.4%
7.1%
9.7%
Corporate
2.7%
-2.6%
-3.0%
-6.4%
5.4%
4.2%
Source: Company, Angel Research
Exhibit 3: Loan Book Break Up (` Cr )
Loan Book Composition
Q1FY17 Q2FY17 Q3FY17 Q4FY17
Q1FY18
Total Advances
39,381
39,537
38,460
41,435
42,401
Commercial
12,905
13,303
13,035
13,612
14,411
Agriculture
7,265
6,950
6,442
6,979
7,635
Retail
6,009
6170
6,093
6340
6592
Corporate
13,202
13,114
12,890
14,504
13,763
Source: Company, Angel Research
August 4, 2017
2
Karur Vysya Bank | 1QFY2018 Result Update
Loan growth continued to be in single digit; however the management
commentary remains positive: For FY17 KVB had a muted loan growth of 4.7%
and the management had indicated at pick up in credit growth in FY18. Growth
for 1QFY18 too remained tepid at 7.7%. Loan to corporate grew by 4%, while
retail loans had a decent growth of 10%. However, the management remains
confident of achieving double digit growth in FY18, which we believe is doable.
We have factored in 10% /12% growth in advances for FY18 /19 respectively. The
management had earlier expected a 15% growth in FY18; however, given the lack
of overall credit demand we believe 10-12% would be more realistic for the bank.
Deposit growth has been in sync with loan growth: Overall deposits grew by 7.8 %
which is in sync with the growth in loan book. However, the CASA growth
continued to outpace the overall growth, up 29.4% and accordingly the CASA ratio
has improved further to 29.2% vs 27.7% QoQ. KVB had seen a 590 bps jump in
its CASA base post demonetization; though there were some outflows in the
deposits subsequently the overall CASA ratio remains fairly strong.
Exhibit 4: Loan growth momentum was strong
Exhibit 5: Deposit growth also remained strong
43,000
9.0
56,000
16.3
18.0
7.7
8.0
55,000
7.8
16.0
42,000
4.7
7.0
7.2
14.0
5.8
5.8
54,000
11.3
41,000
11.1
6.0
12.0
53,000
40,000
5.0
10.0
52,000
39,000
1.5
4.0
8.0
51,000
3.0
6.0
38,000
2.0
50,000
4.0
37,000
49,000
1.0
2.0
36,000
0.0
48,000
0.0
Q1FY17
Q2FY17
Q3FY17
Q4FY17
Q1FY18
Q1FY17
Q2FY17
Q3FY17
Q4FY17
Q1FY18
Advances
% Growth YoY
Deposits
% Growth YoY
Source: Company, Angel Research
Source: Company, Angel Research
Exhibit 6: CASA Growth strong as well
Exhibit 7: CASA Ratio has improved further (%)
18,000
53.3
60.0
35.0
29.4
30.8
27.5
29.2
16,000
27.7
50.0
30.0
14,000
15.7
18.8
24.3
24.9
25.0
12,000
40.0
10,000
20.0
30.0
8,000
15.0
6,000
20.0
10.0
4,000
10.0
5.0
2,000
-
0.0
0.0
Q1FY17
Q2FY17
Q3FY17
Q4FY17
Q1FY18
Q1FY17
Q2FY17
Q3FY17
Q4FY17
Q1FY18
CASA
Growth % YoY
CASA ( % )
Source: Company, Angel Research
Source: Company, Angel Research
August 4, 2017
3
Karur Vysya Bank | 1QFY2018 Result Update
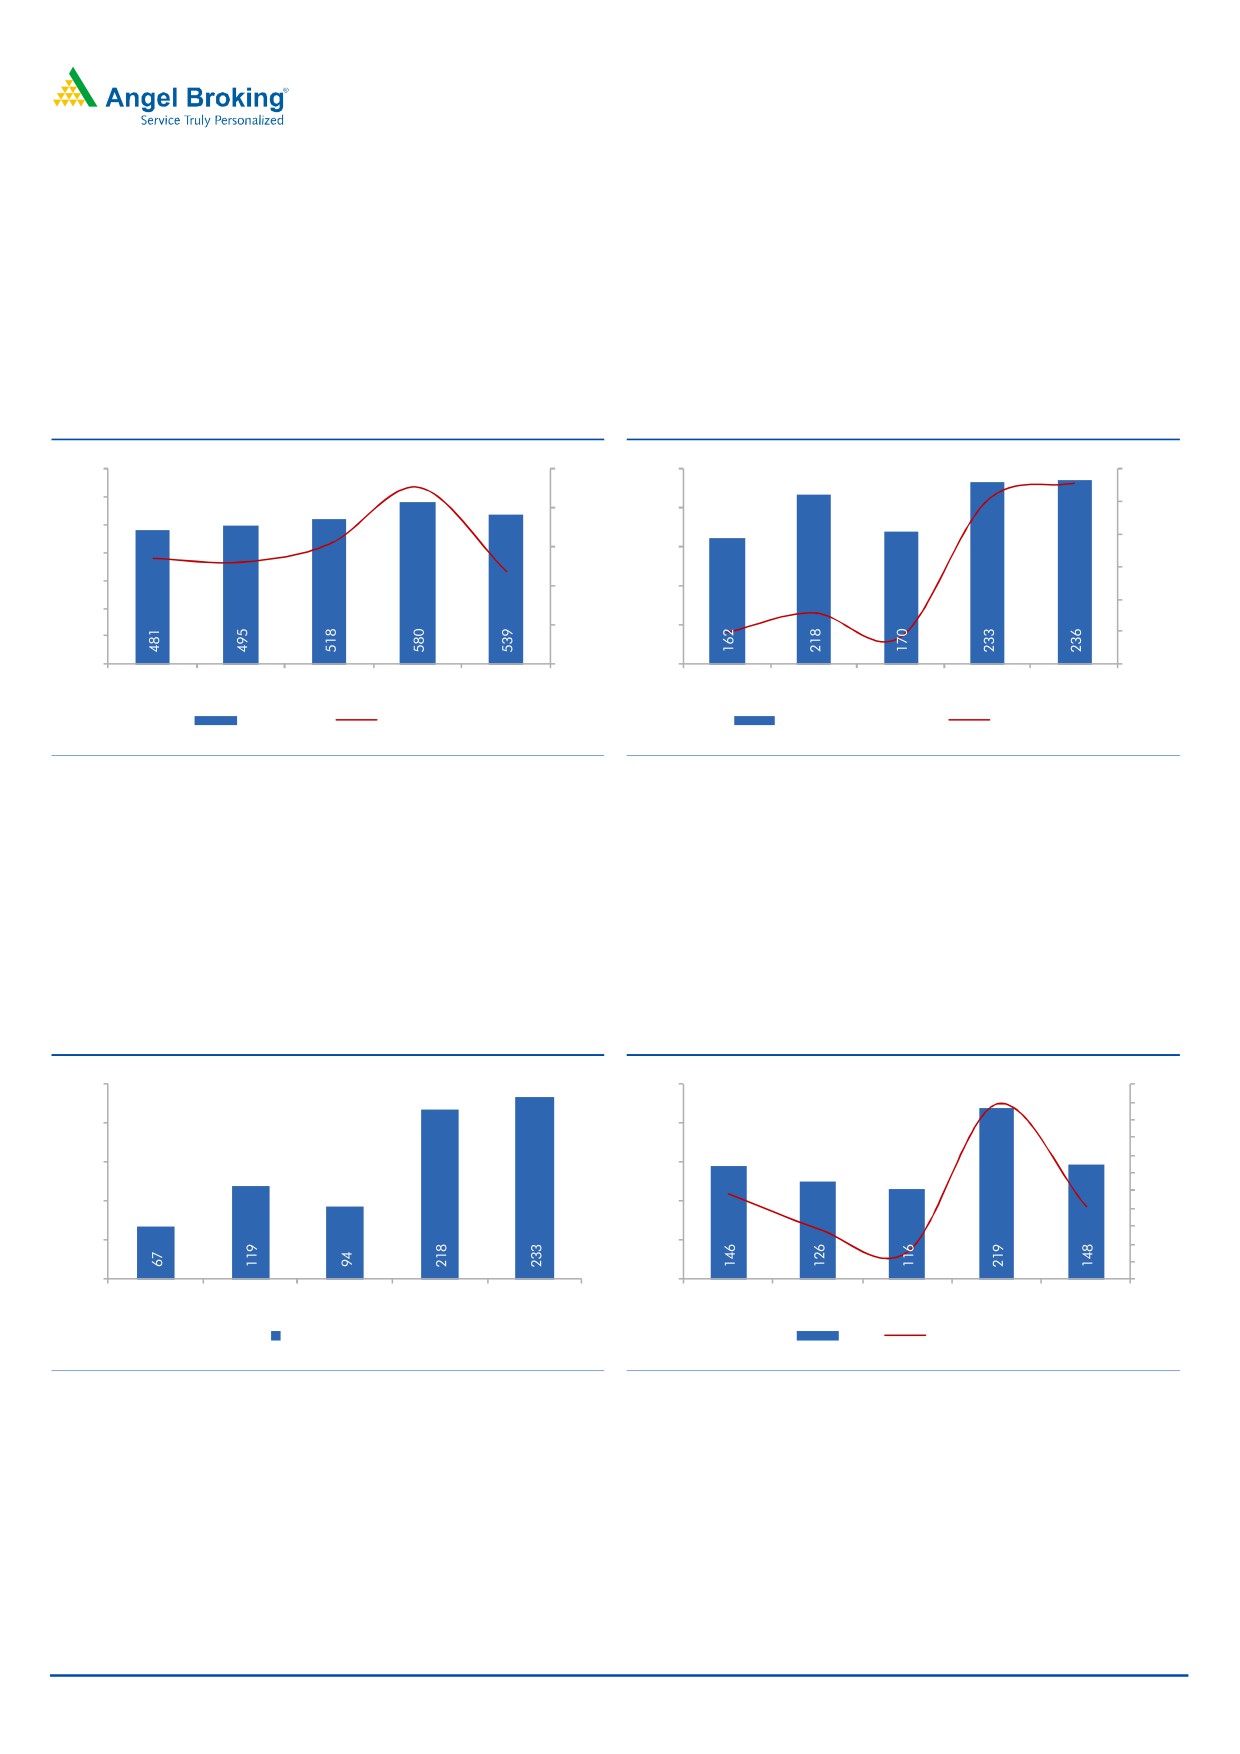
Higher provisions dented profit growth: Higher slippages and consequent interest
reversal impacted the NII growth during the quarter, which stood at 12% YoY. This
was much lower than the 23% YoY growth seen in Q4FY17. As we have
mentioned earlier the slippages could remain higher in the Q2FY18 as well and
could come down in the 2HFY18, hence we expect pick up in NII growth during
the 2nd half of the financial year.
Exhibit 8: NII Growth (%)
Exhibit 9: Other income boosted backed by fees (` Cr)
23%
40.4
45.7
700
25%
250
50.0
5.9
600
12%
40.0
15%
20%
200
13%
14%
-1.6
500
-0.1
30.0
400
15%
150
20.0
300
10%
100
10.0
200
5%
50
0.0
100
0
0%
0
-10.0
Q1FY17
Q2FY17
Q3FY17
Q4FY17
Q1FY18
Q1FY17
Q2FY17
Q3FY17
Q4FY17
Q1FY18
NII ( Rs Cr )
% Growth YoY
Other Income ( Rs Cr )
% Growth YoY
Source: Company, Angel Research
Source: Company, Angel Research
Other income of the bank has remained strong for the Q4FY17 as well as
Q1FY18, due to higher transactions and ATM related fees. While overall growth in
the fee income could moderate as more and more ATMs of other banks starts
operating, the growth would still be higher than FY17. Provisions during the
quarter higher than expected and hence PAT remained flat YoY.
Exhibit 10: Provisions were higher (` Cr )
Exhibit 11: PAT impacted by higher provisions(` Cr )
250
250
58.5
70
60
200
200
50
8.3
40
1.1
30
150
150
-11.2
-24.3
20
10
100
100
0
-10
50
50
-20
-30
0
0
-40
Q1FY17
Q2FY17
Q3FY17
Q4FY17
Q1FY18
Q1FY17
Q2FY17
Q3FY17
Q4FY17
Q1FY18
Provisions (Rs Cr )
PAT
% Growth YoY
Source: Company, Angel Research
Source: Company, Angel Research
August 4, 2017
4
Karur Vysya Bank | 1QFY2018 Result Update
NIM declined due to higher slippages and consequent interest reversal; In the
FY17 the bank had witnessed steady rise in NIM, backed by lower cost of funds.
Increasing share of CASA had been instrumental in helping lower cost of funds
and better NIM. However, during the quarter the bank witnessed one large
slippages and the interest reversal had a negative impact on the NIM.
Exhibit 12: NIM declined due to higher slippages
Exhibit 13: Capital raising planned in near term (%)
4.0
4.1
12.8
12.5
4.0
12.6
3.9
12.4
3.8
12.2
3.8
3.7
3.6
12.0
11.8
3.7
11.7
11.8
11.7
3.6
3.5
11.6
11.4
3.5
11.4
3.4
11.2
3.3
11.0
3.2
10.8
Q1FY17
Q2FY17
Q3FY17
Q4FY17
Q1FY18
Q1FY17
Q2FY17
Q3FY17
Q4FY17
Q1FY18
NIM %
CAR %
Source: Company, Angel Research
Source: Company, Angel Research
The RoA and RoE of the bank which had started showing positive trend again
under pressure during the quarter, due to higher than expected provisions.
However, the management remains confident that the slippages and consequent
provisions will be lower in the 2HFY18, and this should help in normalizing of
return ratios. Further the bank is in the process of raising capital to meet the
incremental expected growth in FY19 and higher growth coupled with strong
traction in fee income should lift the return ratios in FY19.
Exhibit 14: RoA Trend (%)
Exhibit 15: ROE Trend (%)
1.6
20.0
1.4
17.3
1.4
18.0
16.0
1.2
1.0
12.3
1.0
14.0
11.7
1.0
0.9
12.0
10.3
0.7
9.5
0.8
10.0
0.6
8.0
6.0
0.4
4.0
0.2
2.0
0.0
0.0
Q1FY17
Q2FY17
Q3FY17
Q4FY17
Q1FY18
Q1FY17
Q2FY17
Q3FY17
Q4FY17
Q1FY18
ROA %
ROE%
Source: Company, Angel Research
Source: Company, Angel Research
August 4, 2017
5
Karur Vysya Bank | 1QFY2018 Result Update
Slippages remained elevated, however were largely from the watch list: Slippages
during the quarter stood at `389 cr, though it was lower than `560 cr in Q4FY17,
overall it remained elevated. During the quarter one large account slipped from
the watch list and few more accounts remain under stress. At the end of Q4FY17
the management had indicated at around `650 cr under watch list and with the
one large account slipping into NPA , the watch list is down to `450 cr. On QoQ
basis GNPAs & NNPAs went up 69 bps and 32 bps to 4.27% and 2.85%.With
recovery process gaining steam we expect overall GNPAs to be under control.
Exhibit 16: Asset quality weakened QoQ (%)
Exhibit 17: Credit Cost (%)
4.3
4.5
2.5
2.2
2.1
4.0
3.6
3.5
2.0
2.9
3.0
2.7
2.5
2.3
1.5
1.2
2.5
1.8
1.0
2.0
1.7
1.4
1.0
0.7
1.5
0.8
1.0
0.5
0.5
0.0
0.0
Q1FY17
Q2FY17
Q3FY17
Q4FY17
Q1FY18
Q1FY17
Q2FY17
Q3FY17
Q4FY17
Q1FY18
Gross NPA %
Net NPAs %
Credit Cost
Source: Company, Angel Research
Source: Company, Angel Research
Exhibit 18: Slippages Ratios (%)
Exhibit 19: Slippages increased (` Cr)
6.0
5.5
600
560
5.0
500
3.7
389
4.0
400
3.0
290
3.0
2.4
2.5
300
239
243
2.0
200
1.0
100
0.0
0
Q1FY17
Q2FY17
Q3FY17
Q4FY17
Q1FY18
Q1FY17
Q2FY17
Q3FY17
Q4FY17
Q1FY18
Slippages %
Slippages ( Rs Cr )
Source: Company, Angel Research
Source: Company, Angel Research
August 4, 2017
6
Karur Vysya Bank | 1QFY2018 Result Update
Outlook and valuation
While credit cost will still remain elevated in FY18, we expect FY19 to be a more
meaningful year for the bank. In order to meet higher growth in the years to come
the bank is also in the process of raising capital .The fee income of the bank has
gained momentum and with cost remaining under control we expect RoE to
improve to 14.7% from 12.6% in FY17. Despite the recent run up, the stock is
trading at 1.6x it FY19 Adj BV, which believe leaves further scope for re-rating. We
maintain ACCUMULATE on the stock with a target price of `160.
August 4, 2017
7
Karur Vysya Bank | 1QFY2018 Result Update
Exhibit 20: Income Statement
Y/E March (` cr)
FY15
FY16
FY17
FY18E
FY19E
Net Interest Income
1,466
1,781
2,074
2,388
2,757
- YoY Growth (%)
14.2
21.5
16.4
15.1
15.4
Other Income
581
707
783
902
874
- YoY Growth (%)
2.9
21.7
10.8
15.2
(3.1)
Operating Income
2,046
2,488
2,857
3,289
3,630
- YoY Growth (%)
10.7
21.6
14.8
15.1
10.4
Operating Expenses
1,103
1,253
1,475
1,648
1,827
- YoY Growth (%)
9.2
13.5
17.7
11.8
10.9
Pre - Provision Profit
943
1235
1382
1,641
1,803
- YoY Growth (%)
12.6
31.0
11.9
18.8
9.9
Prov. & Cont.
481
324
498
656
523
- YoY Growth (%)
8.6
(32.6)
53.8
31.8
(20.3)
Profit Before Tax
462
912
884
985
1280
- YoY Growth (%)
17.0
97.1
(3.0)
11.4
29.9
Prov. for Taxation
7
344
278
325
422
- as a % of PBT
1.6
37.7
31.4
33.0
33.0
PAT
455
568
607
660
858
- YoY Growth (%)
6.0
24.7
6.9
8.8
29.9
Source: Company, Angel Research
Exhibit 21: Balance Sheet
Y/E March (` cr)
FY15
FY16
FY17
FY18E
FY19E
Share Capital
122
122
122
122
122
Reserves & Surplus
4,124
4,451
4,914
5,396
6,061
Net worth
4,246
4,573
5,036
5,518
6,183
Deposits
44,690
50,079
53,700
57,996
63,795
- Growth (%)
2.1
12.1
7.2
8.0
10.0
Borrowings
2,901
1,573
1,696
1,740
1,914
- Growth (%)
(11.9)
(45.8)
7.8
2.6
10.0
Other Liab & Prov.
1,315
1,439
1,376
1,450
1,595
Total Liabilities
53,152
57,664
61,808
66,703
73,487
Cash balances
2,693
2,529
2,790
2,900
3,190
Bank balances
56
263
1,555
580
638
Investments
12,773
13,222
14,857
16,239
17,863
Advances
36,109
39,084
40,908
44,998
50,398
- Growth (%)
6.2
8.2
4.7
10.0
12.0
Fixed Assets
411
420
419
470
517
Other Assets
1,110
2,146
1,279
1,516
881
Total Assets
53,152
57,664
61,808
66,703
73,487
Source: Company, Angel Research
August 4, 2017
8
Karur Vysya Bank | 1QFY2018 Result Update
Exhibit 22: Key Ratios
Y/E March
FY15
FY16
FY17
FY18E
FY19E
Profitability Ratios (%)
NIMs
2.8
3.2
3.5
3.7
3.9
Cost to Income Ratio
53.9
50.3
51.6
50.1
50.3
RoA
0.9
1.0
1.0
1.0
1.2
RoE
12.0
12.9
12.6
12.5
14.7
B/S ratios (%)
CASA Ratio
22.0
23.3
32.6
30.0
30.0
Credit/Deposit Ratio
80.8
78.0
76.2
77.6
79.0
CAR
14.6
12.2
12.5
12.8
13.1
- Tier I
13.6
11.3
11.7
12.0
12.3
Asset Quality (%)
Gross NPAs
1.9
1.30
3.6
4.0
3.7
Net NPAs
0.8
0.6
2.5
2.5
1.9
Slippages
1.8
3.1
3.4
2.5
1.5
Loan Loss Prov./Avg. Assets
1.3
0.8
1.2
1.4
1.0
Provision Coverage
59
58
30
50
50
Per Share Data (`)
EPS
7.5
9.3
10.0
10.8
14.1
BVPS
69.8
75.0
82.6
90.6
101.5
ABVPS
65.2
71.5
65.7
75.1
85.7
DPS
1.0
3.0
2.0
3.0
4.0
Valuation Ratios
PER (x)
18.7
15.0
14.1
12.9
9.9
P/BVPS(x)
2.0
1.9
1.7
1.5
1.4
P/ABVPS (x)
2.1
2.0
2.1
1.9
1.6
Dividend Yield
0.7
2.1
1.4
2.1
2.9
DuPont Analysis (%)
Interest Income
10.3
9.8
9.4
9.4
9.6
Interest Expenses
7.5
6.6
5.9
5.7
5.6
NII
2.8
3.2
3.5
3.7
3.9
Non Interest Income
1.1
1.3
1.3
1.4
1.2
Total Revenues
3.9
4.5
4.8
5.1
5.2
Operating Cost
2.1
2.3
2.5
2.6
2.6
PPP
1.8
2.2
2.3
2.6
2.6
Total Provisions
0.9
0.6
0.8
1.0
0.7
PreTax Profit
0.9
1.6
1.5
1.5
1.8
Tax
0.0
0.6
0.5
0.5
0.6
ROA
0.9
1.0
1.0
1.0
1.2
Leverage
13.8
12.6
12.4
12.2
12.0
RoE (%)
12.0
12.9
12.6
12.5
14.7
Source: Company, Angel Research
August 4, 2017
9
Karur Vysya Bank | 1QFY2018 Result Update
Research Team Tel: 022 - 39357800
DISCLAIMER
Angel Broking Private Limited (hereinafter referred to as “Angel”) is a registered Member of National Stock Exchange of India Limited,
Bombay Stock Exchange Limited and Metropolitan Stock Exchange Limited. It is also registered as a Depository Participant with CDSL
and Portfolio Manager with SEBI. It also has registration with AMFI as a Mutual Fund Distributor. Angel Broking Private Limited is a
registered entity with SEBI for Research Analyst in terms of SEBI (Research Analyst) Regulations, 2014 vide registration number
INH000000164. Angel or its associates has not been debarred/ suspended by SEBI or any other regulatory authority for accessing
/dealing in securities Market. Angel or its associates/analyst has not received any compensation / managed or co-managed public
offering of securities of the company covered by Analyst during the past twelve months.
This document is solely for the personal information of the recipient, and must not be singularly used as the basis of any investment
decision. Nothing in this document should be construed as investment or financial advice. Each recipient of this document should
make such investigations as they deem necessary to arrive at an independent evaluation of an investment in the securities of the
companies referred to in this document (including the merits and risks involved), and should consult their own advisors to determine
the merits and risks of such an investment.
Reports based on technical and derivative analysis center on studying charts of a stock's price movement, outstanding positions and
trading volume, as opposed to focusing on a company's fundamentals and, as such, may not match with a report on a company's
fundamentals. Investors are advised to refer the Fundamental and Technical Research Reports available on our website to evaluate the
contrary view, if any.
The information in this document has been printed on the basis of publicly available information, internal data and other reliable
sources believed to be true, but we do not represent that it is accurate or complete and it should not be relied on as such, as this
document is for general guidance only. Angel Broking Pvt. Limited or any of its affiliates/ group companies shall not be in any way
responsible for any loss or damage that may arise to any person from any inadvertent error in the information contained in this report.
Angel Broking Pvt. Limited has not independently verified all the information contained within this document. Accordingly, we cannot
testify, nor make any representation or warranty, express or implied, to the accuracy, contents or data contained within this document.
While Angel Broking Pvt. Limited endeavors to update on a reasonable basis the information discussed in this material, there may be
regulatory, compliance, or other reasons that prevent us from doing so.
This document is being supplied to you solely for your information, and its contents, information or data may not be reproduced,
redistributed or passed on, directly or indirectly.
Neither Angel Broking Pvt. Limited, nor its directors, employees or affiliates shall be liable for any loss or damage that may arise from
or in connection with the use of this information.
Disclosure of Interest Statement
Karur Vysya Bank
1. Financial interest of research analyst or Angel or his Associate or his relative
No
2. Ownership of 1% or more of the stock by research analyst or Angel or associates or relatives
No
3. Served as an officer, director or employee of the company covered under Research
No
4. Broking relationship with company covered under Research
No
Ratings (Based on expected returns
Buy (> 15%)
Accumulate (5% to 15%)
Neutral (-5 to 5%)
over 12 months investment period):
Reduce (-5% to -15%)
Sell (< -15)
August 4, 2017
10