4QFY2016 Result Update | FMCG
May 27, 2016
Jyothy Laboratories
NEUTRAL
CMP
`290
Result Update
Target Price
-
JLL’s 4QFY2015 highlights (Consolidated)
Investment Period
-
Y/E March (` cr)
4QFY16
4QFY15
% chg. (yoy) 3QFY16
% chg. (qoq)
Net Sales
445
401
11.1
385
15.6
Stock Info
Operating profit
63
39
60.1
51
23.1
Sector
FMCG
OPM (%)
14.1
9.8
431bp
13.2
86bp
Market Cap (` cr)
5,278
Adj. PAT
36
27
32.0
39
(8.7)
Net debt (` cr)
465
Source: Company, Angel Research
Beta
0.9
52 Week High / Low
342 / 240
For 4QY2016, Jyothy Laboratories (JLL) reported a top-line growth of 11.1% yoy
Avg. Daily Volume
21,000
to `445cr. On account of lower raw material and employee expenses as a
Face Value (`)
1
percentage of sales, the EBITDA margin expanded by 431bp yoy to 14.1%.
BSE Sensex
26,654
Interest expenses declined by 83.7% yoy to `1cr while the tax rate was higher at
Nifty
8,157
35% vs 11.4% in 4QFY2015. On account of good top-line growth and higher
operating profitability, the net profit grew by 32.0% yoy to `36cr.
Reuters Code
JYOI.BO
Bloomberg Code
JLY IN
Continued focus on power brands and potential acquisitions to drive growth: JLL
has a strong product portfolio post the Henkel acquisition with key brands like
Henko, Margo and Pril coming under its portfolio in addition to its own successful
Shareholding Pattern (%)
brands like Ujala, Exo and Maxo. These power brands have been the driving
Promoters
66.7
factor for the company’s growth. The company has relaunched some products
MF / Banks / Indian Fls
9.3
and introduced newer products within these brands which has yielded positive
results. Going forward, the company has guided for revenue target of `5,000cr
FII / NRIs / OCBs
14.5
by FY2020 and it is open to acquisitions in order to meet the target.
Indian Public / Others
9.5
Henkel may potentially re-rate the stock: Effective April 2016, Henkel has an
option to purchase 26% stake in JLL (the option is valid to be exercised before 31st
March 2017). The promoters of JLL prefer the stake sale to materialize at a
Abs.(%)
3m 1yr
3yr
mutually agreeable valuation. We believe Henkel will likely choose to exercise the
Sensex
15.1
(3.1)
32.2
option, given the prospects of the Indian growth story. Our belief draws its basis
JLL
11.4
9.0
57.8
from the fact that Henkel’s agreement with Asian Paints for tapping the latter’s
distribution channel for promoting its consumer adhesives business (“Loctite”) in India is
some indication of Henkel’s faith in the India growth story. We believe that JLL would
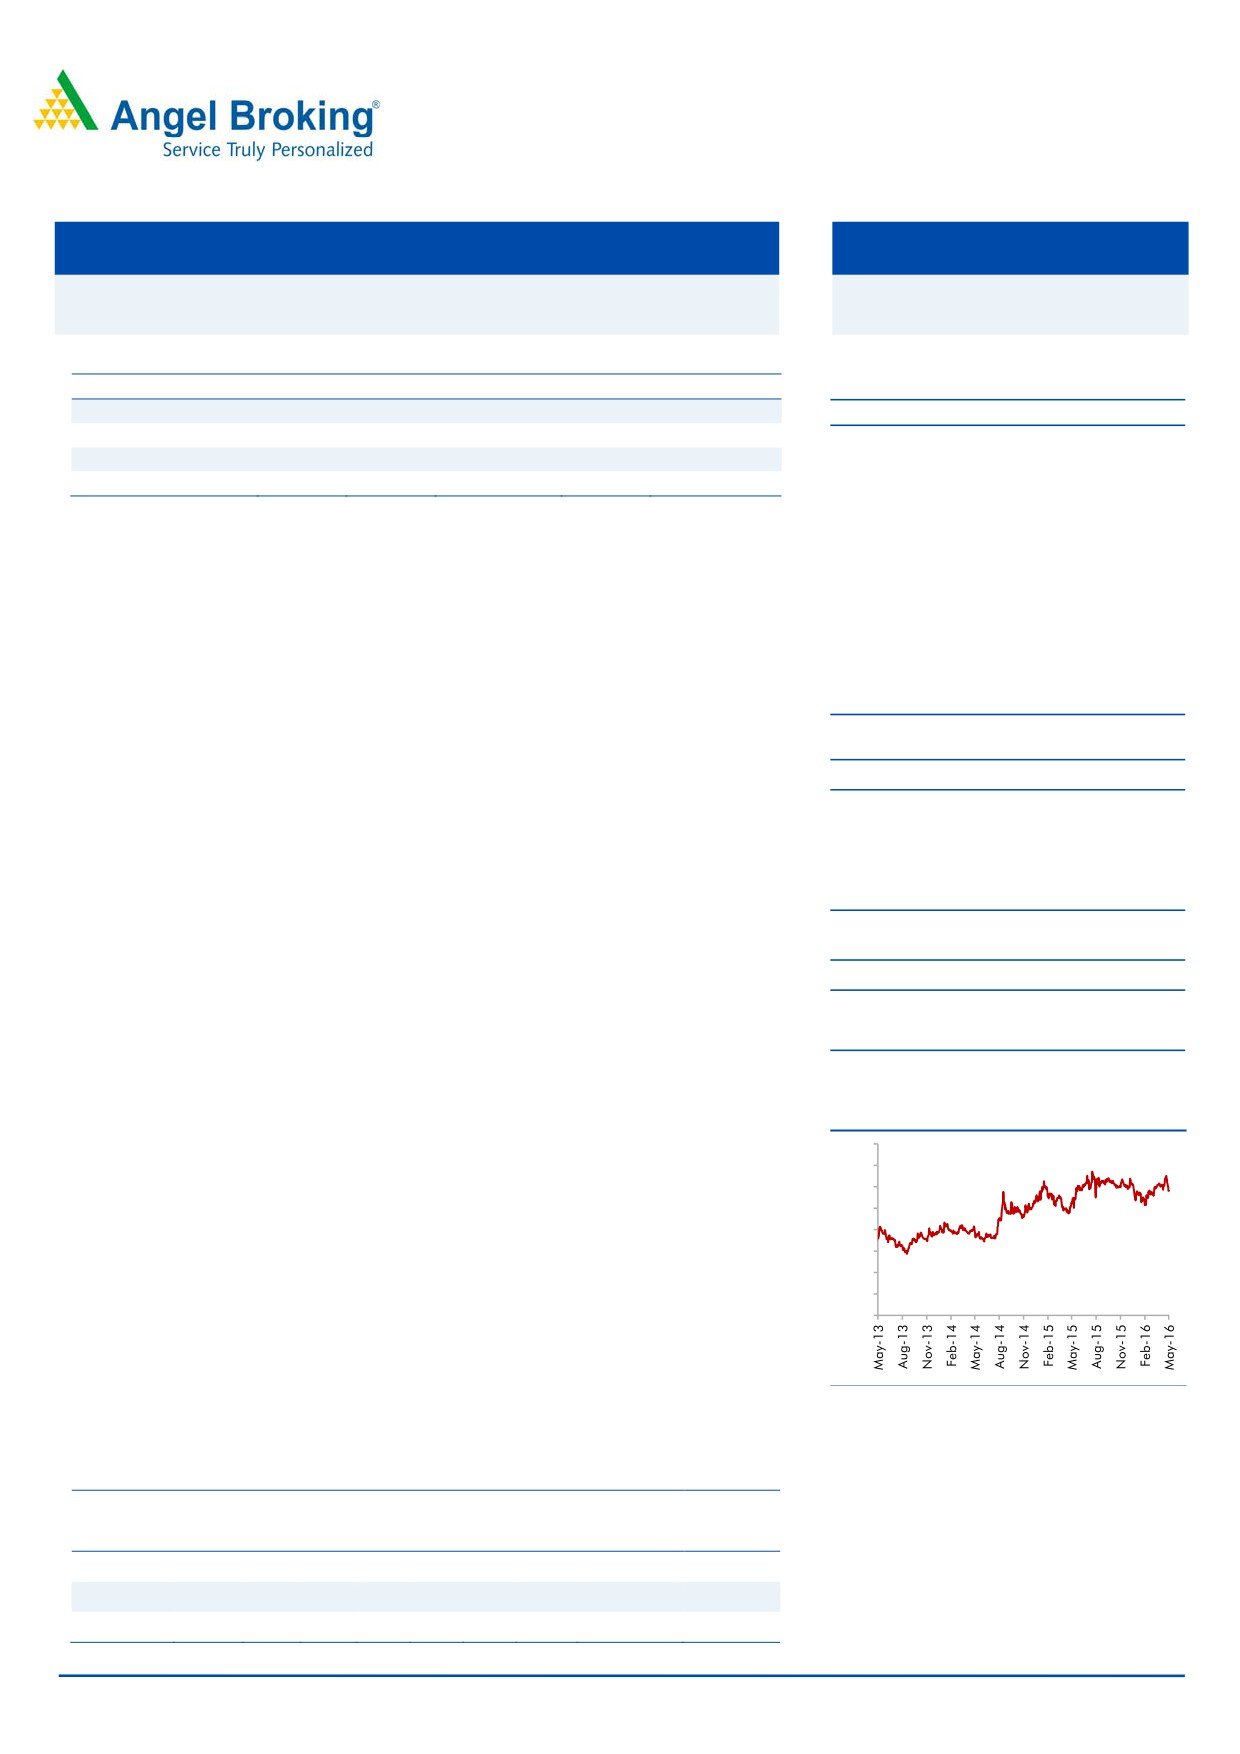
3 year price chart
then be able to fall back on Henkel to launch new products in the Indian market.
400
Outlook and valuation: We have switched over from valuing the company on
350
300
standalone numbers to consolidated numbers. The CEO, Mr Raghunandan is
250
stepping down from the leadership post but will make himself available for the
200
company to figure out big-ticket acquisitions and actively participate in strategic
150
planning. He will be replaced by Mr Rajnikant Sabnavis who was previously in
100
charge of sales & marketing in the company and has valuable industry experience
50
with HUL. The company has laid out an aggressive revenue target of `5,000cr by
-
FY2020 which would be a monitorable as the company has indicated at scouting
for suitable acquisitions. We expect the company’s revenue to grow at a CAGR of
11.6% over FY2016-18E to `2,052cr while net profit is expected to grow at a
Source: Company, Angel Research
CAGR of 7.0% over the same period to `181cr. At the current market price, the
stock trades at 29.2x its FY2018E earnings. We have a Neutral view on the stock.
Key financials (Consolidated)
Y/E
Sales OPM PAT EPS RoE P/E P/BV EV/EBITDA EV/Sales
March
(` cr)
(%)
(` cr)
(`)
(%)
(x)
(x)
(x)
(x)
FY2016
1,647
13.4
158
8.7
19.4
33.4
6.2
26.1
3.5
Milan Desai
FY2017E
1,845
13.0
162
8.9
18.6
32.6
5.9
23.7
3.1
022-4000 3600 Ext: 6846
FY2018E
2,052
12.9
181
10.0
19.3
29.2
5.4
21.3
2.7
Source: Company, Angel Research, Note: CMP as on May 26, 2016
Please refer to important disclosures at the end of this report
1
Jyothy Laboratories | 4QFY2016 Result Update
Exhibit 1: 4QFY2014 - JLL’s Performance highlights (Consolidated)
Y/E March (` cr)
4QFY16
4QFY15
% chg. (yoy)
3QFY16
% chg. (qoq)
FY2016
FY2015
% chg
Net Sales
445
401
11.1
385
15.6
1,647
1,515
8.7
Net raw material
223
206
8.2
183
21.6
799
777
2.8
(% of Sales)
50.0
51.3
(135)bp
47.5
248bp
48.5
51.3
(279)bp
Employee Cost
40
48
(17.7)
44
(10.1)
184
179
2.6
(% of Sales)
8.9
12.1
(312)bp
11.5
(254)bp
11.2
11.8
(66)bp
Other Expenses
120
108
11.7
107
12.3
444
395
12.2
(% of Sales)
27.0
26.8
16bp
27.8
(79)bp
26.9
26.1
85bp
Total Expenditure
383
362
5.8
334
14.4
1,426
1,352
5.5
Operating Profit
63
39
60.1
51
23.1
220
163
35.0
OPM (%)
14.1
9.8
431bp
13.2
86bp
13.4
10.8
261bp
Interest
1
3.2
(83.7)
1
(34.2)
6
14
(56.2)
Depreciation
10
8
23.4
7
35.0
31
33
(3.5)
Other Income
3
3
-
2
2.4
15
10
47.2
Extraordinary item
-
-
-
2
PBT
55
30
79.9
45
21.0
197
125
58.4
(% of Sales)
12.3
7.6
11.7
12.0
8.2
Tax
19
3
6
39.3
3.5
(% of PBT)
35.0
11.4
13.8
19.9
2.8
Reported PAT
36
27
32.0
39
(8.7)
158
121
30.6
Minority Interest
(0)
(0)
-
(0)
Exceptional Item
-
(2)
-
-
2
Adjusted PAT
36
29
23.8
39
(8.8)
158
119
32.6
PATM (%)
8.0
7.2
10.1
9.6
7.9
Source: Company, Angel Research
Exhibit 2: Actual vs. Angel Estimates
Y/E March (` cr)
4QFY16
Angel est.
% diff
Net sales
445
446
(0.2)
EBITDA
63
58
9.0
EBITDA margin (%)
14.1
12.9
119bp
Reported PAT
36
38
(6.3)
Source: Company, Angel Research
Mixed set of numbers
JLL reported a mixed set of numbers for 4QFY2016,. Its consolidated top-line for
the quarter increased by 11.1% yoy to `445cr, which is in-line with our estimate of
`446cr. The Home Care segment grew by 18.7% yoy to `142cr while the Soaps &
Detergent segment grew by 10.1% yoy to `289cr. Power brands grew by 10.3%
yoy with volume growth of 9.5%.
May 27, 2016
2
Jyothy Laboratories | 4QFY2016 Result Update
Exhibit 3: Category break-up
4QFY16
4QFY15
% chg FY2016 FY2015
% chg
Fabric Care
171
152
12.6
688
647
6.4
Dishwashing
115
103
11.6
466
417
11.8
Mosquito repellant
114
97
17.9
273
236
15.5
Personal care
28
29
(3.3)
148
141
5.1
Others
6
5
17.0
26
23
15.9
Total
434
386
12.5
1,602
1,463
9.5
Laundry Services
11
11
7.2
43
42
2.4
Grand Total
445
396
19.7
1,645
1,505
11.8
Source: Company, Angel Research
On the operating front, the company benefitted from lower input costs which
declined by 135bp yoy to 50.0% of sales, thus resulting in gross margin
expansion. Gross margins also expanded on account of change in sales mix.
However, on a qoq basis, gross margins dipped by 248bp yoy. Employee
expense declined by 312bp yoy to 8.9% of sales owing to ESOP cost write
backs while other expenses were flat. The Home Care segment reported a
profit of `10cr (vs a loss of `0.8cr in 4QFY2015) while the EBIT for the Soaps
& Detergent segment came in at `53cr as against `42cr in 4QFY2015.
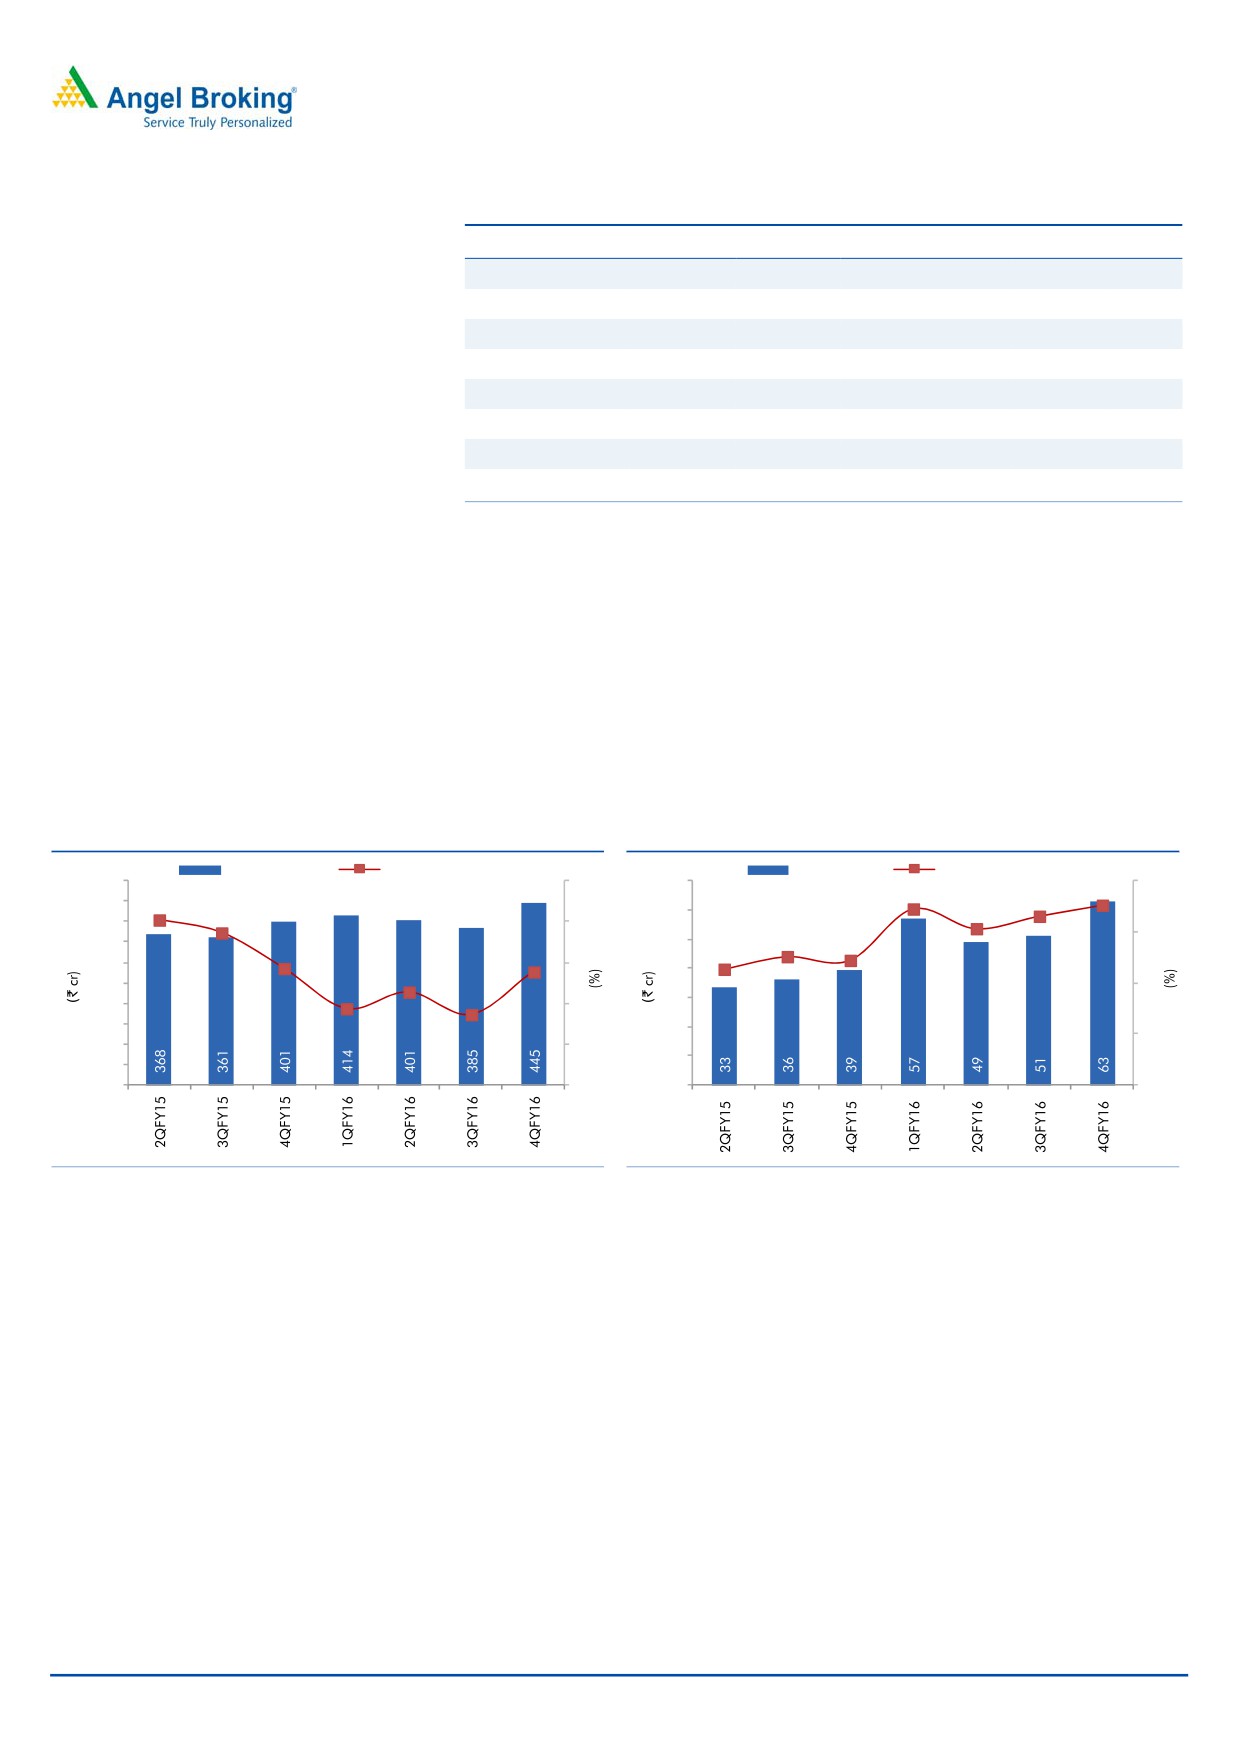
Exhibit 4: Revenue Growth
Exhibit 5: EBIDTA margin expands on lower RM cost
Revenue (LHS)
yoy growth (RHS)
EBITDA (LHS)
EBITDA Margin (RHS)
500
20
70
16
450
1
4.1
60
13.8
400
16.2
16
13.2
14.9
12.3
12
350
50
300
12
10.1
9.8
11.4
11
.1
40
9.1
250
8
9.1
30
200
8
7.5
6.9
150
20
4
100
4
10
50
0
0
0
0
Source: Company, Angel Research
Source: Company, Angel Research
On account of a better operational performance, the EBIDTA margin
expanded by 431bp yoy to 14.1% of sales which is higher than our estimate of
12.9%. The company’s tax rate was higher at 35% in comparison to the past
where it was availing benefits from the Henkel merger. As a result, the net
profit after minority interest grew by 23.8% yoy to `36cr which is lower than
our estimate of `38cr.
May 27, 2016
3
Jyothy Laboratories | 4QFY2016 Result Update
Investment arguments
Continued focus on power brands and potential acquisition to
drive growth
JLL has a strong product portfolio post Henkel’s acquisition with key brands added
to its portfolio like Henko, Margo and Pril in addition to its own successful brands
like Ujala, Exo and Maxo. These power brands have been the driving factor for the
company’s growth post the acquisition. The company has relaunched some
products and introduced newer products within these brands which has yielded
positive results. Going forward, the company has guided for a revenue target of
`5,000cr by FY2020 and is open to acquisitions in order to meet the target. Since
the Henkel acquisition, the acquired power brands have helped the company
expand its geographical presence. The non-south contribution for the company
has increased to 60% from ~50% in FY2013.
Exhibit 6: Power Brands Performance
Brand
4QFY16
4QFY15
% chg FY2016 FY2015
% chg
Ujala
93
87
6.3
392
372
5.3
Exo
86
79
9.4
348
315
10.7
Maxo
114
97
17.9
273
236
15.5
Henko
46
34
37.2
169
152
11.3
Margo
25
25
(1.1)
131
121
8.3
Pril
29
24
19.0
118
102
15.5
Total Power Brand
393
346
13.6
1,430
1,297
10.3
Others
41
40
3.1
171
166
3.3
Total
434
386
12.5
1,602
1,463
9.5
Source: Company, Angel Research
Henkel may potentially re-rate the stock
Effective April 2016, Henkel has an option to purchase 26% stake in JLL (the
option is valid to be exercised before 31st March 2017). The promoters of JLL
prefer the stake sale to materialize at a mutually agreeable valuation. We believe
Henkel will likely choose to exercise the option, given the prospects of the Indian
growth story. Our belief draws its basis from the fact that Henkel’s agreement with
Asian Paints for tapping the latter’s distribution channel for promoting its consumer
adhesives business (“Loctite”) in India is some indication of Henkel’s faith in the
India growth story. We believe that JLL would then be able to fall back on Henkel
to launch new products in the Indian market.
May 27, 2016
4
Jyothy Laboratories | 4QFY2016 Result Update
Financials
Exhibit 7: Sales growth assumption for JLL
Y/E March
FY2017E
FY2018E
Home care
437
476
(% Growth)
13.3
8.8
Soaps and Detergents
1,347
1,506
(% Growth)
12.2
11.8
Others
16
17
Laundry Services
43
45
Total Sales
1,843
2,044
Source: Company, Angel Research
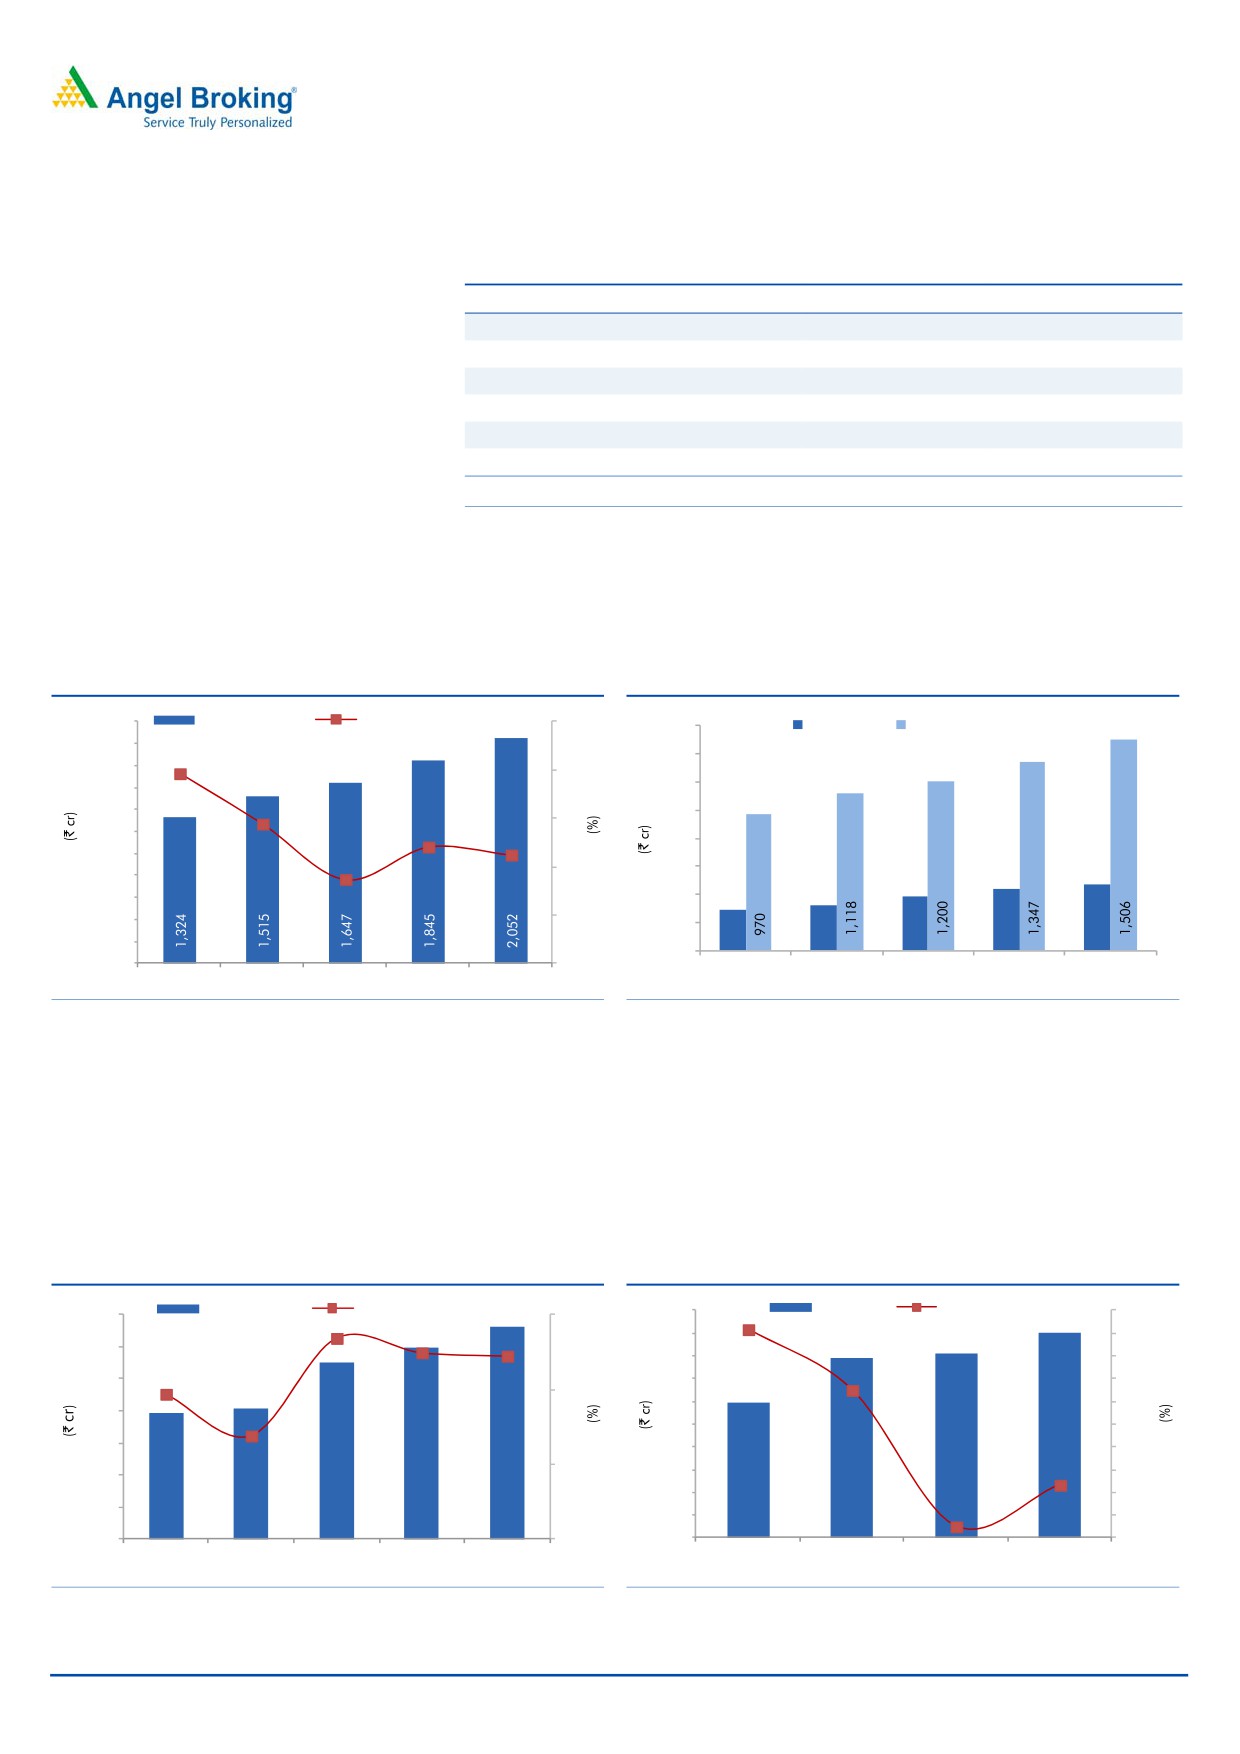
We expect the top-line to post a revenue CAGR of 11.6% over FY2016-18E to
`2,052cr. This will be on the back of strong focus on power brands as well as
greater distribution reach.
Exhibit 8: Brand building to result in healthy sales
Exhibit 9: Segmental sales contribution
2,200
Revenue (LHS)
Revenue growth (RHS)
25
1,600
Home care
Soaps and Detergents
2,000
1,400
1,800
19.6
20
1,200
1,600
1,400
1,000
15
14.4
1,200
800
1,000
11.2
12.0
10
600
476
800
437
8.7
386
327
600
400
288
400
5
200
200
0
-
0
FY2014
FY2015
FY2016
FY2017E
FY2018E
FY2014
FY2015
FY2016
FY2017E
FY2018E
Source: Company, Angel Research; Note: * Merged numbers of JLL and JCPL
Source: Company, Angel Research, Note: * Merged numbers of JLL and JCPL
With raw material prices expected to have bottomed out, we expect gross margins
to witness slight contraction. Also, the company has targeted the advertisement
spend to remain at current levels of ~12%. We expect EBITDA margin to be at
12.9% in FY2018E. The company will be amalgamating with its subsidiary JCML
which will lead to JLL paying minimum alternate tax over the next two years. We
expect the net profit to post a CAGR of 7.0% over FY2016-18E to `181cr.
Exhibit 10: Margin expansion to correct
Exhibit 11: Profit growth subdued
EBITDA (LHS)
EBITDA Margin (RHS)
200
PAT (LHS)
PAT growth (RHS)
50
280
14
180
45.8
45
13.4
240
160
40
13.0
12.9
200
140
35
11.9
12
32.5
120
30
160
100
25
10.8
120
80
20
10
60
15
80
11.6
40
10
40
20
5
157
163
220
239
265
119
158
162
181
2.5
0
8
0
0
FY2014
FY2015
FY2016
FY2017E
FY2018E
FY2015
FY2016
FY2017E
FY2018E
Source: Company, Angel Research; Note: * Merged numbers of JLL and JCPL
Source: Company, Angel Research; Note: * Merged numbers of JLL and JCPL
May 27, 2016
5
Jyothy Laboratories | 4QFY2016 Result Update
Outlook and valuation
We have switched over from valuing the company on standalone numbers to
consolidated numbers. The CEO, Mr Raghunandan is stepping down from the
leadership post but will make himself available for the company to figure out big-
ticket acquisitions and actively participate in strategic planning. He will be replaced
by Mr Rajnikant Sabnavis as the CEO who was previously in charge of sales &
marketing in the company and has valuable industry experience with HUL. The
company has laid out an aggressive revenue target of `5,000cr by FY2020 which
would be a monitorable as the company has indicated at scouting for suitable
acquisitions. We expect the company’s revenue to grow at a CAGR of 11.6% over
FY2016-18E to `2,052cr while net profit is expected to grow at a CAGR of 7.0%
over the same period to `181cr. At the current market price, the stock trades at
29.2x its FY2018E earnings. We have a Neutral view on the stock.
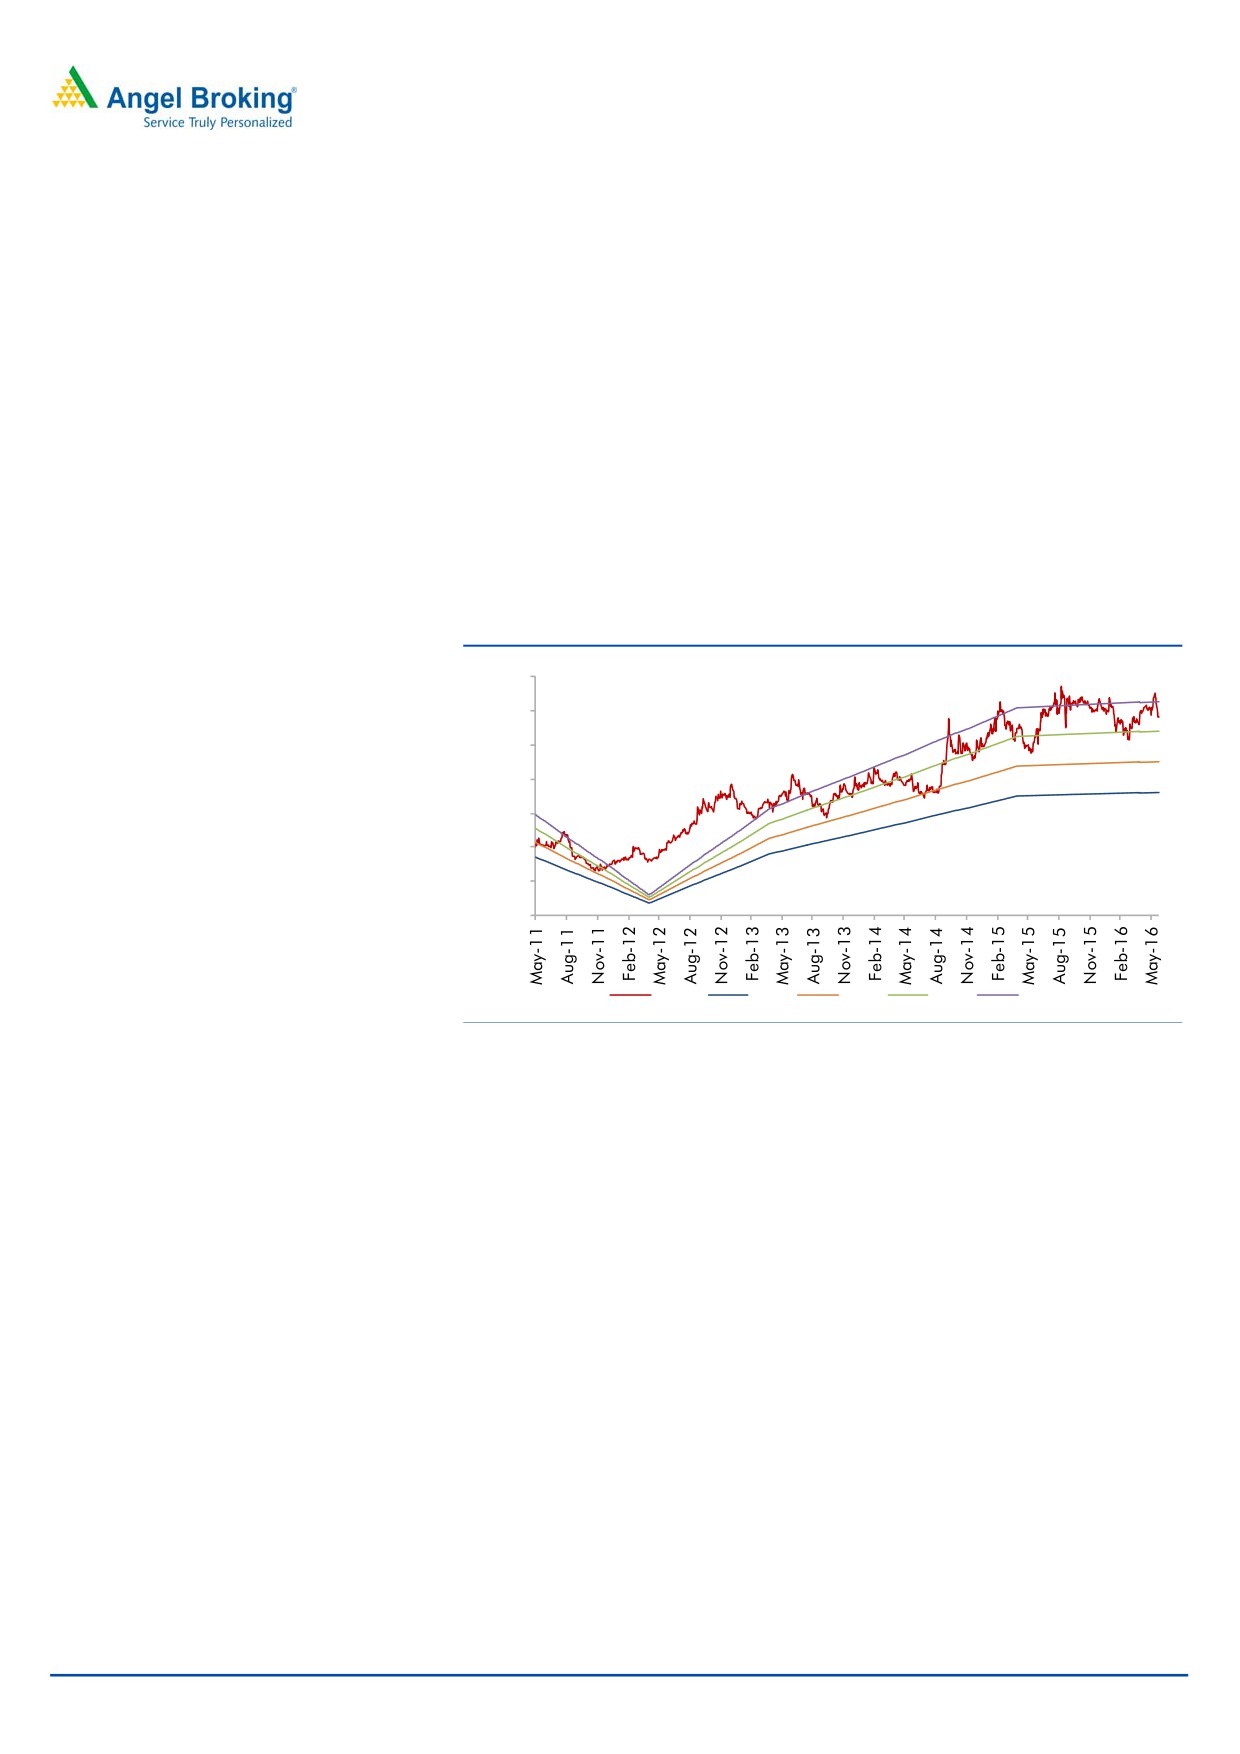
Exhibit 12: One-year forward PE band
350
300
250
200
150
100
50
-
Price
20x
25x
30x
35x
Source: Company, Angel Research
Risk factors
Raw-material cost & economic slowdown: The company’s raw material costs are
exposed to fluctuations in the price of crude and rupee exchange rate, and
inflationary pressure. Any substantial depreciation in the rupee, rise in the price of
crude oil, inflation and slow down in overall economy may pose risk to the
company’s business.
May 27, 2016
6
Jyothy Laboratories | 4QFY2016 Result Update
Profit and Loss (Consolidated)
Y/E March (` cr)
FY2014
FY2015
FY2016
FY2017E
FY2018E
Total operating income
1,324
1,515
1,647
1,845
2,052
% chg
19.6
14.4
8.7
12.0
11.2
Net Raw Materials
694
777
799
904
1008
% chg
18.8
12.0
2.8
13.2
11.4
Personnel
138
179
184
212
236
% chg
5.9
29.5
2.6
15.6
11.2
Other
334
395
444
489
544
% chg
27.9
18.3
12.2
10.2
11.2
Total Expenditure
1167
1352
1426
1606
1788
EBITDA
157
163
220
239
265
% chg
20.4
3.7
35.0
8.8
10.5
(% of Net Sales)
11.9
10.8
13.4
13.0
12.9
Depreciation& Amortisation
24
33
31
33
35
EBIT
133
130
189
206
230
% chg
22.9
(1.8)
44.6
9.4
11.3
(% of Net Sales)
10.6
9.1
12.2
11.7
11.7
Interest & other Charges
55
14
6
9
9
Other Income
8
10
15
5
6
(% of Net Sales)
0.7
0.7
0.9
0.3
0.3
Recurring PBT
78
117
183
198
221
% chg
94.7
50.3
56.5
8.2
11.7
Extra ordi. item/Prior period items
4.0
2.1
0.0
0.0
0.0
PBT (reported)
82
125
197
203
226
Tax
1
4
39
41
46
(% of PBT)
0.8
2.8
19.9
20.2
20.2
PAT (reported)
81
121
158
162
181
Minority Interest
0
0
0
0
0
Extraordinary Expense/(Inc.)
(1)
2
0
0
0
ADJ. PAT
82
119
158
162
181
% chg
472.6
45.8
32.5
2.5
11.6
(% of Net Sales)
6.5
8.3
10.2
9.2
9.2
Basic EPS (`)
4.5
6.6
8.7
8.9
10.0
Fully Diluted EPS (`)
4.5
6.6
8.7
8.9
10.0
% chg
409.8
45.8
32.5
2.5
11.6
May 27, 2016
7
Jyothy Laboratories | 4QFY2016 Result Update
Balance Sheet (Consolidated)
Y/E March (` cr)
FY2014
FY2015
FY2016
FY2017E
FY2018E
SOURCES OF FUNDS
Equity Share Capital
18
18
18
18
18
Reserves& Surplus
716
762
828
881
953
Shareholders’ Funds
734
780
846
899
971
Minority Interest
2
1
2
2
2
Total Loans
681
730
609
562
561
Other Long Term Liabilities
0
1
5
5
5
Long Term Provisions
11
14
18
18
18
Deferred Tax (Net)
1
1
25
25
25
Total Liabilities
1,428
1,526
1,505
1,510
1,581
APPLICATION OF FUNDS
Gross Block
505
507
532
559
587
Less: Acc. Depreciation
173
198
229
262
297
Less: Impairment
25
22
22
22
22
Net Block
307
287
281
275
268
Capital Work-in-Progress
4
16
8
8
8
Goodwill
787
787
787
787
787
Investments
61
194
83
83
83
Long Term Loans and adv.
135
176
237
266
295
Other Non-current asset
1
3
1
1
1
Current Assets
358
354
370
402
485
Cash
70
77
61
83
126
Loans & Advances
38
32
26
29
32
Inventory
174
185
183
203
230
Debtors
67
57
94
81
90
Other current assets
10
3
7
7
7
Current liabilities
225
290
262
311
346
Net Current Assets
133
64
108
91
139
Misc. Exp. not written off
-
-
-
-
-
Total Assets
1,428
1,526
1,505
1,510
1,581
May 27, 2016
8
Jyothy Laboratories | 4QFY2016 Result Update
Cash Flow (Consolidated)
Y/E March (` cr)
FY2014
FY2015
FY2016
FY2017E FY2018E
Profit before tax
82
125
197
203
226
Depreciation
24
33
31
33
35
Change in Working Capital
5
77
(60)
39
(4)
Direct taxes paid
(1)
(4)
(15)
(41)
(46)
Others
(8)
(10)
(15)
(5)
(6)
Cash Flow from Operations
103
220
139
228
206
(Inc.)/Dec. in Fixed Assets
(52)
(14)
(17)
(27)
(28)
(Inc.)/Dec. in Investments
(59)
(133)
110
-
-
(Incr)/Decr In LT loans & adv.
(38)
(43)
(59)
(29)
(30)
Others
8
10
15
5
6
Cash Flow from Investing
(142)
(179)
49
(50)
(52)
Issue of Equity
2
-
0
-
-
Inc./(Dec.) in loans
51
49
(112)
(48)
(1)
Dividend Paid (Incl. Tax)
(64)
(87)
(109)
(109)
(109)
Others
73
4
18
-
-
Cash Flow from Financing
62
(34)
(204)
(157)
(110)
Inc./(Dec.) in Cash
24
7
(16)
22
44
Opening Cash balances
46
70
77
61
83
Closing Cash balances
70
77
61
83
126
May 27, 2016
9
Jyothy Laboratories | 4QFY2016 Result Update
Key Ratios (Consolidated)
Y/E March
FY2014
FY2015
FY2016
FY2017E
FY2018E
Valuation Ratio (x)
P/E (on FDEPS)
64.5
44.3
33.4
32.6
29.2
P/CEPS
49.7
34.8
27.9
27.1
24.5
P/BV
7.2
6.8
6.2
5.9
5.4
EV/Net sales
4.4
3.8
3.5
3.1
2.7
EV/EBITDA
37.1
35.2
26.1
23.7
21.3
EV / Total Assets
4.1
3.8
3.9
3.8
3.6
Per Share Data (`)
EPS (Basic)
4.5
6.6
8.7
8.9
10.0
EPS (fully diluted)
4.5
6.6
8.7
8.9
10.0
Cash EPS
5.9
8.4
10.5
10.8
11.9
DPS
3.0
4.0
5.0
5.0
5.0
Book Value
40.5
43.0
46.7
49.6
53.6
DuPont Analysis
EBIT margin
10.0
8.6
11.5
11.2
11.2
Tax retention ratio
1.0
1.0
0.8
0.8
0.8
Asset turnover (x)
0.9
1.0
1.1
1.2
1.3
ROIC (Post-tax)
9.2
8.3
10.2
11.1
11.8
Cost of Debt (Post Tax)
8.4
1.9
0.7
1.2
1.3
Leverage (x)
0.7
0.6
0.5
0.4
0.4
Operating ROE
9.9
12.1
15.4
15.5
15.6
Returns (%)
ROCE (Pre-tax)
0.1
0.1
0.1
0.1
0.2
Angel ROIC (Pre-tax)
27.2
27.2
38.0
38.8
42.7
ROE
11.9
15.8
19.4
18.6
19.3
Turnover ratios (x)
Asset TO (Gross Block)
2.7
3.0
3.2
3.4
3.6
Inventory / Net sales (days)
48
43
41
38
38
Receivables (days)
20
15
17
16
16
Payables (days)
72
70
71
71
71
WC cycle (ex-cash) (days)
18
(3)
10
2
2
Solvency ratios (x)
Net debt to equity
0.7
0.6
0.5
0.4
0.4
Net debt to EBITDA
3.5
2.8
2.1
1.7
1.3
Int. Coverage (EBIT/ Int.)
2.4
9.5
31.3
23.3
24.9
May 27, 2016
10
Jyothy Laboratories | 4QFY2016 Result Update
Research Team Tel: 022 - 39357800
DISCLAIMER
Angel Broking Private Limited (hereinafter referred to as “Angel”) is a registered Member of National Stock Exchange of India Limited,
Bombay Stock Exchange Limited and Metropolitan Stock Exchange of India Limited. It is also registered as a Depository Participant with
CDSL and Portfolio Manager with SEBI. It also has registration with AMFI as a Mutual Fund Distributor. Angel Broking Private Limited is
a registered entity with SEBI for Research Analyst in terms of SEBI (Research Analyst) Regulations, 2014 vide registration number
INH000000164. Angel or its associates has not been debarred/ suspended by SEBI or any other regulatory authority for accessing
/dealing in securities Market. Angel or its associates including its relatives/analyst do not hold any financial interest/beneficial
ownership of more than 1% in the company covered by Analyst. Angel or its associates/analyst has not received any compensation /
managed or co-managed public offering of securities of the company covered by Analyst during the past twelve months. Angel/analyst
has not served as an officer, director or employee of company covered by Analyst and has not been engaged in market making activity
of the company covered by Analyst.
This document is solely for the personal information of the recipient, and must not be singularly used as the basis of any investment
decision. Nothing in this document should be construed as investment or financial advice. Each recipient of this document should
make such investigations as they deem necessary to arrive at an independent evaluation of an investment in the securities of the
companies referred to in this document (including the merits and risks involved), and should consult their own advisors to determine
the merits and risks of such an investment.
Reports based on technical and derivative analysis center on studying charts of a stock's price movement, outstanding positions and
trading volume, as opposed to focusing on a company's fundamentals and, as such, may not match with a report on a company's
fundamentals.
The information in this document has been printed on the basis of publicly available information, internal data and other reliable
sources believed to be true, but we do not represent that it is accurate or complete and it should not be relied on as such, as this
document is for general guidance only. Angel Broking Pvt. Limited or any of its affiliates/ group companies shall not be in any way
responsible for any loss or damage that may arise to any person from any inadvertent error in the information contained in this report.
Angel Broking Pvt. Limited has not independently verified all the information contained within this document. Accordingly, we cannot
testify, nor make any representation or warranty, express or implied, to the accuracy, contents or data contained within this document.
While Angel Broking Pvt. Limited endeavors to update on a reasonable basis the information discussed in this material, there may be
regulatory, compliance, or other reasons that prevent us from doing so.
This document is being supplied to you solely for your information, and its contents, information or data may not be reproduced,
redistributed or passed on, directly or indirectly.
Neither Angel Broking Pvt. Limited, nor its directors, employees or affiliates shall be liable for any loss or damage that may arise from
or in connection with the use of this information.
Note: Please refer to the important ‘Stock Holding Disclosure' report on the Angel website (Research Section). Also, please refer to the
latest update on respective stocks for the disclosure status in respect of those stocks. Angel Broking Pvt. Limited and its affiliates may
have investment positions in the stocks recommended in this report.
Disclosure of Interest Statement
Jyothy Laboratories
1. Analyst ownership of the stock
No
2. Angel and its Group companies ownership of the stock
No
3. Angel and its Group companies' Directors ownership of the stock
No
4. Broking relationship with company covered
No
Note: We have not considered any Exposure below ` 1 lakh for Angel, its Group companies and Directors
Ratings (Based on expected returns
Buy (> 15%)
Accumulate (5% to 15%)
Neutral (-5 to 5%)
over 12 months investment period):
Reduce (-5% to -15%)
Sell (< -15)
May 27, 2016
11