2QFY2016 Result Update | Media
November 5, 2015
Jagran Prakashan
BUY
CMP
`146
Performance highlights
Target Price
`169
Quarterly data (Consolidated)
Investment Period
12 Months
(` cr)
2QFY16
2QFY15
% yoy
1QFY16
% qoq
Revenue
520
436
19.1
481
8.0
Stock Info
EBITDA
147
106
38.3
135
8.9
Sector
Media
OPM (%)
28.3
24.3
393
28.0
24
Market Cap (` cr)
4,849
PAT
91
57
61.4
180
(49.3)
Source: Company, Angel Research
Net Debt (` cr)
(202)
Beta
0.5
For 2QFY2016, Jagran Prakashan (JPL)’s consolidated top-line grew by 19% yoy,
52 Week High / Low
154 / 107
mainly due to strong growth in the advertisement segment. The acquisition of the
Radio City business in 1QFY2016 added to the advertising revenue. However,
Avg. Daily Volume
28,669
circulation revenue showed lower growth during the quarter. The company
Face Value (`)
2
reported strong profitability on a consolidated basis due to falling news print costs
BSE Sensex
26,553
and with contribution from Radio City.
Nifty
8,040
Reuters Code
JAGP.BO
Ad revenue up ~27% yoy, Circulation revenue up ~4% yoy: The company’s
Bloomberg Code
JAGP@IN
advertising revenue growth for the quarter was healthy at ~27% yoy to ~`520cr,
primarily driven by increase in print revenue and radio advertisement revenue.
Circulation revenue was up 4% yoy to `100cr due to increase in cover prices.
Shareholding Pattern (%)
However, income from other businesses declined by
~7% yoy to ~`31cr.
Promoters
60.8
Consequently, the consolidated top-line grew by ~19% yoy to~ `520cr.
MF / Banks / Indian Fls
12.7
OPM improves: The consolidated operating profit grew by ~38% yoy to `147cr
FII / NRIs / OCBs
15.0
and the OPM expanded by 393bp yoy to 28.2% owing to lower raw material
Indian Public / Others
11.6
cost. This led to a strong reported net profit growth of ~61% yoy to `91cr (including
profits from the radio business).
Abs. (%)
3m 1yr
3yr
Outlook and valuation: Considering Dainik Jagran’s status as the most read
Sensex
(4.7)
4.7
41.5
Hindi newspaper in the country and its strong presence in the rapidly growing
JAGP
6.4
11.8
45.1
Hindi markets of Bihar, Haryana, Jharkhand, Punjab, Madhya Pradesh and Uttar
Pradesh, we expect JPL to benefit the most from an eventual recovery in the Indian
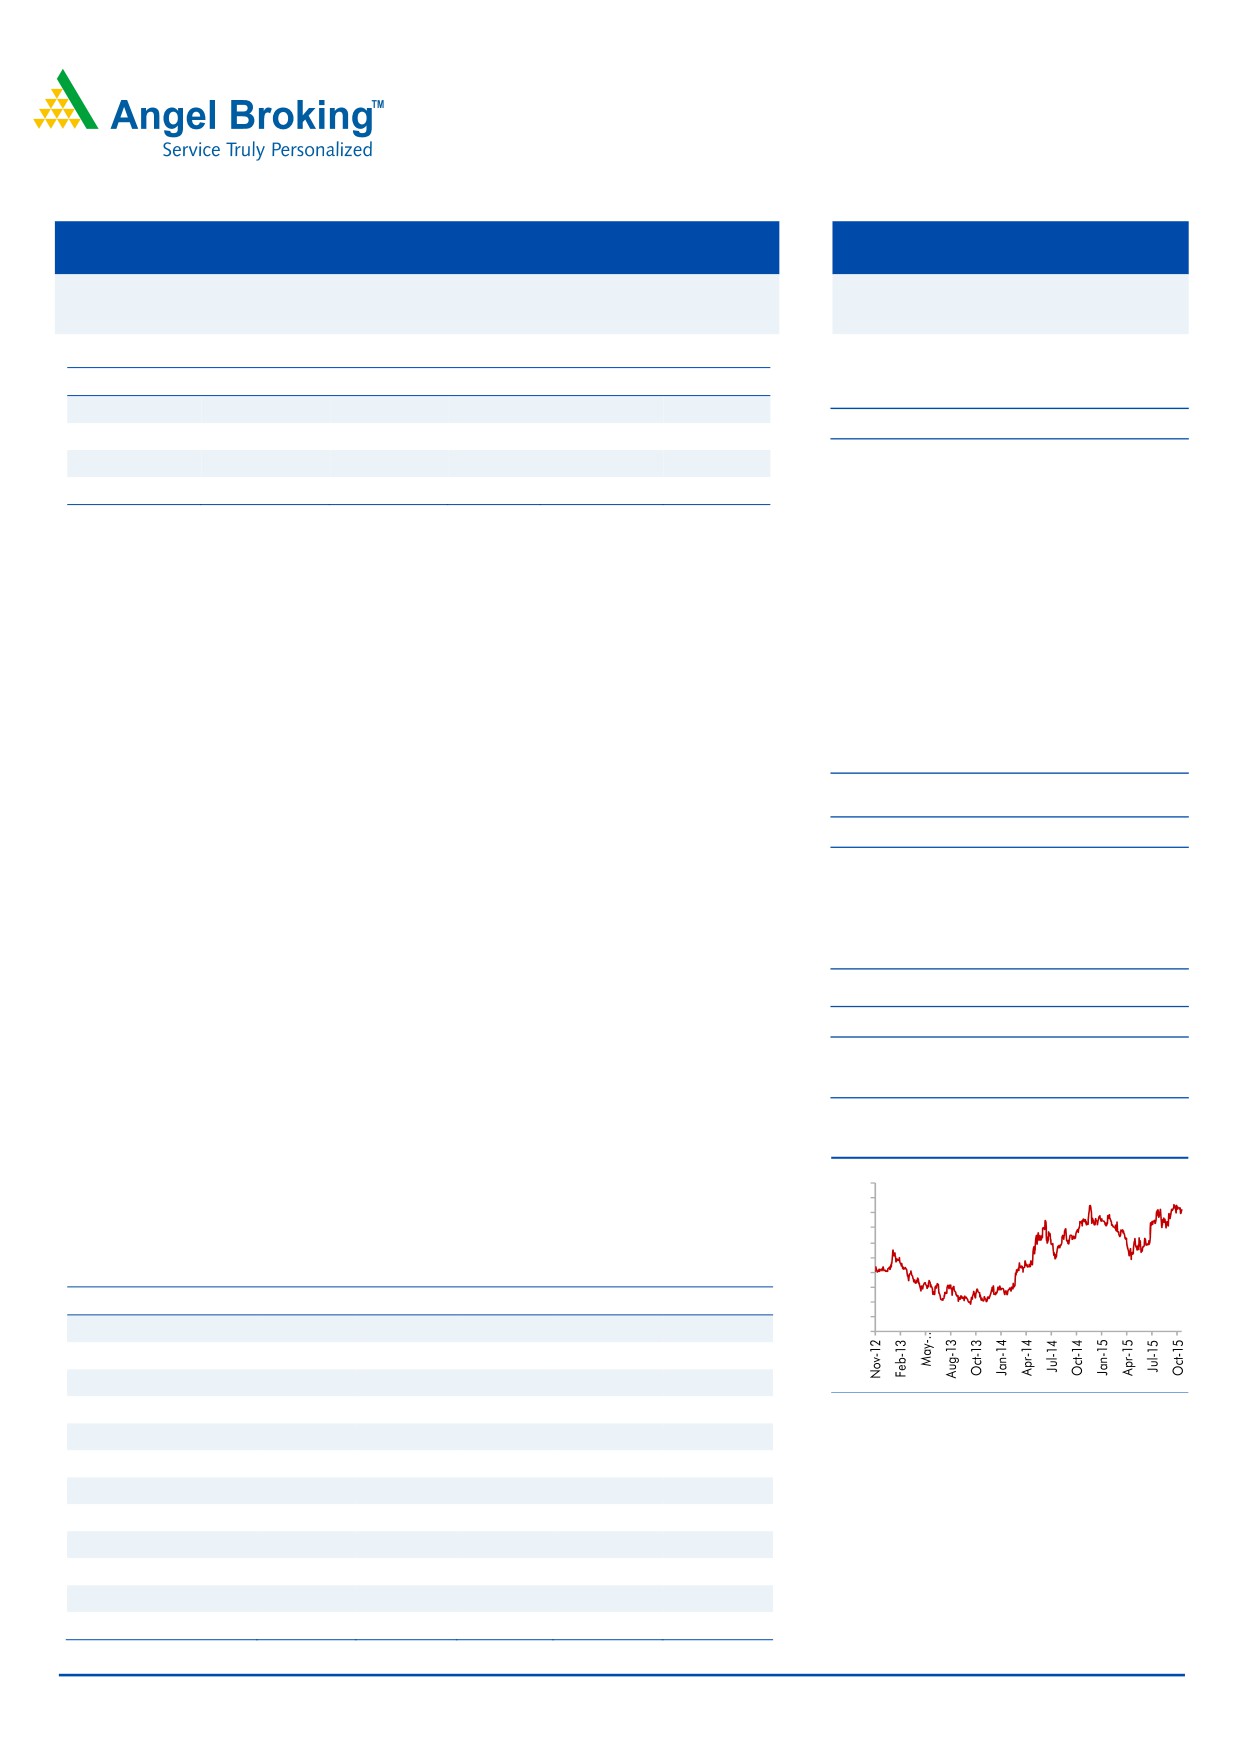
3-year price chart
economy. Further, the acquisition of Radio City is also expected to boost the
160
150
company’s profitability, going ahead. Hence, we maintain our Buy rating on the stock
140
with a target price of `169.
130
120
110
Key financials (Consolidated)
100
90
Y/E March (` cr)
FY2013
FY2014
FY2015
FY2016E
FY2017E
80
70
Net Sales
1,522
1,703
1,770
2,170
2,355
60
% chg
12.3
11.9
3.9
22.6
8.5
Adj. Net Profit
258
234
225
290
325
Source: Company, Angel Research
% chg
44.6
(9.4)
(3.6)
28.9
11.9
OPM (%)
19.2
22.5
25.5
27.2
26.2
EPS (`)
7.9
7.1
6.9
8.9
9.9
P/E (x)
18.5
20.4
21.2
16.5
14.7
P/BV (x)
5.1
5.0
4.2
3.4
3.0
RoE (%)
27.4
23.5
27.2
29.3
20.4
RoCE (%)
11.8
20.9
19.5
23.1
21.3
Amarjeet S Maurya
EV/Sales (x)
3.3
2.9
2.6
2.1
1.9
022-39357800 Ext: 6831
EV/EBITDA (x)
17.0
12.8
10.1
7.7
7.3
Source: Company, Angel Research; Note: CMP as of November 4, 2015
Please refer to important disclosures at the end of this report
1
Jagran Prakashan | 2QFY2016 Result Update
Exhibit 1: Quarterly performance (Consolidated)
Y/E March (` cr)
2QFY16
2QFY15
% yoy
1QFY16
% qoq
FY2015
FY2014
% chg
Net Sales
520
436
19.1
481
8.0
1,770
1,703
3.9
Consumption of RM
155
160
(3.6)
156
(0.8)
626
609
2.7
(% of Sales)
29.7
36.7
32.4
35.3
35.8
Staff Costs
82
65
26.3
72
13.3
263
240
10.0
(% of Sales)
15.7
14.8
15.0
14.9
14.1
Other Expenses
136
105
29.8
118
15.2
430
482
(10.7)
(% of Sales)
26.3
24.1
24.6
24.3
28.3
Total Expenditure
373
330
12.9
346
7.6
1,319
1,330
(0.8)
Operating Profit
147
106
38.3
135
8.9
451
373
20.9
OPM
28.3
24.3
28.0
25.5
21.9
Interest
8
7
10.5
13
(35.9)
37
35
7.0
Depreciation
29
25
17.0
23
24.1
104
79
31.3
Other Income
14
7
116
108
47
132.3
PBT (excl. Ext Items)
124
82
52.1
215
(42.3)
418
306
36.8
Ext Income/(Expense)
0
0
PBT (incl. Ext Items)
124
82
52.1
215
(42.3)
418
306
36.8
(% of Sales)
23.9
18.7
44.7
23.6
18.0
Provision for Taxation
33
25
35
110
79
38.7
(% of PBT)
26.4
30.6
16.2
26.3
26.0
Recurring PAT
91
57
61.3
180
(49.3)
308
226
36.2
PATM
17.6
13.0
37.4
17.4
13.3
Minority Interest After NP
0.0
0.0
0.2
(0.3)
Profit/Loss of Associate Company
(0.0)
(0.0)
(0.0)
0.0
0.0
(0.4)
Reported PAT
91
57
61.4
180
(49.3)
308
226
36.2
Extra-ordinary Items
15
2
106
83
(7)
Adj. PAT
77
54
41.7
73.7
4.2
225
234
(3.6)
Equity shares (cr)
33
33
33
33
32.69
FDEPS (`)
2.8
1.7
61.4
5.5
(49.3)
9.4
6.9
36.2
Source: Company, Angel Research
Acquisition of Radio City boosts Ad revenue
The company reported a ~27% yoy growth in advertising revenue to ~`520cr on
the back of increase in yields and optimum utilization of advertisement inventory. In
the print business, the company reported a 6% yoy growth to ~`464cr and the
balance of the revenue came from radio advertising. However, the company’s
other businesses witnessed a decline in operating income owing to its policy of not
aggressively pursuing unprofitable non-print businesses, which led to a fall in the
overall top-line.
Circulation revenue up 4% yoy
The company’s circulation revenue for the quarter was up ~4% yoy to `100cr due
to increase in cover prices. Further, the Management expects 8-10% growth in
circulation revenue, going ahead.
November 5, 2015
2
Jagran Prakashan | 2QFY2016 Result Update
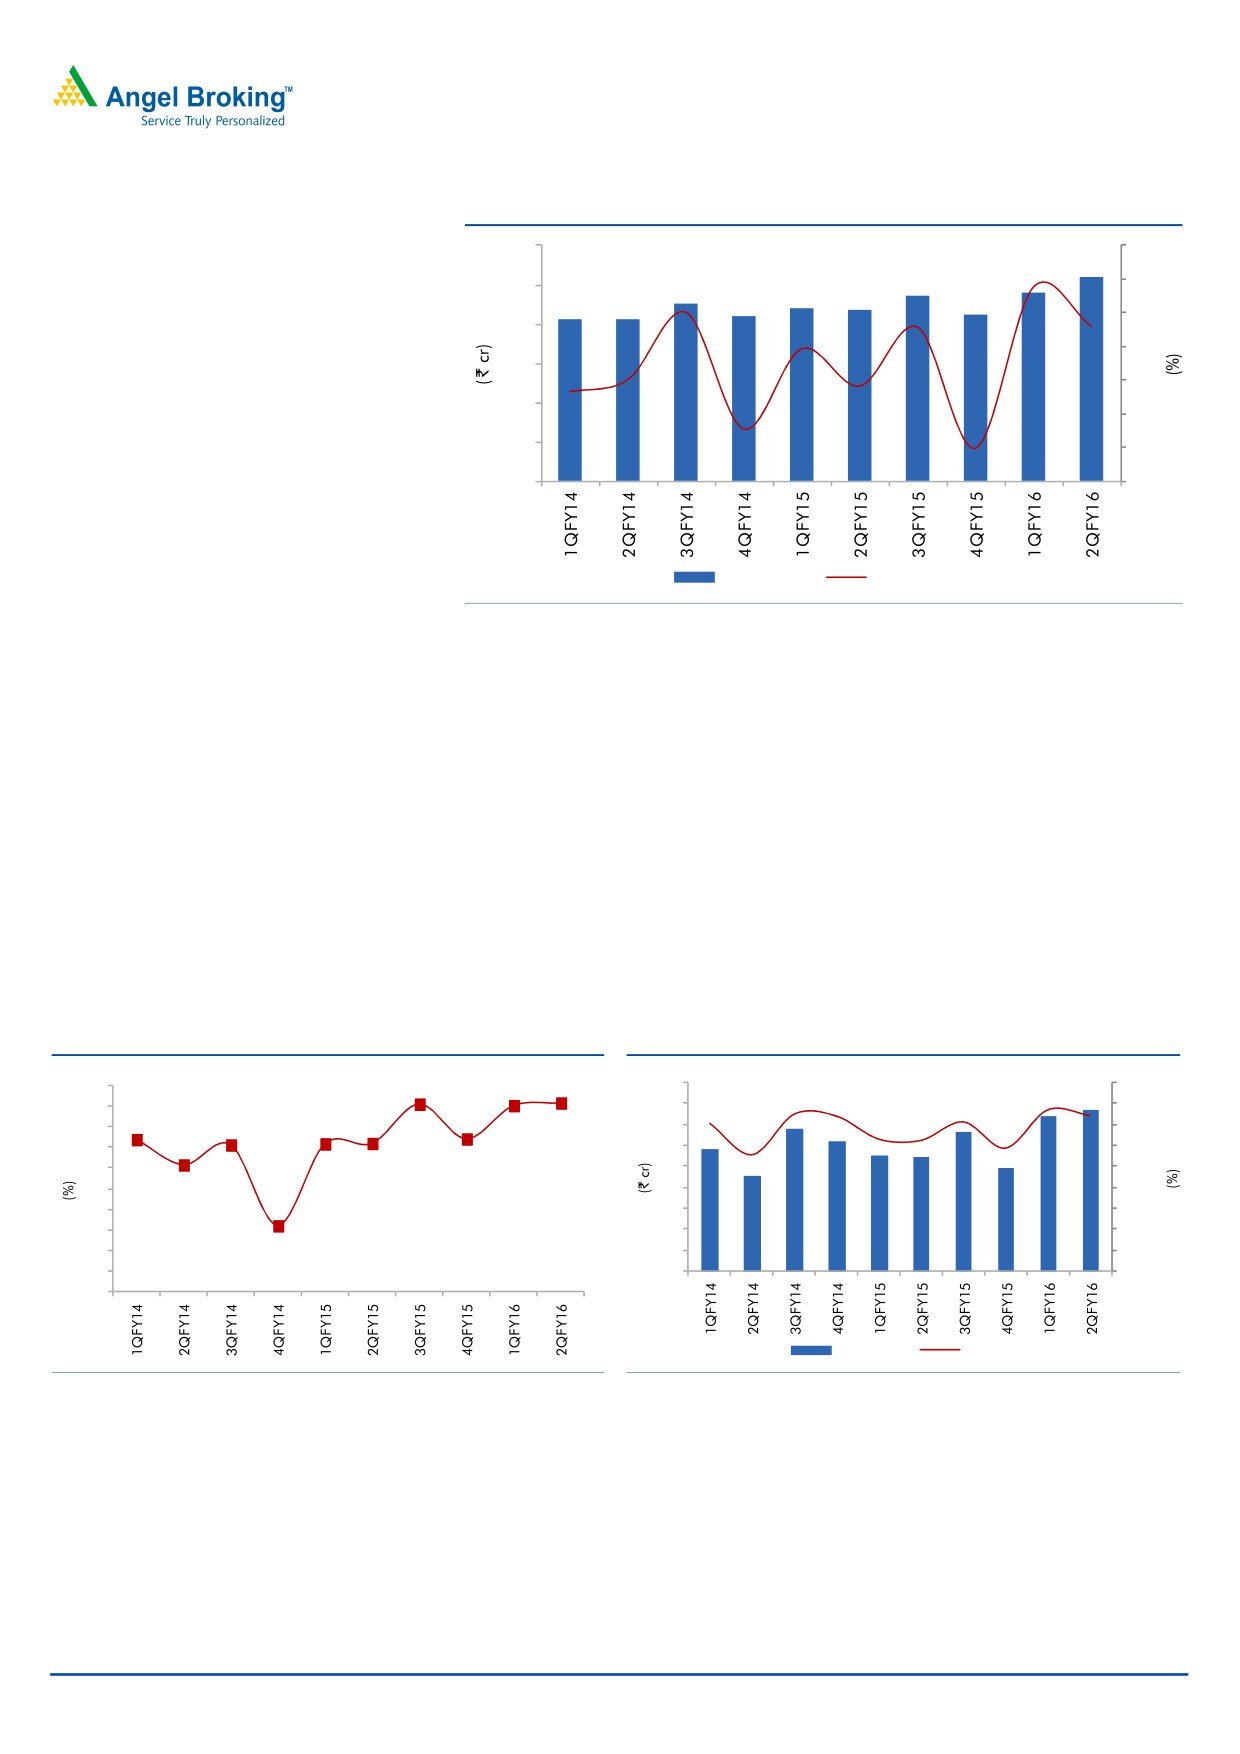
Exhibit 2: Consolidated Net sales growth trend
600
20
15
500
10
400
5
300
0
200
(5)
100
(10)
0
(15)
Net Sale
QoQ growth (%)
Source: Company, Angel Research
Improved operating performance
For the quarter, JPL’s flagship daily - Dainik Jagran’s margin expanded yoy to
34.8%. Other publications reported a cumulative operating profit of `7cr in
2QFY2016 as against a loss of `2cr for the same quarter last year. Overall, the
consolidated EBITDA grew by ~38% yoy to `147cr and the OPM expanded by
393bp yoy to 28.2% owing to lower raw material costs (down 700bp as a % of
sales, mainly due to lower news print costs). Further, the company is not
aggressively pursuing other unprofitable businesses which led to a fall in the top-line
for the quarter, although these businesses contributed towards improvement in the
overall operating margins. Overall, at the consolidated level, the reported net profit
grew to ~61% yoy to `91cr (including profit of the radio business).
Exhibit 3: Consolidated operating margin trend
Exhibit 4: Consolidated Net profit and margin trend
30
90
18.0
28
80
16.0
26
70
14.0
24
60
12.0
22
50
10.0
20
40
8.0
18
30
6.0
16
20
4.0
14
10
2.0
12
0
0.0
10
Net Profit
Margin (%)
Source: Company, Angel research
Source: Company, Angel research
November 5, 2015
3
Jagran Prakashan | 2QFY2016 Result Update
Exhibit 5: Operating performance
2QFY2016
2QFY2016
% yoy 1FY2016 1HFY2015
% chg
Dainik Jagran
Operating Revenue
362.5
336.0
7.9
723.9
671.9
7.7
Operating Profit
126.3
110.3
14.5
248.3
224.5
10.6
Operating Margin (%)
34.8
32.8
-
34.3
33.4
-
Other Publications
Operating Revenue
79.2
76.7
3.3
158.2
152.8
3.5
Operating Profit
7.0
-2.4
-
13.9
-10.0
-
Operating Margin (%)
8.8
-3.1
-
8.8
-6.5
-
Source: Company, Angel Research
Investment rationale
Advertising revenue expected to bounce on back of improvement in economy:
After cutting advertising rates in FY2013, JPL has again been hiking rates since
the beginning of FY2014. The Management expects yield driven advertising
revenue growth to continue in FY2015, enabling the company to post decent
growth in top-line. Further, considering Dainik Jagran’s status as the most
read Hindi newspaper and its strong presence in the rapidly growing Hindi
markets of Bihar, Haryana, Jharkhand, Punjab, Madhya Pradesh and Uttar
Pradesh, we believe JPL will benefit the most from an eventual recovery in the
Indian economy.
Recent acquisitions to fuel growth: The acquisition of the radio business (Radio
City) would also boost the company's revenue going ahead. Radio City has
~20 stations across 7 states in the country and is second only to ENIL in all its
operating circles, ie Delhi, Mumbai, Bengaluru, Chennai, Ahmedabad,
Hyderabad, Pune and Lucknow. The company covers ~51% (~66mn people)
of the total radio population.
Falling raw material prices to boost profitability: Raw material prices
(newsprint costs) have been declining over the past 5 quarters and are
expected to remain stable, going forward. Thus, considering lower news print
costs, healthy sales, and higher margins in the radio business, we expect the
company to post higher profitability, going ahead.
Outlook and valuation
Considering Dainik Jagran’s status as the most read Hindi newspaper in the
country and its strong presence in the rapidly growing Hindi markets of Bihar,
Haryana, Jharkhand, Punjab, Madhya Pradesh and Uttar Pradesh, we expect JPL to
benefit the most from an eventual recovery in the Indian economy. Further, the
acquisition of Radio City will also boost the company’s profitability, going ahead.
Hence, we maintain our Buy rating on the stock with a target price of `169.
November 5, 2015
4
Jagran Prakashan | 2QFY2016 Result Update
Company Background
Dainik Jagran, with an AIR of ~16.4mn, is the most read newspaper in India
published by Jagran Prakashan (JPL). The company enjoys a leadership position in
Uttar Pradesh, the largest Hindi market for almost a decade now. The company is
present in the rapidly growing Hindi print media markets of Bihar, Delhi, Haryana,
Jharkhand, Punjab and Uttar Pradesh. Apart from its commanding position in print
media, JPL is also present in the internet, OOH, and event management
businesses.
November 5, 2015
5
Jagran Prakashan | 2QFY2016 Result Update
Profit & Loss Statement (Consolidated)
Y/E March (` cr)
FY12
FY13
FY14
FY15
FY16E
FY16E
Total operating income
1,356
1,522
1,703
1,770
2,170
2,355
% chg
11.0
12.3
11.9
3.9
22.6
8.5
Total Expenditure
1,039
1,229
1,320
1,319
1,580
1,738
Cost of Materials
461
544
609
626
720
803
Personnel
194
227
240
263
326
356
Others
383
458
472
430
534
579
EBITDA
317
292
383
451
590
617
% chg
(11.1)
(7.7)
30.9
17.8
31.0
4.5
(% of Net Sales)
23.4
19.2
22.5
25.5
27.2
26.2
Depreciation& Amortisation
71
126
79
104
120
141
EBIT
246
167
304
347
470
476
% chg
(15.5)
(32.1)
82.0
14.3
35.5
1.3
(% of Net Sales)
18.1
11.0
17.8
19.6
21.7
20.2
Interest & other Charges
16
31
35
37
45
45
Other Income
25
119
47
108
140
20
(% of PBT)
10.0
46.6
14.8
25.9
24.7
4.4
Share in profit of Associates
-
-
-
-
-
-
Recurring PBT
256
255
316
418
565
451
% chg
(17.0)
(0.2)
23.8
32.5
35.0
(20.1)
Prior Period & Ex-ord. Exp./(Inc.)
-
-
10
-
-
-
PBT (reported)
256
255
306
418
565
451
Tax
77
0
79
110
158
126
(% of PBT)
30.2
0.2
26.0
26.3
28.0
28.0
PAT (reported)
178
255
226
308
407
325
Add: Share of earnings of asso.
(0)
(1)
(0)
0
0
0
Less: Minority interest (MI)
(0)
(0)
(0)
0
0
0
PAT after MI (reported)
178
255
226
308
406
325
Extra-ordinary Items
-
(3)
(7)
83
116
-
ADJ. PAT
178
258
234
225
290
325
% chg
(15.1)
44.6
(9.4)
(3.6)
28.9
11.9
(% of Net Sales)
13.2
16.9
13.7
12.7
13.4
13.8
Adj.Basic EPS (`)
5.5
7.9
7.1
6.9
8.9
9.9
% chg
(14.8)
44.6
(9.4)
(3.6)
28.9
11.9
November 5, 2015
6
Jagran Prakashan | 2QFY2016 Result Update
Balance Sheet (Consolidated)
Y/E March (` cr)
FY12
FY13
FY14
FY15
FY16E
FY17E
SOURCES OF FUNDS
Equity Share Capital
63
63
62
63
63
63
Reserves& Surplus
689
869
899
1,071
1,323
1,524
Shareholders’ Funds
752
932
962
1,134
1,386
1,587
Minority Interest
8
1
1
1
1
1
Total Loans
668
484
490
648
648
648
Deferred Tax Liability
76
89
91
78
78
78
Total Liabilities
1,503
1,506
1,543
1,861
2,113
2,314
APPLICATION OF FUNDS
Gross Block
1,216
1,241
1,336
1,418
1,483
1,603
Less: Acc. Depreciation
351
466
545
644
765
906
Net Block
865
776
791
773
718
697
Capital Work-in-Progress
66
131
114
72
72
72
Investments
252
222
332
357
357
357
Current Assets
672
672
688
1,051
1,393
1,569
Inventories
78
83
100
93
119
142
Sundry Debtors
289
319
343
364
464
516
Cash
100
52
33
493
528
534
Loans & Advances
196
155
151
36
174
212
Other
11
62
62
65
109
165
Current liabilities
358
313
388
399
435
389
Net Current Assets
314
358
300
651
958
1,181
Deferred Tax Asset
6
19
6
7
7
7
Mis. Exp. not written off
-
-
-
-
-
-
Total Assets
1,503
1,506
1,543
1,861
2,113
2,314
November 5, 2015
7
Jagran Prakashan | 2QFY2016 Result Update
Cashflow Statement (Consolidated)
Y/E March (` cr)
FY12
FY13
FY14
FY15E
FY16E
FY17E
Profit before tax
256
255
306
418
565
451
Depreciation
71
125
89
104
120
141
Change in Working Capital
(14)
(69)
(13)
(51)
(271)
(216)
Interest / Dividend (Net)
0
24
29
22
45
45
Direct taxes paid
(75)
(50)
(62)
(70)
(158)
(126)
Others
(10)
(83)
(19)
14
-
-
Cash Flow from Operations
228
202
331
437
300
294
(Inc.)/ Dec. in Fixed Assets
(160)
(194)
(60)
(415)
(100)
(121)
(Inc.)/ Dec. in Investments
(53)
30
(110)
(25)
-
-
Cash Flow from Investing
(213)
(164)
(170)
(441)
(100)
(121)
Issue of Equity
-
-
-
-
-
-
Inc./(Dec.) in loans
148
87
(26)
139
35
1
Dividend Paid (Incl. Tax)
(111)
(111)
(95)
(93)
(154)
(123)
Interest / Dividend (Net)
13
(63)
(59)
417
(45)
(45)
Cash Flow from Financing
50
(86)
(180)
463
(165)
(167)
Inc./(Dec.) in Cash
65
(48)
(20)
459
35
6
Opening Cash balances
35
100
52
33
493
528
Closing Cash balances
100
52
33
493
528
534
November 5, 2015
8
Jagran Prakashan | 2QFY2016 Result Update
Key Ratios
Y/E March
FY12
FY13
FY14
FY15
FY16E
FY17E
Valuation Ratio (x)
P/E (on FDEPS)
26.8
18.5
20.4
21.2
16.5
14.7
P/CEPS
19.1
12.5
15.6
11.6
9.1
10.3
P/BV
6.3
5.1
5.0
4.2
3.4
3.0
Dividend yield (%)
2.4
1.4
0.7
1.4
1.7
2.1
EV/Sales
3.8
3.3
2.9
2.6
2.1
1.9
EV/EBITDA
16.1
17.0
12.8
10.1
7.7
7.3
EV / Total Assets
2.7
2.7
2.5
2.0
1.8
1.7
Per Share Data (`)
EPS (Basic)
5.5
7.9
7.1
6.9
8.9
9.9
EPS (fully diluted)
5.5
7.9
7.1
6.9
8.9
9.9
Cash EPS
7.6
11.6
9.3
12.6
16.1
14.2
DPS
3.5
2.0
1.0
2.0
2.5
3.0
Book Value
23.0
28.5
29.4
34.7
42.4
48.6
Returns (%)
RoCE
17.3
11.8
20.9
19.5
23.1
21.3
Angel RoIC (Pre-tax)
23.0
14.6
27.9
37.2
40.9
35.4
RoE
23.7
27.4
23.5
27.2
29.3
20.4
Turnover ratios (x)
Asset Turnover
1.1
1.2
1.3
1.2
1.5
1.5
Inventory / Sales (days)
21
20
21
19
20
22
Receivables (days)
78
77
73
75
78
80
Payables (days)
27
27
28
24
23
23
Net Working capital (days)
72
69
67
71
75
79
November 5, 2015
9
Jagran Prakashan | 2QFY2016 Result Update
Research Team Tel: 022 - 39357800
DISCLAIMER
Angel Broking Private Limited (hereinafter referred to as “Angel”) is a registered Member of National Stock Exchange of India Limited,
Bombay Stock Exchange Limited and Metropolitan Stock Exchange of India Limited. It is also registered as a Depository Participant with
CDSL and Portfolio Manager with SEBI. It also has registration with AMFI as a Mutual Fund Distributor. Angel Broking Private Limited is
a registered entity with SEBI for Research Analyst in terms of SEBI (Research Analyst) Regulations, 2014 vide registration number
INH000000164. Angel or its associates has not been debarred/ suspended by SEBI or any other regulatory authority for accessing
/dealing in securities Market. Angel or its associates including its relatives/analyst do not hold any financial interest/beneficial
ownership of more than 1% in the company covered by Analyst. Angel or its associates/analyst has not received any compensation /
managed or co-managed public offering of securities of the company covered by Analyst during the past twelve months. Angel/analyst
has not served as an officer, director or employee of company covered by Analyst and has not been engaged in market making activity
of the company covered by Analyst.
This document is solely for the personal information of the recipient, and must not be singularly used as the basis of any investment
decision. Nothing in this document should be construed as investment or financial advice. Each recipient of this document should
make such investigations as they deem necessary to arrive at an independent evaluation of an investment in the securities of the
companies referred to in this document (including the merits and risks involved), and should consult their own advisors to determine
the merits and risks of such an investment.
Reports based on technical and derivative analysis center on studying charts of a stock's price movement, outstanding positions and
trading volume, as opposed to focusing on a company's fundamentals and, as such, may not match with a report on a company's
fundamentals.
The information in this document has been printed on the basis of publicly available information, internal data and other reliable
sources believed to be true, but we do not represent that it is accurate or complete and it should not be relied on as such, as this
document is for general guidance only. Angel Broking Pvt. Limited or any of its affiliates/ group companies shall not be in any way
responsible for any loss or damage that may arise to any person from any inadvertent error in the information contained in this report.
Angel Broking Pvt. Limited has not independently verified all the information contained within this document. Accordingly, we cannot
testify, nor make any representation or warranty, express or implied, to the accuracy, contents or data contained within this document.
While Angel Broking Pvt. Limited endeavors to update on a reasonable basis the information discussed in this material, there may be
regulatory, compliance, or other reasons that prevent us from doing so.
This document is being supplied to you solely for your information, and its contents, information or data may not be reproduced,
redistributed or passed on, directly or indirectly.
Neither Angel Broking Pvt. Limited, nor its directors, employees or affiliates shall be liable for any loss or damage that may arise from
or in connection with the use of this information.
Note: Please refer to the important ‘Stock Holding Disclosure' report on the Angel website (Research Section). Also, please refer to the
latest update on respective stocks for the disclosure status in respect of those stocks. Angel Broking Pvt. Limited and its affiliates may
have investment positions in the stocks recommended in this report.
Disclosure of Interest Statement
Jagran Prakashan
1. Analyst ownership of the stock
No
2. Angel and its Group companies ownership of the stock
No
3. Angel and its Group companies' Directors ownership of the stock
No
4. Broking relationship with company covered
No
Note: We have not considered any Exposure below ` 1 lakh for Angel, its Group companies and Directors
Ratings (Based on expected returns
Buy (> 15%)
Accumulate (5% to 15%)
Neutral (-5 to 5%)
over 12 months investment period):
Reduce (-5% to -15%)
Sell (< -15)
November 5, 2015
10