2QFY2016 Result Update | Steel
October 23, 2015
JSW Steel
NEUTRAL
CMP
`906
Weakness persists
Target Price
-
Investment Period
-
(` cr)
2QFY16
2QFY15
yoy (%)
1QFY16
qoq%
Net Sales
9,653
11,886
(18.8)
9,982
(3.3)
S tock Info
EBITDA
1,566
2,620
(40.2)
1,505
4.1
Sector
S teel
EBITDA margin (%)
16.2
22.0
(582)bp
15.1
115bp
Market Cap (` cr)
21,895
Adj. PAT
349
943
(63.0)
168
107.8
Source: Company, Angel Research
Net Debt (` cr)
39,008
Beta
1.2
Steel price declines hurt margins: JSW Steel’s standalone revenues for 2QFY2016
52 Week High / L ow
1.274/801
come in at `9,653cr, in line with our estimate of `9,345cr. Raw Material expenses
Avg. Daily Volume
10,03,011
for the quarter, at ~`5,458cr, are 2.5% below our expectation, led by decline in
Face Value (`)
10
iron ore and coking coal prices. The EBITDA however declined by 40% yoy, owing
BSE Sensex
27,288
to a sharp decline in steel prices.
Nifty
8,252
Consolidated (` cr)
2QFY16
2QFY15
yoy%
1QFY16
qoq%
R euters Code
JSTL.BO
Net Sales
10,743
13,692
(21.5)
11,382
(5.6)
Bloomberg Code
JSTL IN
EBITDA
1,729
2,791
(38.0)
1,627
6.3
Margin (%)
16.1
20.4
(429)bp
14.3
180bp
Shareholding Pattern (% )
Adj. PAT
118
749
(84.2)
(106)
(211.6)
P romoters
41.5
Source: Company, Angel Research
MF / Banks / Indian Fls
5.2
Strong performance of subsidiaries: During the quarter, Coated Products’
FII / NR Is / OCBs
17.2
revenues came in ahead of our expectations at `1,927cr on account of higher
Indian P ublic / Others
36.2
realizations, while the segment’s EBITDA rose by 5.3% yoy to `102cr as against
our expectations of `60cr. The company’s Chilean operations posted an EBITDA
loss of $0.48mn as against a loss of $1.76mn in 2QFY2015, which is in line with
Abs . (% )
3m
1yr
3yr
the guidance. The company’s plate and pipe mill business in the US reported an
Sensex
(3.2)
2.7
46.1
EBITDA loss of $3.1mn, lower than our expectation of a EBITDA loss of $8.5mn.
JSW Steel
8.3
(23.0)
23.4
Outlook: The company’s results for the quarter are marginally better than our
expectations, but the outlook on steel prices continues to remain weak. Pressure
3-year price chart
from imports and slowdown in China remain key concerns for the domestic steel
1,600
1,400
industry. At the current price of `906, the stock trades at 7x FY2017 EV/EBITDA;
1,200
we retain our Neutral rating on the stock.
1,000
800
Key financials (Consolidated)
600
Y/E March (` cr)
FY2013
FY2014
FY2015
FY2016E
FY2017E
400
200
Net sales
38,095
50,409
52,051
42,308
45,147
0
% chg
11.6
32.3
3.3
(18.7)
6.7
Adj. net profit
1,361
2,141
1,822
(217)
1,229
% chg
3.6
4.2
3.5
(0.5)
2.7
Adj. EPS (`)
59.5
87.2
74.0
(10.3)
49.5
Source: Company, Angel Research
OPM (%)
17.1
18.2
18.0
16.4
20.7
P/E (x)
15.2
10.4
12.2
NMF
18.3
P/BV (x)
1.2
1.0
1.0
1.0
1.0
RoE (%)
8.1
11.2
8.4
(1.0)
5.6
RoCE (%)
9.7
10.9
8.9
4.4
7.3
Rahul Dholam
EV/Sales (x)
1.1
1.2
1.3
1.6
1.5
Tel: 022- 3935 7800 Ext: 6847
EV/EBIDTA
6.7
6.6
6.9
9.6
7.0
Source: Company, Angel Research: Note CMP as of October 21, 2015
Please refer to important disclosures at the end of this report
1
JSW Steel | 2QFY2016 Result Update
Exhibit 1: 2QFY2016 performance (Standalone)
(` cr)
2QFY16
2QFY15
yoy%
1QFY16
qoq%
FY2015
FY2014
yoy%
Net sales
9,653
11,886
(18.8)
9,982
(3.3)
45,352
44,529
1.8
Raw material
5,458
6,651
(17.9)
5,890
(7.3)
26,064
26,946
(3.3)
% of net sales
56.5
56.0
59.0
57.5
60.5
Power & fuel
834
953
(12.5)
843
(1.1)
3,476
3,354
3.6
% of net sales
8.6
8.0
8.4
7.7
7.5
Staff cost
257
237
8.5
261
(1.6)
947
800
18.4
% of net sales
2.7
2.0
2.6
2.1
1.8
Other expenditure
1,651
1,593
3.7
1,630
1.3
6,729
5,416
24.2
% of net sales
17.1
13.4
16.3
14.8
12.2
Total expenditure
8,199
9,434
(13.1)
8,623
(4.9)
37,216
36,515
1.9
% of net sales
84.9
79.4
86.4
82.1
82.0
Operating profit
1,453
2,452
(40.7)
1,358
7.0
8,136
8,014
1.5
Other operating income
113
168
(32.8)
146
(23.0)
736
768
(4.2)
EBIDTA
1,566
2,620
(40.2)
1,505
4.1
8,872
8,783
1.0
EBITDA margins (%)
16.2
22.0
15.1
19.6
19.7
0.16
Interest
675
720
(6.2)
653
3.3
2,909
2,495
16.6
Depreciation
510
699
(27.1)
752
(32.2)
2,785
2,726
2.2
Other income
106
119
(11.1)
92
14.6
209
86
143.7
Exceptional items
116
(190)
(146)
(396)
(1,692)
Profit before tax
371
1,131
(67.2)
46
704.9
2,992
1,955
42.4
% of net sales
3.8
9.5
0.5
6.6
4.4
Tax
130
369
(64.8)
15
747.4
1,082
621
74.4
% of PBT
35.0
32.6
33.2
36.2
31.8
Reported PAT
241
762
(68.4)
31
683.7
1,909
1,335
43.1
Adj. PAT
349
943
(63.0)
168
107.8
2,305
3,003
(23.2)
Source: Company, Angel Research
Result highlights
Lower realizations continue to dent margins
The company’s standalone revenues for the quarter, at `9,653cr, are in line with
our estimate of
`9,345cr. Raw Material expenses were
2.5% below our
expectations at ~`5,458cr, owing to decline in iron ore and coking coal prices.
We expect the company to further benefit from raw material cost declines in
3QFY2016. Led by better-than-expected revenue, the standalone EBITDA was
2.5% ahead of our estimate at `1,566cr. The EBITDA margin however declined by
582bp yoy.
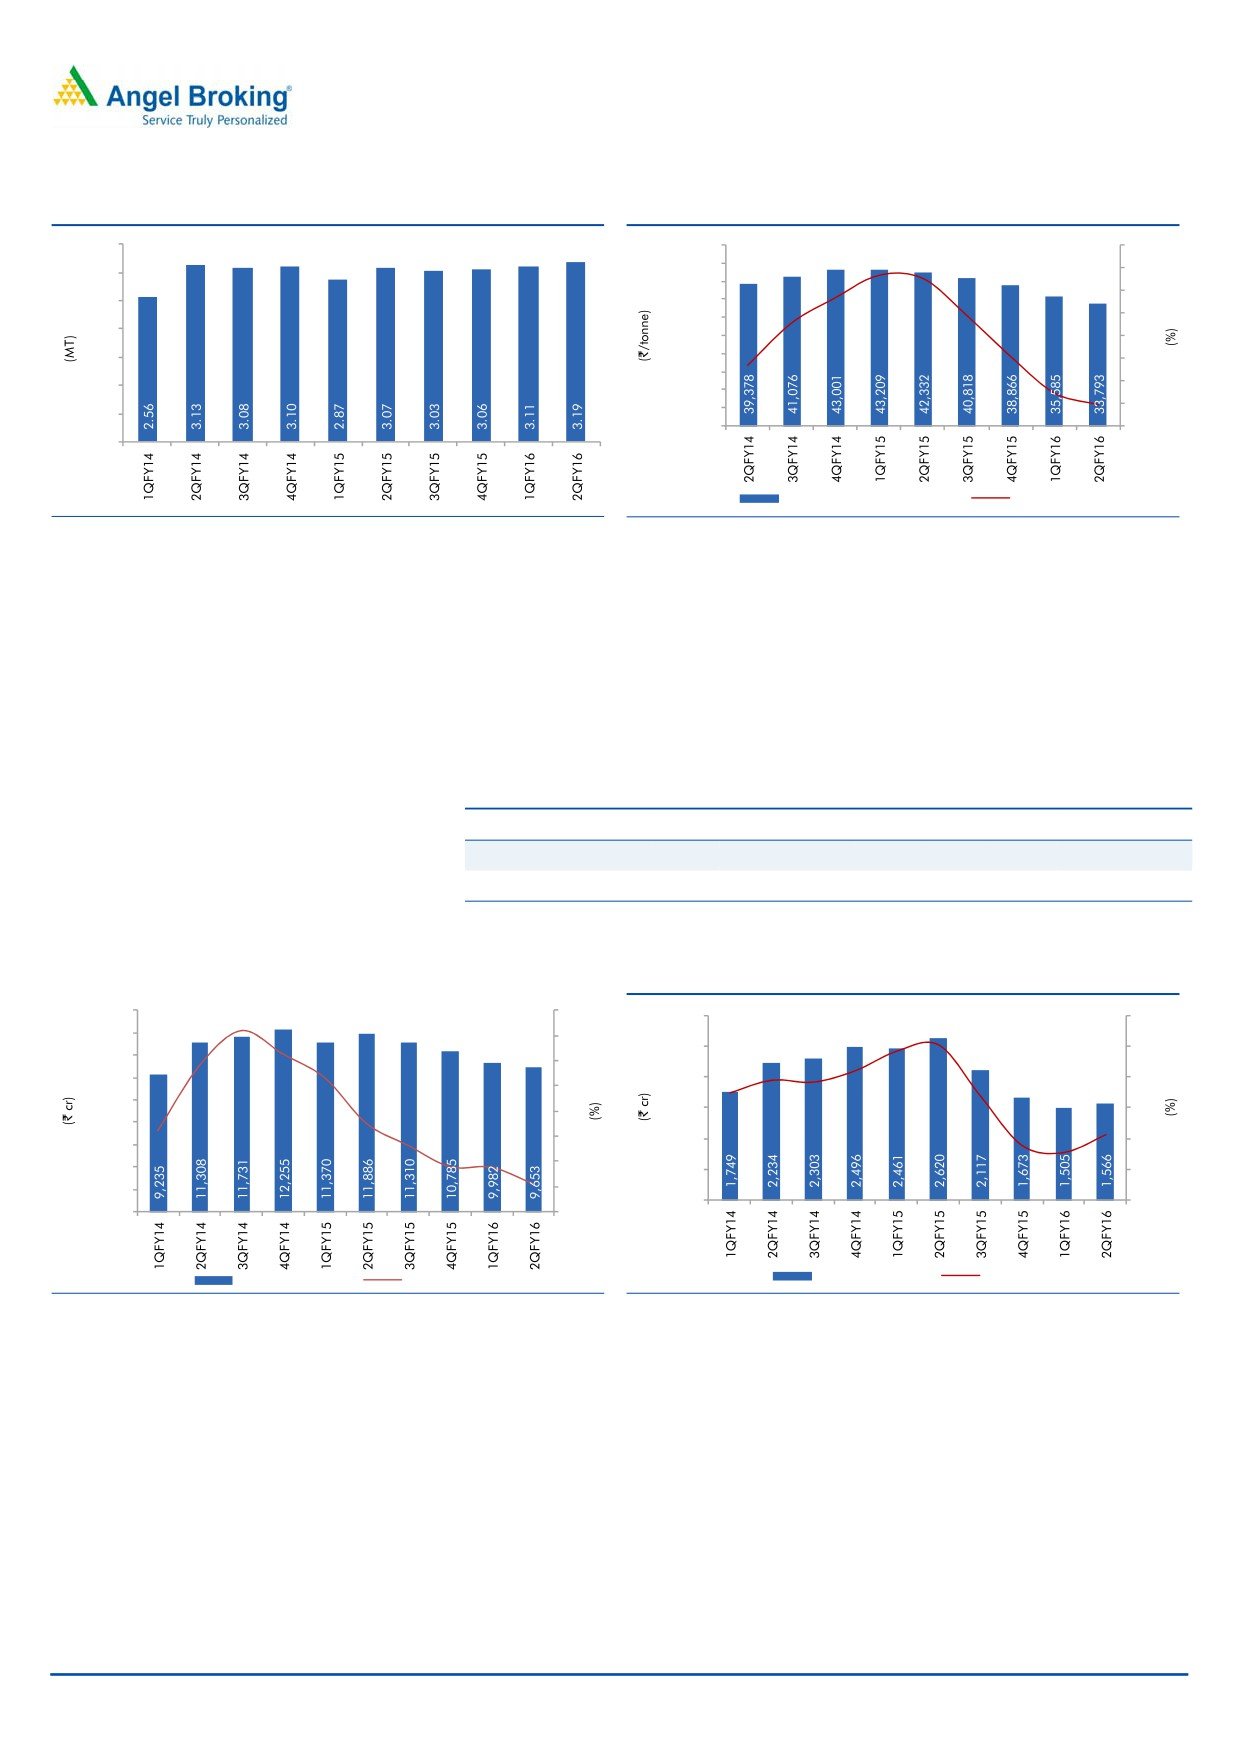
Gross realization/tonne for the quarter declined by 20% yoy to `33,793 from
`42,332 in 2QFY2016, but came in ahead of our expectation of `31,670.
Volumes grew to 3.19MT in 2QFY2016 as against 3.07MT in 2QFY2015, but
were marginally below our expectations of 3.24MT.
October 23, 2015
2
JSW Steel | 2QFY2016 Result Update
Exhibit 2: Volume growth remains steady
Exhibit 3: Realisation dips sharply
3.5
50,000
15
45,000
10
3.0
40,000
5
2.5
35,000
30,000
0
2.0
25,000
(5)
1.5
20,000
(10)
15,000
1.0
(15)
10,000
(20)
0.5
5,000
0
(25)
0.0
Gross Realisation per tonne
yoy change (RHS)
Source: Company, Angel Research
Source: Company, Angel Research
Depreciation expenses declined by 27% yoy, led by a change in the accounting
policy. Revisions in the Companies Act, 2013 allow companies to depreciate assets
over their useful life. Interest costs also declined by 6.2% yoy, led by a reduction in
finance costs. On the back of better-than-expected realisation and lower
depreciation expenses, the company managed to report a net profit of `241cr for
the quarter as against our expectation of a net loss of `44cr.
Exhibit 4: Quarterly performance trend
3Q14
4Q14
1Q15
2Q15
3Q15
4Q15
1Q16
2Q16
Realisation (`/tonne)
41,076 43,001 43,209 42,332 40,818 38,866 35,585 33,793
EBITDA (`/tonne)
7,478
8,052
8,575
8,534
6,988
5,469
4,838
4,908
Source: Company, Angel Research
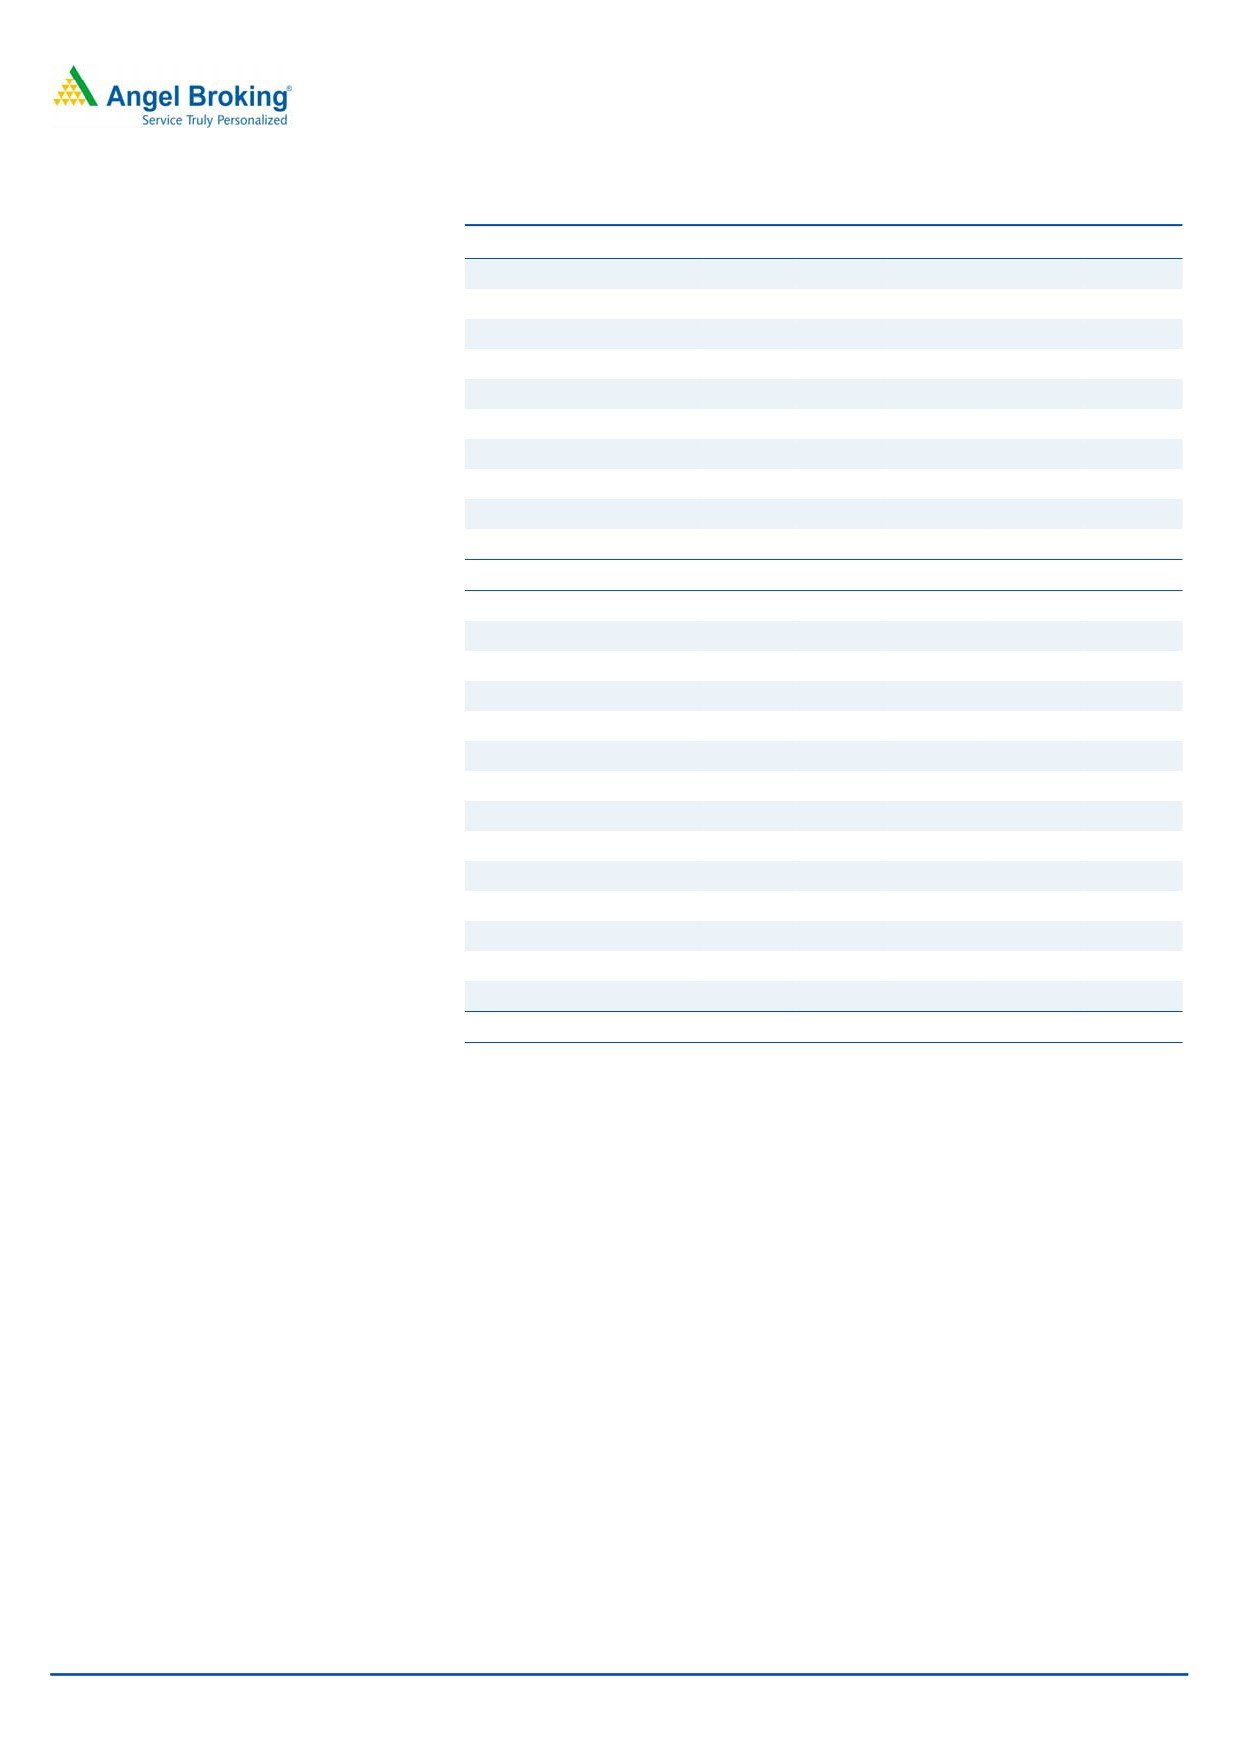
Exhibit 5: Revenue declines, owing to lower realisation
Exhibit 6: EBITDA margin declines 582bp yoy
13,500
50
3,000
24
12,000
40
2,500
22
10,500
30
9,000
2,000
20
20
7,500
10
1,500
18
6,000
0
1,000
16
4,500
(10)
3,000
500
14
1,500
(20)
0
12
0
(30)
Revenue (LHS)
yoy change (RHS)
EBITDA (LHS)
Margin (RHS)
Source: Company, Angel Research
Source: Company, Angel Research
October 23, 2015
3
JSW Steel | 2QFY2016 Result Update
Exhibit 7: 2QFY2016 performance (Consolidated)
(` cr)
2QFY16
2QFY15
yoy%
1QFY16
qoq%
FY2015
FY2014
yoy%
Net sales
10,743
13,692
(21.5)
11,382
(5.6)
52,051
50,409
3.3
Raw material
5,840
7,649
(23.7)
6,527
(10.5)
29,686
30,334
(2.1)
% of net sales
54.4
55.9
57.3
57.0
60.2
Power & fuel
981
1,095
(10.4)
1,034
(5.1)
4,123
3,813
8.1
% of net sales
9.1
8.0
9.1
7.9
7.6
Staff cost
323
387
(16.6)
422
(23.5)
1,533
1,298
18.1
% of net sales
3.0
2.8
3.7
2.9
2.6
Other expenditure
1,943
1,973
(1.5)
1,966
(1.2)
8,249
6,609
24.8
% of net sales
18.1
14.4
17.3
15.8
13.1
Total expenditure
9,178
11,104
(17.3)
9,949
(7.8)
43,590
42,054
3.7
% of net sales
85.4
81.1
87.4
83.7
83.4
Operating profit
1,565
2,588
(39.5)
1,433
9.2
8,460
8,355
1.3
Other operating income
164
203
(19.1)
194
(15.5)
921
811
EBIDTA
1,729
2,791
(38.0)
1,627
6.3
9,381
9,165
2.4
EBITDA margin (%)
16.1
20.4
14.3
18.0
18.2
Interest
836
855
(2.2)
822
1.7
3,493
3,048
14.6
Depreciation
682
851
(19.8)
939
(27.3)
3,434
3,183
7.9
Other income
39
26
47.4
26
51.3
111
86
29.9
Exceptional items
(1)
0
(1)
(26)
(1,713)
Profit before tax
248
1,112
(77.7)
(108)
(329.1)
2,539
1,308
94.1
% of net sales
2.3
8.1
(1.0)
4.9
2.6
Tax
142
374
(61.9)
17
757.0
819
920
(10.9)
% of PBT
57.3
33.6
(15.3)
32.3
70.3
Reported PAT
117
749
(84.4)
(107)
(209.5)
1,720
388
343.3
Adj. PAT
118
749
(84.2)
(106)
(211.6)
1,822
2,141
(14.9)
Source: Company, Angel Research
Exhibit 8: Consolidated - 2QFY2016 Actual vs Angel estimates
(` cr)
Actual
Estimates
Variation (%)
Net sales
10,743
10,190
5.4
EBITDA
1,729
1,313
31.8
EBITDA margin (%)
16.1
12.9
322bp
Source: Company, Angel Research
Result highlights - Consolidated
Better than expected performance from subsidiaries
On a consolidated basis, the company’s net sales declined ~21.5% yoy to
`10,743cr, still ~5.4% ahead of our estimate. Coated Products’ revenues came in
ahead of our expectations at `1,927cr on account of higher realizations. Coated
Products’ realisations have not declined as sharply as HRC prices, which explain
the outperformance. Coated Products’ EBITDA increased 5.3% yoy to `102cr
during the quarter as against our expectations of `60cr. The company’s Chilean
operations posted an EBITDA loss of $0.48mn as against a loss of $1.76mn in
2QFY2015, in line with the guidance given by the company.
October 23, 2015
4
JSW Steel | 2QFY2016 Result Update
Exhibit 9: Quarterly performance trend (Coated Products)
3Q14
4Q14
1Q15
2Q15
3Q15
4Q15
1Q16
2Q16
Deliveries (MT)
0.42
0.44
0.40
0.41
0.37
0.39
0.40
0.37
EBITDA Margin
3.2
3.4
3.8
4.3
2.9
2.8
5.2
5.3
Source: Company, Angel Research
Strong realizations at US Plate and Pipe mill
The company’s plate and pipe mill business in the US reported an EBITDA loss of
$3.1mn as against our expectations of an EBITDA loss of $8.5mn. The lower than
expected loss was on account of better than expected realizations, leading to a
revenue of $53.4mn for the quarter as against our estimate of a revenue of
$42.5mn. Realisation/tonne dipped 2% yoy but increased 12% on a sequential
basis to $989, well ahead of our expectations of $735. Pipe volumes, at
15,964MT, also came in ahead of our expectations of 12,461MT. Plate volumes
however disappointed at 38,054MT as against our estimate of 42,250MT.
Exhibit 10: US Plate and Pipe Mill Volumes
MT
3Q14
4Q14
1Q15
2Q15
3Q15
4Q15
1Q16
2Q16
Plate Volumes
77813
85892
86642
78094
57898
58024
43614
38054
Pipe Volumes
17608
14217
8373
15096
16421
12138
15565
15964
Source: Company
October 23, 2015
5
JSW Steel | 2QFY2016 Result Update
Investment arguments
Capacity expansion remains on track
JSW Steel is in the process of increasing its capacity to 17.8MT by end-FY2016
from 14.3MT currently. The Management reiterated in the conference call that the
expansion is progressing as per schedule. The expansion at Dolvi, which includes
blast furnace modification, a new sinter plant, billet caster and a bar mill are
scheduled to be commissioned in 2HFY2016. Capacity at Dolvi is expected to
increase to 5MT post expansion from 3.3MT currently. The Vijaynagar expansion is
also expected to be completed by 4QFY2016. We expect volumes to continue to
grow, led by higher capacity. We estimate deliveries of 12.6MT and 13.7MT in
FY2016 and FY2017, respectively.
Margins to sustain going forward
While steel realizations have declined sharply, the company still has some levers to
sustain margins. These include, 1) Lower iron ore and coking coal prices are yet to
pass through. Domestic iron ore prices are expected to decline as supply in
Karnataka increases. The Management expects coking coal cost to decline by a
further $4-$5/tonne over the coming months. 2) The Management also indicated
certain cost saving measures and initiatives which will help reduce costs.
3) Improving mix toward higher margin value added products will help the
company drive its margins going forward.
October 23, 2015
6
JSW Steel | 2QFY2016 Result Update
Outlook and valuation
The results have been marginally better than our expectations, but the outlook on
steel prices continues to remain weak. Pressure from imports and slowdown in
China remain key concerns for the domestic steel industry. We believe that things
may not have bottomed out yet and expect further pain for the industry. In line with
our expectations, we have not materially changed our FY2016 and FY2017
EBITDA estimates. At the current price of `906, the stock trades at 7x FY2017
EV/EBITDA; we retain our Neutral rating on the stock.
Company background:
JSW Steel Ltd is India’s largest integrated steel producer with a manufacturing
capacity of 14.3MT with facilities in Karnataka, Tamil Nadu and Maharashtra. The
company’s products include hot rolled coils, cold rolled coils, wire rods, galvanized
coils and sheets (~35% share of value added and special products). ~20% of its
products are exported, making the company India’s largest exporter of coated
products with a presence in over 100 countries.
October 23, 2015
7
JSW Steel | 2QFY2016 Result Update
Profit & Loss Statement (Consolidated)
Y/E March (` cr)
FY2013
FY2014
FY2015
FY2016E
FY2017E
Gross sales
41,463
54,621
56,577
45,987
49,072
Less: Excise duty
3,368
4,212
4,164
3,385
3,612
Net Sales
38,095
50,409
52,051
42,308
45,147
Other operating income
115
811
921
715
762
Total operating income
38,210
51,220
52,972
43,022
45,909
% chg
11.2
34.0
3.4
(18.8)
6.7
Total Expenditure
31,706
42,054
43,590
36,104
36,581
Net Raw Materials
24,168
30,334
29,686
26,439
26,448
Other Mfg costs
6,557
10,422
12,372
8,419
8,804
Personnel
980
1,298
1,533
1,246
1,330
EBITDA
6,504
9,165
9,381
6,918
9,328
% chg
6.6
40.9
2.4
(26.3)
34.8
(% of Net Sales)
17.1
18.2
18.0
16.4
20.7
Depreciation& Amortisation
2,237
3,183
3,434
3,805
4,071
EBIT
4,266
5,983
5,947
3,114
5,258
% chg
2.3
40.2
(0.6)
(47.6)
68.9
(% of Net Sales)
11.2
11.9
11.4
7.4
11.6
Interest & other Charges
1,967
3,048
3,493
3,780
3,821
Other Income
70
86
111
220
253
(% of PBT)
2.9
2.8
4.3
(49.3)
15.0
Recurring PBT
2,369
3,021
2,565
(446)
1,690
% chg
(16.0)
27.5
(15.1)
(117.4)
(478.7)
Exchange gain/(loss)
(369)
(1,713)
(25.9)
(25.9)
(25.9)
PBT (reported)
1,999
1,308
2,539
(472)
1,664
Tax
845
920
819
(152)
537
(% of PBT)
42.3
70.3
32.3
32.3
32.3
PAT (reported)
1,154
388
1,720
(320)
1,127
Add: Share of earnings of asso.
(165)
14
2
2
2
Less: Minority interest (MI)
34
50
75
75
75
Extraordinary Expense/(Inc.)
61
-
-
-
-
PAT after MI (reported)
1,085
452
1,797
(243)
1,203
ADJ. PAT
1,361
2,141
1,822
(217)
1,229
% chg
(33.4)
57.3
(14.9)
(111.9)
(666.0)
(% of Net Sales)
3.6
4.2
3.5
(0.5)
2.7
Basic EPS (`)
59.5
87.2
74.0
(10.3)
49.5
Adj. fully Diluted EPS (`)
59.5
87.2
74.0
(10.3)
49.5
% chg
(33.9)
46.5
(15.2)
(114.0)
(578.8)
October 23, 2015
8
JSW Steel | 2QFY2016 Result Update
Balance Sheet (Consolidated)
Y/E March (` cr)
FY2013
FY2014
FY2015
FY2016E FY2017E
SOURCES OF FUNDS
Equity Share Capital
284
303
303
303
303
Reserves & Surplus
17,060
21,150
22,266
21,649
22,479
Shareholders Funds
17,344
21,453
22,569
21,952
22,781
Share Warrants
-
-
-
-
-
Minority Interest
197
167
98
23
(52)
Total Loans
26,812
39,749
45,772
46,772
46,772
Deferred Tax Liability
3,272
2,123
2,889
2,757
3,223
Other Long term liabilities
600
910
591
592
593
Long term provisions
41
60
90
100
110
Total Liabilities
48,482
64,947
72,760
72,947
74,179
APPLICATION OF FUNDS
Gross Block
44,553
59,736
68,604
73,563
78,546
Less: Acc. Depreciation
11,151
14,252
18,013
21,817
25,888
Net Block
33,402
45,484
50,591
51,746
52,659
Capital Work-in-Progress
5,898
9,400
8,265
8,306
5,822
Goodwill
1,314
1,562
1,585
1,685
1,725
Investments
1,750
663
599
598
599
Current Assets
11,790
15,382
18,817
17,675
18,433
Cash
1,653
663
1,913
1,954
2,336
Loans & Advances
2,535
4,272
3,395
2,971
3,396
Other
7,602
10,448
13,509
12,750
12,701
Current liabilities
9,246
12,693
13,159
13,124
11,122
Net Current Assets
2,544
2,690
5,658
4,551
7,312
Misc. Exp. not written off
-
-
-
-
-
Total Assets
48,482
64,947
72,760
72,947
74,179
October 23, 2015
9
JSW Steel | 2QFY2016 Result Update
Cash flow statement (Consolidated)
Y/E March (` cr)
FY2013
FY2014
FY2015
FY2016E FY2017E
Profit before tax
1,999
1,308
2,539
(472)
1,664
Depreciation
2,237
3,183
3,434
3,805
4,071
Change in Working Capital
589
(3,520)
(1,175)
1,148
(2,379)
Others
-
-
-
-
-
Direct taxes paid
511
404
773
(20)
71
Cash Flow from Operations
4,315
567
4,026
4,500
3,284
(Inc.)/ Dec. in Fixed Assets
(5,630)
(5,670)
(6,650)
(5,000)
(2,500)
(Inc.)/ Dec. in Investments
12.0
(56.8)
207.0
1.5
(1.5)
Share of profit from associates
185
56
86
0
0
Cash Flow from Investing
(5,433)
(5,671)
(6,357)
(4,999)
(2,502)
Issue of Equity
-
-
-
-
-
Inc./(Dec.) in loans
955
6,029
2,737
1,000
0
Dividend Paid (Incl. Tax)
227
315
344
372
372
Others
1,519
2,413.1
2,562.6
-
-
Cash Flow from Financing
(791)
3,300
(169)
628
(372)
Inc./(Dec.) in Cash
(1,909)
(1,803)
(2,500)
130
410
Opening Cash balances
683
302
579
913
954
Closing Cash balances
302
579
913
954
1,335
October 23, 2015
10
JSW Steel | 2QFY2016 Result Update
Key ratios
Y/E March
FY2013
FY2014
FY2015
FY2016E
FY2017E
Valuation Ratio (x)
P/E (on FDEPS)
15.2
10.4
12.2
NMF
18.3
P/CEPS
6.3
6.0
4.2
6.1
4.2
P/BV
1.2
1.0
1.0
1.0
1.0
Dividend yield (%)
1.1
1.2
1.3
1.3
1.3
EV/Sales
1.1
1.2
1.3
1.6
1.5
EV/EBITDA
6.7
6.6
6.9
9.6
7.0
EV/Total Assets
0.9
0.9
0.9
0.9
0.9
Per Share Data (`)
EPS (Basic)
59.5
87.2
74.0
(10.3)
49.5
EPS (fully diluted)
59.5
87.2
74.0
(10.3)
49.5
Cash EPS
143.4
150.3
216.4
147.3
218.2
DPS
10.0
11.0
12.0
12.0
12.0
Book Value
764.8
875.9
922.1
896.5
930.8
Dupont Analysis
EBIT margin
11.2
11.9
11.4
7.4
11.6
Tax retention ratio (%)
57.7
29.7
67.7
67.7
67.7
Asset turnover (x)
0.9
0.8
0.8
0.6
0.7
ROIC (Post-tax)
5.6
2.9
6.0
3.1
5.2
Cost of Debt (Post Tax)
4.7
2.7
5.5
5.5
5.5
Leverage (x)
1.4
1.8
1.9
2.0
1.9
Operating RoE
7.0
3.3
6.9
(1.8)
4.6
Returns (%)
RoCE (Pre-tax)
9.7
10.9
8.9
4.4
7.3
Angel RoIC (Pre-tax)
12.5
13.7
10.9
5.3
8.7
RoE
8.1
11.2
8.4
(1.0)
5.6
Turnover ratios (x)
Asset Turnover (Gross Block)
0.9
1.0
0.8
0.6
0.6
Inventory (days)
50
46
62
80
75
Receivables (days)
17
16
17
22
21
Payables (days)
27
26
29
33
29
WC cycle (ex-cash) (days)
13
44
60
75
72
Solvency ratios (x)
Net debt to equity
1.4
1.8
1.9
2.0
1.9
Net debt to EBITDA
3.6
4.2
4.6
6.4
4.7
Interest Coverage
2.2
2.0
1.7
0.8
1.4
October 23, 2015
11
JSW Steel | 2QFY2016 Result Update
Research Team Tel: 022 - 39357800
DISCLAIMER
Angel Broking Private Limited (hereinafter referred to as “Angel”) is a registered Member of National Stock Exchange of India Limited,
Bombay Stock Exchange Limited and Metropolitan Stock Exchange of India Limited.. It is also registered as a Depository Participant
with CDSL and Portfolio Manager with SEBI. It also has registration with AMFI as a Mutual Fund Distributor. Angel Broking Private
Limited is a registered entity with SEBI for Research Analyst in terms of SEBI (Research Analyst) Regulations, 2014 vide registration
number INH000000164. Angel or its associates has not been debarred/ suspended by SEBI or any other regulatory authority for
accessing /dealing in securities Market. Angel or its associates including its relatives/analyst do not hold any financial
interest/beneficial ownership of more than 1% in the company covered by Analyst. Angel or its associates/analyst has not received any
compensation / managed or co-managed public offering of securities of the company covered by Analyst during the past twelve
months. Angel/analyst has not served as an officer, director or employee of company covered by Analyst and has not been engaged in
market making activity of the company covered by Analyst.
This document is solely for the personal information of the recipient, and must not be singularly used as the basis of any investment
decision. Nothing in this document should be construed as investment or financial advice. Each recipient of this document should
make such investigations as they deem necessary to arrive at an independent evaluation of an investment in the securities of the
companies referred to in this document (including the merits and risks involved), and should consult their own advisors to determine
the merits and risks of such an investment.
Reports based on technical and derivative analysis center on studying charts of a stock's price movement, outstanding positions and
trading volume, as opposed to focusing on a company's fundamentals and, as such, may not match with a report on a company's
fundamentals.
The information in this document has been printed on the basis of publicly available information, internal data and other reliable
sources believed to be true, but we do not represent that it is accurate or complete and it should not be relied on as such, as this
document is for general guidance only. Angel Broking Pvt. Limited or any of its affiliates/ group companies shall not be in any way
responsible for any loss or damage that may arise to any person from any inadvertent error in the information contained in this report.
Angel Broking Pvt. Limited has not independently verified all the information contained within this document. Accordingly, we cannot
testify, nor make any representation or warranty, express or implied, to the accuracy, contents or data contained within this document.
While Angel Broking Pvt. Limited endeavors to update on a reasonable basis the information discussed in this material, there may be
regulatory, compliance, or other reasons that prevent us from doing so.
This document is being supplied to you solely for your information, and its contents, information or data may not be reproduced,
redistributed or passed on, directly or indirectly.
Neither Angel Broking Pvt. Limited, nor its directors, employees or affiliates shall be liable for any loss or damage that may arise from
or in connection with the use of this information.
Note: Please refer to the important ‘Stock Holding Disclosure' report on the Angel website (Research Section). Also, please refer to the
latest update on respective stocks for the disclosure status in respect of those stocks. Angel Broking Pvt. Limited and its affiliates may
have investment positions in the stocks recommended in this report.
Disclosure of Interest Statement
JSW Steel
1. Analyst ownership of the stock
No
2. Angel and its Group companies ownership of the stock
No
3. Angel and its Group companies' Directors ownership of the stock
No
4. Broking relationship with company covered
No
Note: We have not considered any Exposure below ` 1 lakh for Angel, its Group companies and Directors
Ratings (Based on expected returns
Buy (> 15%)
Accumulate (5% to 15%)
Neutral (-5 to 5%)
over 12 months investment period):
Reduce (-5% to -15%)
Sell (< -15)
October 23, 2015
12