4QFY2016 Result Update | Capital Goods
May 11, 2016
Inox Wind
BUY
CMP
`242
Performance Highlights
Target Price
`286
Quarterly Data (Consolidated)
Investment Period
12 months
( ` cr)
4QFY16
4QFY15
% chg (yoy) 3QFY16
% chg (qoq)
Total Income
1,829
930
96.6
941
94.2
Stock Info
EBITDA
312
170
83.3
155
102.1
Sector
Capital Goods
EBITDA margin (%)
17.1
18.3
(124bp)
16.4
67bp
Market Cap (` cr)
5,426
Reported PAT
209
118
77.5
103
103.1
Net debt (` cr)
971
Source: Company, Angel Research
Beta
1.3
Inox Wind Ltd. (IWL) reported below than expected set of revenue and bottom-line
52 Week High / Low
495/217
numbers. IWL reported top-line of
`1,828cr, below our expectations. Inox
Avg. Daily Volume
621,492
reported 96.9% yoy top-line increase, reflecting 328MW of Turnkey sale volume.
Face Value (`)
10
On the back of strong execution IWL reported 83.3% yoy increase in EBITDA to
`312cr. Reported EBITDA is below our expectations. Led by operating leverage,
BSE Sensex
25,773
IWL reported EBITDA margins of 17.1%. On excluding impact of non-recurring
Nifty
7,888
line-items, Inox reported adj. EBITDA margins of 16.4%. IWL reported 17bps yoy
Reuters Code
INWN NS
decline in Adj. PAT margins to 10.8%, which is below our expectations. Adj. PAT
Bloomberg Code
INXW IN
of the company grew 67.4% yoy to `197cr. High tax rate of 29.4% in 4QFY2016
restricted Adj. PAT growth.
Strong Order Book, gives better revenue visibility: Order book of IWL at
Shareholding Pattern (%)
4QFY2016-end stands at 1,104MW (down 6.3% yoy), having an execution of
Promoters
85.6
12-15 months. Company Management has maintained optimism about future
MF / Banks / Indian Fls
4.7
order inflows, on the back of government’s focus on Renewable sector, IWLs strong
FII / NRIs / OCBs
2.0
market positioning and capex pipeline of Independent Power Producers (IPPs).
Indian Public / Others
7.6
Outlook and Valuation: We forecast IWL’s top-line to grow at CAGR of 19.3%
during FY2016-18, on the back of recent capacity expansion, strong order book
of 1,104MW (gives revenue visibility for next 12-15 months), larger project sites.
Abs.(%)
3 Months
With addition of more efficient products to portfolio, we expect Adj. EBITDA
Sensex
3.9
margins to improve from 15.4% in FY2016 to 16.4% in FY2018E. Increase in
depreciation expenses, and conservative other income estimates, restrict Adj. PAT
Inox Wind
(11.7)
margin expansion during FY2016-18E to 10.6%. Post 17% correction in IWL stock
after 4QFY2016 results were announced, the stock is now trading at FY2017E
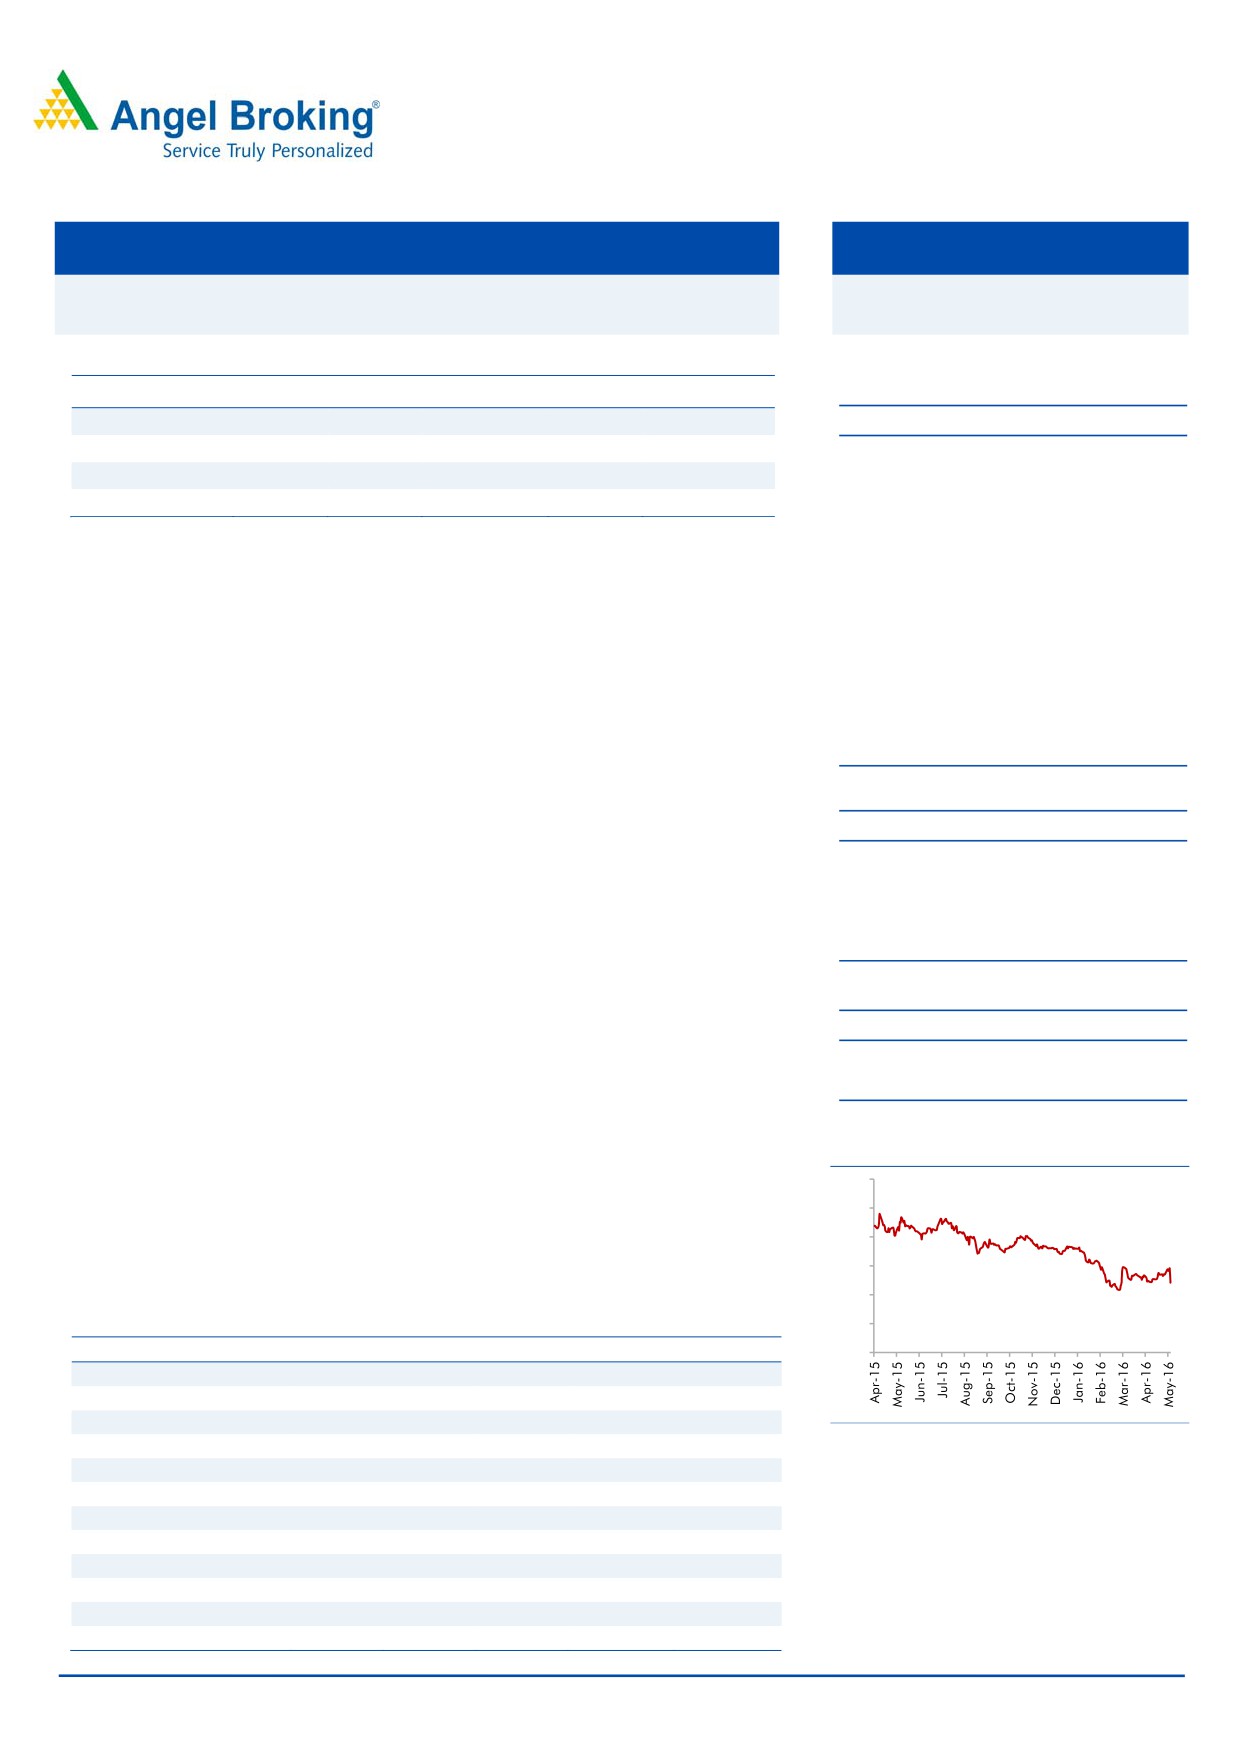
3 year price chart
and FY2018E, P/E multiple of 9.8x and 8.1x, respectively. Considering the
600
4QFY2016 Order Book, expected strong order inflow trends and profitability
500
growth, IWL stock is trading at attractive valuations. On assigning, 9.5x P/E
multiple to our FY2018E, EPS estimate of `30.0, we arrive at price target of `286,
400
which gives 18% upside from the current levels. Given the upside, we maintain
300
our BUY rating on the stock.
200
Key Financials (Consolidated)
100
Y/E March (` cr)
FY2014
FY2015
FY2016
FY2017E
FY2018E
0
Operating income
1,567
2,710
4,406
5,605
6,267
% chg
48.0
73.0
62.6
27.2
11.8
Adj PAT
132
296
452
549
666
Source: Company, Angel Research
% chg
(12.0)
124.1
52.4
21.6
21.3
EBITDA (%)
11.3
16.9
15.5
15.7
16.4
EPS (`)
6.6
13.4
20.4
24.8
30.0
P/E (x)
36.6
18.1
11.9
9.8
8.1
P/BV (x)
11.3
3.9
2.9
2.2
1.8
RoE (%)
36.6
32.6
27.9
25.9
24.4
RoCE (%)
20.8
27.4
23.1
23.9
25.5
Yellapu Santosh
EV/Sales (x)
3.4
2.0
1.4
1.1
0.9
022 - 3935 7800 Ext: 6811
EV/EBITDA (x)
29.9
12.0
9.2
6.9
5.6
Source: Company, Angel Research; Note: CMP as of May 10, 2016
Please refer to important disclosures at the end of this report
1
Inox Wind | 4QFY2016 Result Update
Exhibit 1: Quarterly Performance (Consolidated)
(` Cr)
4QFY16
4QFY15
% chg (yoy)
3QFY16
% chg (qoq)
FY2016
FY2015
% chg (yoy)
Net Sales
1,828
928
96.9
939
94.6
4,407
2,703
63.0
Other Operating Income
1
2
(41.8)
2
(59.5)
8
6
21.5
Total Income
1,829
930
96.6
941
94.2
4,414
2,709
62.9
Stock Adjustments
60
(134)
(18)
29
(144)
Raw Material
1,077
650
65.7
550
96.0
2,715
1,815
49.6
(% of total income)
62.2
55.4
56.5
62.1
61.7
Employee Cost
28
16
76.6
25
10.4
92
55
67.5
(% of total income)
1.5
1.7
2.7
2.1
2.0
EPC cost
237
194
22.1
146
61.7
535
364
47.0
(% of total income)
12.9
20.8
15.6
12.1
13.4
Other Expenses
127
34
267.8
84
51.5
366
163
124.6
(% of total income)
6.9
3.7
8.9
8.3
6.0
Total Expenditure
1,528
760
101.2
787
94.2
3,736
2,253
65.9
Exp. Capitalized & Goodwill written-off
12
0
0
12
0
EBITDA
312
170
83.3
155
102.1
690
456
51.2
(EBITDA %)
17.1
18.3
16.4
15.6
16.9
Interest
25
16
60.6
20
26.7
96
62
54.2
Depreciation
11
6
88.3
9
23.3
33
20
63.9
Other Income
20
4
422.9
15
34.3
66
15
335.6
PBT
296
153
77.3
141
92.3
627
389
61.2
PBT (%)
16.2
16.4
15.0
14.2
14.4
Total Tax
87
35
(149.9)
38
130.4
176
93
(89.3)
(% of PBT)
29.4
22.8
26.9
28.0
23.8
Rep. PAT
209
118
55.8
103
78.3
452
296
52.4
PAT Margins (%)
11.4
12.7
10.9
10.2
10.9
Adj. PAT
197
118
67.4
103
91.5
440
296
48.4
Adj. PAT Margins (%)
10.8
12.7
11.0
10.0
11.0
Rep. EPS (`)
9.4
5.3
77.5
4.6
103.1
20.4
13.4
52.4
Source: Company, Angel Research
Strong quarterly execution, but below our expectation…
IWL reported a top-line of `1,828cr, below our expectations. Lower than expected
revenues for the quarter is on account of delays in decision making by some of the
clients. Inox reported 94.6% yoy increase in revenues, reflecting (1) strong Turnkey
sale volume of 328MW (vs 198MW of volume in 4QFY2015), and (2) deliveries
taken for earlier deferment by some of the clients in 3QFY2016.
May 11, 2016
2
Inox Wind | 4QFY2016 Result Update
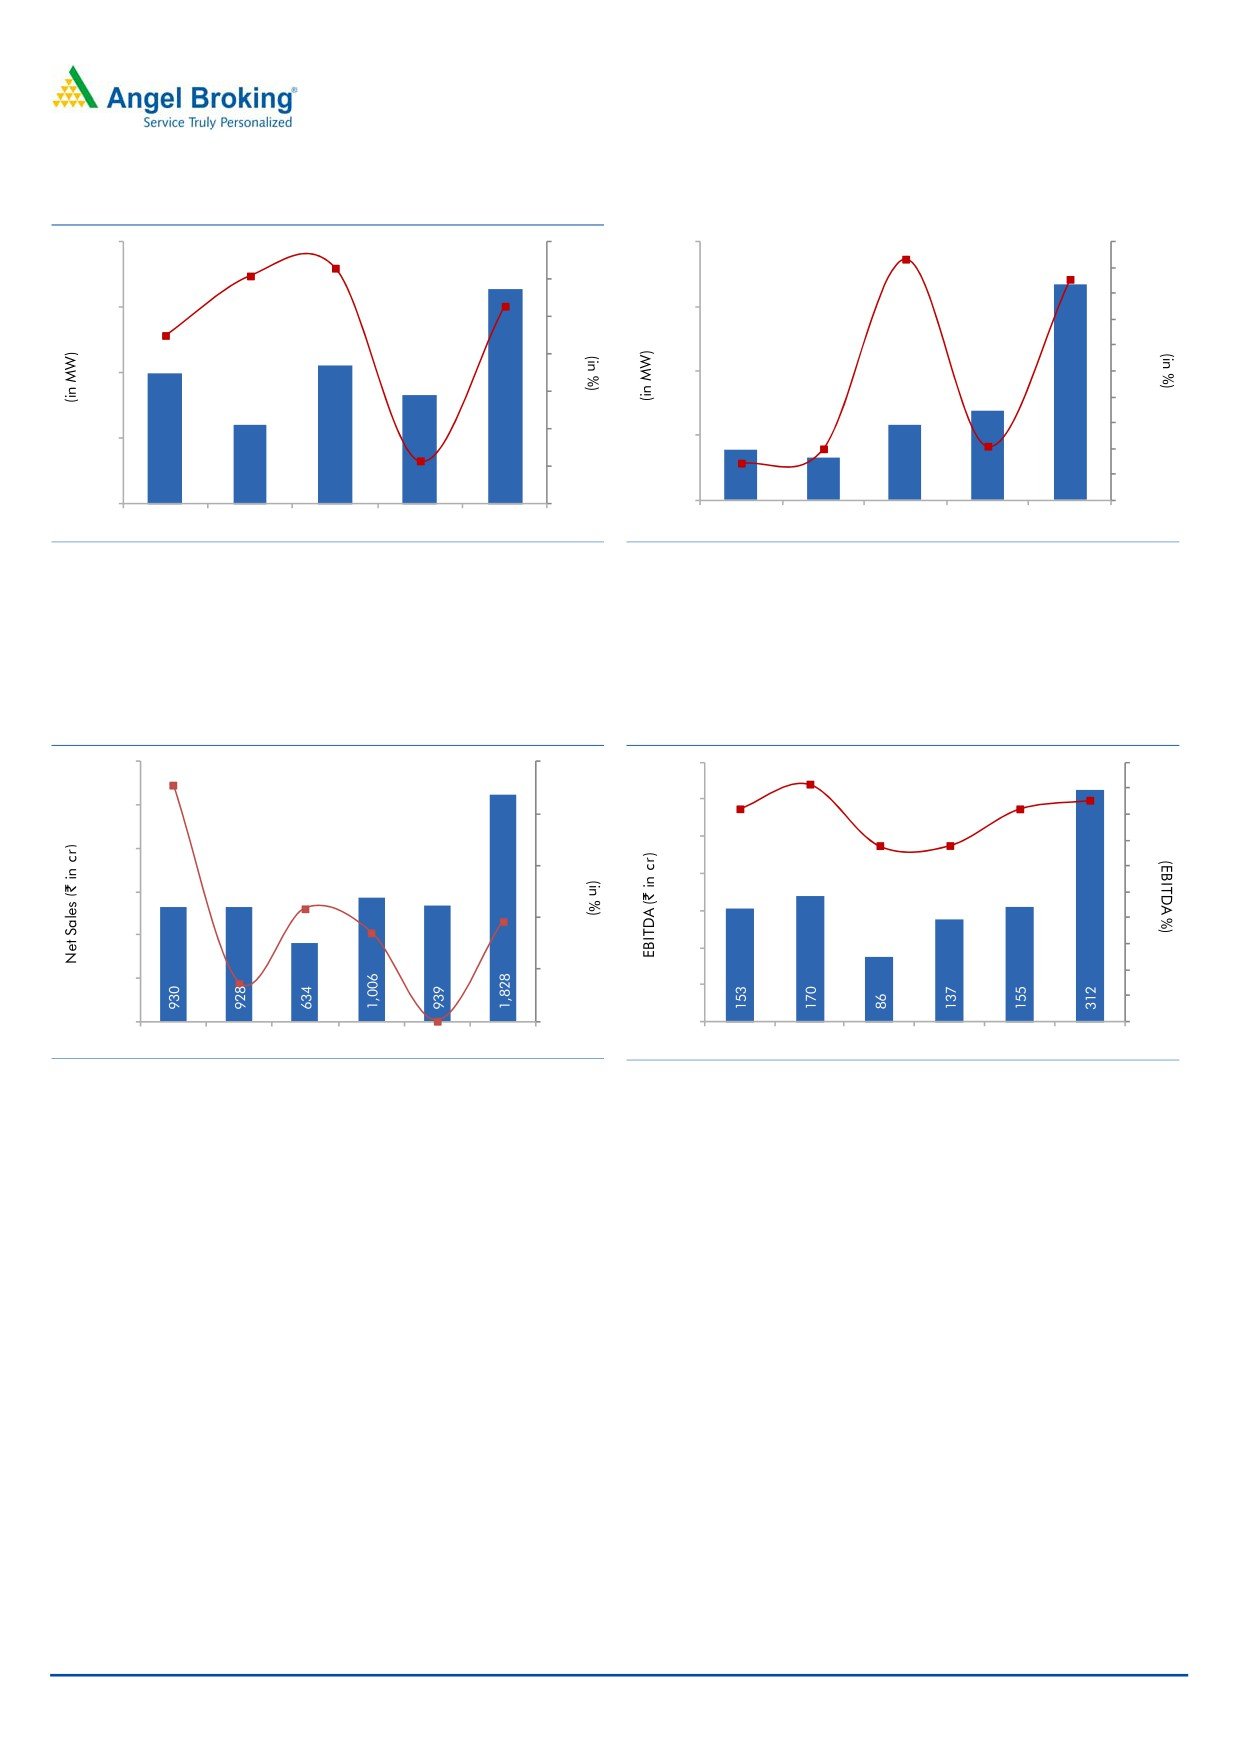
Exhibit 2: Sale Volumes (Turnkey+Equipment Supply)
Exhibit 3: Commissioning (Turnkey+Equipment Supply)
400
100
480
367
400
328
328
350
80
86
300
82
300
360
50
60
250
212
200
40
198
66
200
240
150
166
20
5
100
120
(28)
50
0
0
100
120
0
(20)
(50)
(17)
94
78
140
166
402
0
(40)
0
(100)
4QFY15
1QFY16
2QFY16
3QFY16
4QFY16
4QFY15
1QFY16
2QFY16
3QFY16
4QFY16
Source: Company, Angel Research
Source: Company, Angel Research
For the full year, IWL reported 63.0% yoy increase in revenues to `4,407cr,
reflecting 43% increase in sale volumes to 826MW. Notably, commissioning for
FY2016 witnessed sharp 195% yoy increase to 786MW.
Exhibit 4: Strong Revenue Growth
Exhibit 5: EBITDA Margins continue to expand
2,100
250
350
18
20
17
228
16
16
18
1,750
300
200
16
14
14
250
14
1,400
150
12
200
1,050
10
109
150
97
100
8
700
86
100
6
50
4
350
37
50
2
0
1
0
0
0
3QFY15
4QFY15
1QFY16
2QFY16
3QFY16
4QFY16
3QFY15
4QFY15
1QFY16
2QFY16
3QFY16
4QFY16
Source: Company, Angel Research
Source: Company, Angel Research
EBITDA numbers disappoint…
On the back of strong execution IWL reported 83.3% yoy increase in EBITDA to
`312cr. Reported EBITDA is below our expectations. Operating leverage helped
IWL report
17.1% EBITDA margins for the quarter. On adjusting for
(1)
capitalization of expenses and (2) goodwill on consolidation written-off, the Adj.
EBITDA margins of IWL were at 16.4%, which were flat on yoy basis.
For FY2016 EBITDA margins declined 121bps yoy to 15.6%, mainly owing to
124.6% increase in other expenses.
PAT also disappoints us…
IWL reported 17bps yoy decline in Adj. PAT (adjusted for exp. Capitalization and
goodwill write-off) margins to 10.8%, which is below our expectations. Adj. PAT of
the company grew 67.4% yoy to `197cr. High tax rate of 29.4% in 4QFY2016
restricted Adj. PAT growth.
In-line with EBITDA margin movement, Adj. PAT margins of the company declined
from 11.0% in FY2015 to 10.0% in FY2016.
May 11, 2016
3
Inox Wind | 4QFY2016 Result Update
Strong Order Book & ready pipeline of Project sites
Order book of IWL at 4QFY2016-end stands at 1,104MW (down 6.3% yoy),
having an execution of 12-15 months. Company Management has maintained
optimism about future order inflows, on the back of government’s strong focus on
Renewable sector, IWLs strong market positioning and strong capex pipeline of
Independent Power Producers (IPPs).
IWL has project sites in excess of 5,000MW, which have been acquired in various
stages. These sites are located across Rajasthan, Gujarat, Madhya Pradesh,
Andhra Pradesh and Maharashtra. Thus, it provides healthy revenue visibility for
IWL in the next few years.
Capex completed…
IWL has completed its capacity expansion exercise, resulting in increase in WTGs
capacity to 1,600MW. Blade plant integrated at their Madhya Pradesh facility has
commenced production. Also, IWL has built capabilities to manufacture 100m and
113m rotor diameter variants, now.
Actual capex for FY2016 stood at `160cr. IWL capitalized its Power Evacuation
Infrastructure facilities, resulting in over `350cr increase in Balance Sheet capex
(shown under the Goss Block).
Working Capital cycle further gets stretched…
IWL surprised the street by reporting further stretch in its working capital cycle (WC
as % of sales increased from 47.2% in FY2015 to 49.0% in FY2016). Key reason
for such expansion in Working capital cycle has been stretch in the AR days, which
increased from 144 days in FY2015 to 159 days in FY2016. Stretch in the AR days
is attributed to the back-ended sales (4QFY2016 revenues contributed 41.4% of
the yearly revenues). Management in the 4QFY2016 concall commented that the
risk of bad debts for IWL is minimal, as 90% of the receivables outstanding is less
than 6 months old.
Given that the company’s business is expected to grow its top-line by 19.3% CAGR
during FY2016-18E, we expect further stretch in working capital cycle from 142
days in FY2016 to 151 days in FY2018E.
May 11, 2016
4
Inox Wind | 4QFY2016 Result Update
Outlook and Valuation
We forecast IWL’s top-line to grow at CAGR of 19.3% (lowering our earlier
estimates considering the overhang on feed-in tariffs for wind) during FY2016-18,
on the back of recent capacity expansion, strong order book of 1,104MW (gives
revenue visibility for next 12-15 months), larger project sites.
Recently, IWL expanded its Turbine capacity to 113m (from the earlier 100m). As a
result, management expects 5% increase in the costs, but efficiency is expected to
increase by 20%. Further, realization of large rotor blades would increase.
Considering shift in business mix (where high capacity Turbines would contribute
more to the financials), we expect efficiency improvement. As a result, we expect
the Adj. EBITDA margins to improve from 15.4% in FY2016 to 16.4% in FY2018E.
Increase in depreciation expenses, and our conservative other income estimates,
restrict the Adj. PAT margin expansion during FY2016-18E to 10.6%.
Post the 17% correction in the IWL stock after 4QFY2016 results were announced,
the stock is now trading at FY2017E and FY2018E, P/E multiple of 9.8x and 8.1x,
respectively. Considering the 4QFY2016 Order Book, and expected strong order
inflow trends, IWL stock is trading at attractive valuations. On assigning, 9.5x P/E
multiple to our FY2018E, EPS estimate of `30.0, we arrive at price target of `286,
which gives 18% upside from the current levels. Given the upside, we maintain our
BUY rating on the stock.
Company Background
Inox Wind Ltd (IWL), incorporated in 2009 and a part of the Inox Group, is one of
the leading manufacturers of wind turbine generators in India. The company also
provides turnkey solutions, and operation and maintenance services for wind
power projects. Currently, IWL has an installed capacity of 950 Nacelles & Hubs at
Una, Himachal Pradesh and Barwani, Himachal Pradesh, 400 Rotor Blade sets,
and capacity of 600 towers at Rohika, Gujarat and Barwani, Himachal Pradesh.
May 11, 2016
5
Inox Wind | 4QFY2016 Result Update
Profit & Loss Statement (Consolidated)
Y/E March (` cr)
FY2013 FY2014 FY2015 FY2016 FY2017E FY2018E
Net Sales
1,059
1,567
2,710
4,406
5,605
6,267
% Chg
70.3
48.0
73.0
62.6
27.2
11.8
Total expenditure
862
1,391
2,252
3,736
4,725
5,239
Net Raw Materials
679
940
1,671
2,743
3,464
3,811
EPC and O&M exp.
94
273
364
535
706
771
Employee expenses
25
38
55
92
112
132
Other expenses
64
139
163
366
443
526
EBITDA
196
176
457
671
880
1,028
% Chg
38.5
(10.3)
159.5
49.2
28.9
16.8
EBIDTA %
18.6
11.3
16.9
15.2
15.7
16.4
Exp. Cap. &
0
0
0
12
0
0
Goodwill written-off
Depreciation
9
12
20
33
43
49
EBIT
188
165
437
649
837
978
% Chg
39.7
(12.2)
165.4
48.5
28.9
17.0
Interest Charges
39
46
62
96
110
87
Other Income
5
9
14
74
36
34
(% of Net Sales)
0.5
0.6
0.5
1.7
0.6
0.5
PBT
154
128
389
627
763
925
Tax
3
(4)
93
176
214
259
% of PBT
2.1
(3.5)
23.8
28.0
28.0
28.0
PAT
150
132
296
452
549
666
% Chg
50.6
(12.0)
124.1
52.4
21.6
21.3
PAT %
14.2
8.4
10.9
10.3
9.8
10.6
Diluted EPS
7.5
6.6
13.4
20.4
24.8
30.0
May 11, 2016
6
Inox Wind | 4QFY2016 Result Update
Balance Sheet (Consolidated)
Y/E March (` cr)
FY2013
FY2014
FY2015
FY2016
FY2017E
FY2018E
Sources of Funds
Equity Capital
40
200
222
222
222
222
Reserves Total
256
228
1,170
1,622
2,171
2,837
Networth
296
428
1,392
1,844
2,393
3,059
Total Debt
337
480
846
1,450
1,207
909
Other long term Liab.
2
2
5
7
7
7
Deferred Tax Liability
20
15
21
45
45
45
Total Liabilities
654
926
2,264
3,346
3,652
4,020
Application of Funds
Gross Block
177
204
253
624
724
824
Accumulated Dep.
21
32
52
85
129
129
Net Block
157
172
201
539
595
695
Capital WIP
4
25
49
55
65
25
Goodwill
0
2
2
17
17
17
Investments
0
45
0
62
12
12
Deferred Tax Assets
0
0
22
35
35
35
Current Assets
Inventories
79
271
424
542
845
944
Sundry Debtors
500
710
1,432
2,414
2,416
2,615
Cash and Bank Balance
2
4
710
479
490
487
Loans, Advances and
196
203
344
553
779
877
Deposits
Other Current Asset
12
48
34
68
78
81
Current Liabilities
296
554
954
1,419
1,681
1,770
Net Current Assets
494
681
1,989
2,637
2,927
3,235
Misc. Expenditure
0
0
0
0
0
0
Total Assets
654
926
2,264
3,346
3,652
4,020
May 11, 2016
7
Inox Wind | 4QFY2016 Result Update
Cash Flow Statement (Consolidated)
Y/E March (` cr)
FY2013 FY2014 FY2015 FY2016 FY2017E FY2018E
Profit before tax
154
128
389
627
763
925
Depreciation
9
12
20
33
43
49
Change in WC
(286)
(185)
(602)
(879)
(278)
(312)
Int. / Dividend (Net)
34
46
62
96
110
87
Direct taxes paid
(29)
(4)
93
176
214
259
Other income
(3)
9
14
74
36
34
Cash Flow from
(121)
(5)
(238)
(372)
388
457
Oper.
(Inc.)/ Dec. in Fixed
(351)
(48)
(73)
(377)
(110)
(60)
Assets
(Inc.)/ Dec. in Inv.
216
(45)
45
(62)
50
0
Other income
(3)
9
14
74
36
34
Cash Flow from Inv.
(135)
(84)
(14)
(365)
(24)
(26)
Issue of Equity
0
160
22
0
0
0
Inc./(Dec.) in loans
256
144
368
606
(243)
(298)
Dividend Paid (Incl.
0
0
0
0
0
0
Tax)
Others
(38)
(213)
567
(100)
(110)
(136)
Cash Flow from Fin.
219
91
957
506
(353)
(434)
Inc./(Dec.) in Cash
(38)
2
706
(230)
11
(3)
Opening Cash bal.
39
1
4
709
479
490
Closing Cash bal.
1
4
709
479
490
487
May 11, 2016
8
Inox Wind | 4QFY2016 Result Update
Key Ratios (Consolidated)
Y/E March
FY2014
FY2015E FY2016E FY2017E FY2018E
Valuation Ratio (x)
P/E (on FDEPS)
36.6
18.1
11.9
9.8
8.1
P/CEPS
33.6
16.9
11.1
9.1
7.5
P/BV
11.3
3.9
2.9
2.2
1.8
EV/Sales
3.4
2.0
1.4
1.1
0.9
EV/EBITDA
29.9
12.0
9.2
6.9
5.6
EV / Total Assets
5.7
2.4
1.9
1.7
1.4
Per Share Data (`)
EPS (fully diluted)
6.6
13.4
20.4
24.8
30.0
Cash EPS
7.2
14.3
21.9
26.7
32.3
Book Value
21.4
62.7
83.1
107.8
137.9
Returns (%)
RoCE (Pre-tax)
20.8
27.4
23.1
23.9
25.5
Angel RoIC (Pre-tax)
22.0
37.1
30.5
28.7
29.7
RoE
36.6
32.6
27.9
25.9
24.4
Turnover ratios (x)
Asset Turnover (Gross Block)
8.2
11.9
10.0
8.3
8.1
Inventory / Sales (days)
41
47
40
45
52
Receivables (days)
141
144
159
157
146
Payables (days)
112
122
116
120
120
WC cycle (ex-cash) (days)
136
132
142
150
151
Solvency ratios (x)
Net debt to equity
1.0
0.1
0.5
0.3
0.1
Net debt to EBITDA
2.4
0.3
1.3
0.8
0.4
Interest Coverage (EBIT / Int.)
3.6
7.0
6.8
7.6
11.2
May 11, 2016
9
Inox Wind | 4QFY2016 Result Update
Research Team Tel: 022 - 39357800
DISCLAIMER
Angel Broking Private Limited (hereinafter referred to as “Angel”) is a registered Member of National Stock Exchange of India Limited,
Bombay Stock Exchange Limited and MCX Stock Exchange Limited. It is also registered as a Depository Participant with CDSL and
Portfolio Manager with SEBI. It also has registration with AMFI as a Mutual Fund Distributor. Angel Broking Private Limited is a
registered entity with SEBI for Research Analyst in terms of SEBI (Research Analyst) Regulations, 2014 vide registration number
INH000000164. Angel or its associates has not been debarred/ suspended by SEBI or any other regulatory authority for accessing
/dealing in securities Market. Angel or its associates including its relatives/analyst do not hold any financial interest/beneficial
ownership of more than 1% in the company covered by Analyst. Angel or its associates/analyst has not received any compensation /
managed or co-managed public offering of securities of the company covered by Analyst during the past twelve months. Angel/analyst
has not served as an officer, director or employee of company covered by Analyst and has not been engaged in market making activity
of the company covered by Analyst.
This document is solely for the personal information of the recipient, and must not be singularly used as the basis of any investment
decision. Nothing in this document should be construed as investment or financial advice. Each recipient of this document should
make such investigations as they deem necessary to arrive at an independent evaluation of an investment in the securities of the
companies referred to in this document (including the merits and risks involved), and should consult their own advisors to determine
the merits and risks of such an investment.
Reports based on technical and derivative analysis center on studying charts of a stock's price movement, outstanding positions and
trading volume, as opposed to focusing on a company's fundamentals and, as such, may not match with a report on a company's
fundamentals.
The information in this document has been printed on the basis of publicly available information, internal data and other reliable
sources believed to be true, but we do not represent that it is accurate or complete and it should not be relied on as such, as this
document is for general guidance only. Angel Broking Pvt. Limited or any of its affiliates/ group companies shall not be in any way
responsible for any loss or damage that may arise to any person from any inadvertent error in the information contained in this report.
Angel Broking Pvt. Limited has not independently verified all the information contained within this document. Accordingly, we cannot
testify, nor make any representation or warranty, express or implied, to the accuracy, contents or data contained within this document.
While Angel Broking Pvt. Limited endeavors to update on a reasonable basis the information discussed in this material, there may be
regulatory, compliance, or other reasons that prevent us from doing so.
This document is being supplied to you solely for your information, and its contents, information or data may not be reproduced,
redistributed or passed on, directly or indirectly.
Neither Angel Broking Pvt. Limited, nor its directors, employees or affiliates shall be liable for any loss or damage that may arise from
or in connection with the use of this information.
Note: Please refer to the important ‘Stock Holding Disclosure' report on the Angel website (Research Section). Also, please refer to the
latest update on respective stocks for the disclosure status in respect of those stocks. Angel Broking Pvt. Limited and its affiliates may
have investment positions in the stocks recommended in this report.
Disclosure of Interest Statement
Inox Wind
1. Analyst ownership of the stock
No
2. Angel and its Group companies ownership of the stock
No
3. Angel and its Group companies' Directors ownership of the stock
No
4. Broking relationship with company covered
No
Note: We have not considered any Exposure below ` 1 lakh for Angel, its Group companies and Directors
Ratings (Based on expected returns
Buy (> 15%)
Accumulate (5% to 15%)
Neutral (-5 to 5%)
over 12 months investment period):
Reduce (-5% to -15%)
Sell (< -15)
May 11, 2016
10