2QFY2016 Result Update | Capital Goods
October 27, 2015
Inox Wind
BUY
CMP
`390
Performance Highlights
Target Price
`505
Quarterly Data (Consolidated)
Investment Period
12 months
( ` cr)
2QFY16
2QFY15
% chg (yoy) 1QFY16
% chg (qoq)
Revenues
1,008
543
85.6
636
58.6
Stock Info
EBITDA
137
87
57.6
86
58.6
Sector
Capital Goods
EBITDA margin (%)
13.6
16.0
(242bp)
13.6
-
Market Cap (` cr)
8,651
Reported PAT
89
55
63.5
51
76.5
Source: Company, Angel Research
Net debt (` cr)
135
Beta
1.2
Inox Wind (IWL) reported a strong set of numbers for 2QFY2016. Its top-line grew by
85.6% yoy to `1,008.2cr, led by 212MW of wind turbine generator (WTG) sales (increase
52 Week High / Low
495 / 315
of 86% yoy) during the quarter as against 114MW of WTGs supplied during 2QFY2015.
Avg. Daily Volume
1,463,396
The commissioning of the 140MW of WTG (increase of 367% yoy) during the quarter (as
Face Value (`)
10
against 30MW in 2QFY2015) also contributed to the revenue. The EBITDA during the
quarter came in at `137cr, an increase of 57.6% yoy; however, the same is lower than our
BSE Sensex
27,362
estimate of `152.4cr. Its EBITDA margin fell by 242bp yoy to 13.6% and the same is below our
Nifty
8,261
estimate of 15.3%. The decline in the EBIDTA margin was largely due to increase in the share of
Reuters Code
NA
commissioning revenue. The Net profit improved by 63.5% yoy to `89.1cr, during the quarter.
Bloomberg Code
INXW IN
Strong order book to boost performance: IWL received new orders worth 194MW during
the quarter, and as of September 2015 the order book stands at 1,202MW, down by 1.5%
against 1,220MW during June 2015. The strong order book provides revenue visibility over
Shareholding Pattern (%)
the next 12-15 months. The company also has project sites worth in excess of 5,000MW,
Promoters
85.6
which have been acquired or are under various stages of acquisition. Thus, IWL has a
healthy revenue visibility in the medium term.
MF / Banks / Indian Fls
4.8
EBIDTA rises by 57.6% yoy: IWL reported an EBIDTA of `137cr for the quarter as against `87cr during
FII / NRIs / OCBs
3.4
2QFY2015, thus registering a growth of 57.6% yoy. However, the EBIDTA margin for the quarter
Indian Public / Others
6.2
came in at 13.6% (our estimate was of 15.3%) as against 16% during 2QFY2015, a dip of 242bp
yoy. The margin decline was mainly due to rupee deprecation impacting raw material cost and
increase in the share of the relatively lower margin commissioning segment to the overall revenue.
Abs.(%)
3 Months
Going forward, margin is expected to improve on account of higher supply of 100 meter
blades as against 93 meters being currently supplied. Further it will introduce larger 113
Sensex
(2.7)
meter blades later during FY2016. We expect this higher blade segment to account for 50% of its
Inox Wind
(7.9)
business, going forward. The larger blades would get higher realizations and would improve the overall
margin further. We expect IWL’s margin to improve from 16.9% in FY2015 to 17.5% by FY2017.
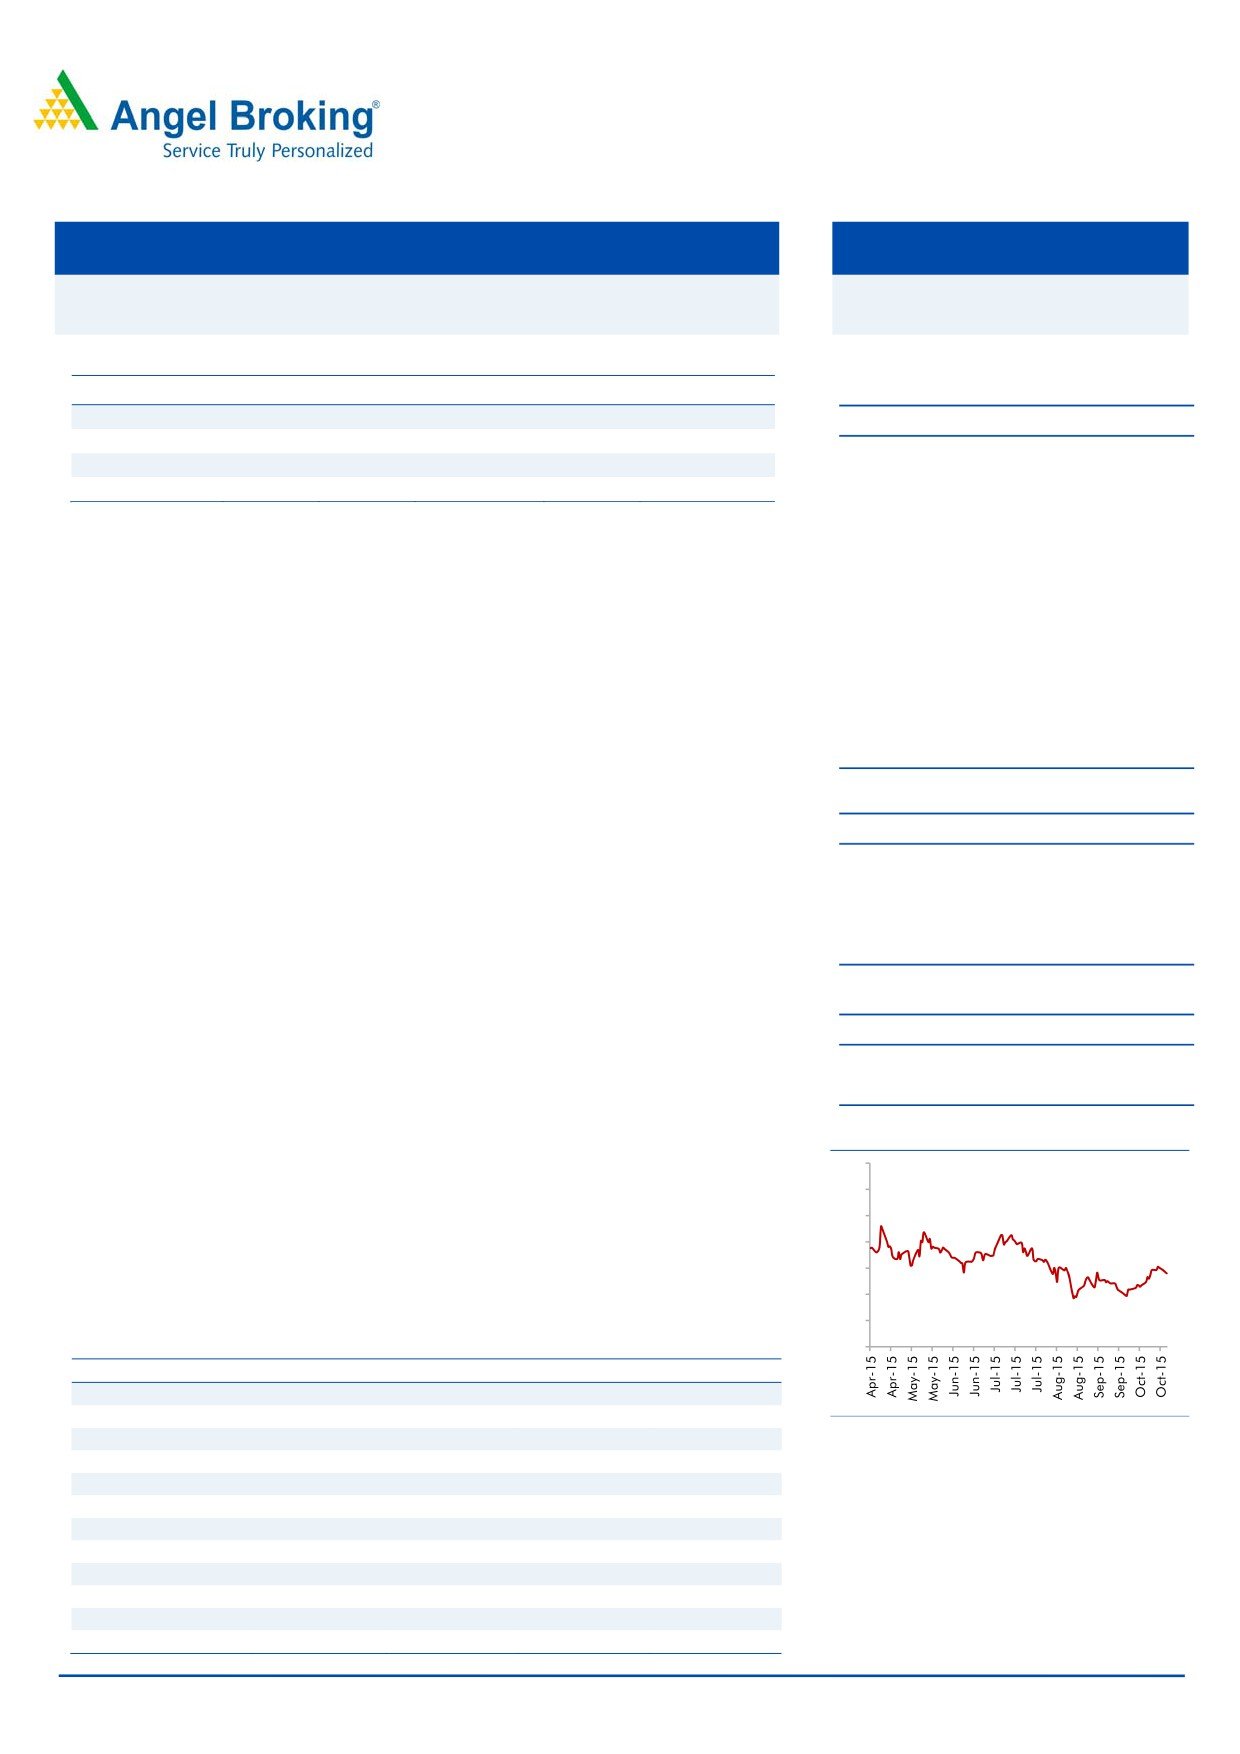
3 year price chart
600
Outlook and Valuation: We forecast IWL’s top-line to grow at a CAGR of 48.1% during
FY2015-17 on the back of aggressive capacity expansion, strong order book, and large
550
project sites. We expect EBITDA margin to improve to 17.5% by FY2017 on the basis of higher
500
realization from larger rotor blades and no royalty payment burden from FY2016 onwards.
450
The stock is currently trading at 12.4x its FY2017E EPS. Given the attractive valuation, we
400
maintain our Buy rating on the stock. We have assigned a multiple of 16x to its FY2017 EPS
350
of `31.6 to arrive at a target price of `505.
300
Key Financials (Consolidated)
250
Y/E March (` cr)
FY2014
FY2015
FY2016E
FY2017E
Operating income
1,567
2,710
4,980
5,943
% chg
48.0
73.0
83.8
19.3
Adj PAT
132
296
590
701
Source: Company, Angel Research
% chg
(12.0)
124.1
99.2
18.7
EBITDA (%)
11.3
16.9
17.0
17.5
EPS (`)
6.6
13.4
26.6
31.6
P/E (x)
59.0
29.2
14.7
12.4
P/BV (x)
18.2
6.2
4.4
3.2
RoE (%)
36.6
32.6
35.0
30.0
RoCE (%)
20.8
27.6
32.0
31.5
Shrenik C. Gujrathi
EV/Sales (x)
5.3
3.2
1.9
1.5
022 39357800 Ext: 6872
EV/EBITDA (x)
46.7
19.2
11.1
8.7
Source: Company, Angel Research; Note: CMP as of October 26, 2015
Please refer to important disclosures at the end of this report
1
Inox Wind | 2QFY2016 Result Update
Exhibit 1: Quarterly Performance
(` Cr)
2QFY2016
2QFY2015
% chg (yoy)
1QFY2016
% chg (qoq)
1HFY2016
1HFY2015
% chg (yoy)
Net Sales
1,006
541
86.0
634
58.7
1,640
844
94.3
Other operating income
2
2
2
4
3
Total income
1,008
543
85.6
636
58.6
1,644
848
94.0
Stock adjustments
3
(35)
(17)
(14)
(36)
Raw Material
680
373
82.2
408
66.5
1,088
585
85.9
(% of total income)
67.8
62.3
61.6
65.4
64.8
Employee Cost
20
13
55.3
19
6.3
39
25
58.2
(% of total income)
2.0
2.4
3.0
2.4
2.9
EPC cost
78
54
44.1
73
6.5
151
65
131.6
(% of total income)
7.7
10.0
11.5
9.2
7.7
Other Expenses
90
51
77.9
66
36.8
156
75
108.7
(% of total income)
8.9
9.3
10.3
9.5
8.8
Total Expenditure
871
456
91.0
549
58.6
1,421
714
99.1
EBITDA
137
87
57.6
86
58.6
223
134
66.7
(EBITDA %)
13.6
16.0
13.6
13.6
15.8
Interest
28
15
94.6
22
28.2
50
30
67.0
Depreciation
8
5
62.8
6
25.5
14
9
54.4
Other Income
21
6
237.9
11
91.7
31
8
307.8
PBT
121
74
64.8
69
76.7
190
102
85.9
PBT (%)
12.0
13.6
10.8
11.6
12.1
Total Tax
32
19
(68.7)
18
77.1
50
24
(107.9)
(% of PBT)
26.6
26.0
26.5
26.6
23.7
Reported PAT (After Min. Int.)
89
55
63.5
51
76.5
140
78
79.0
PAT Margins(%)
8.8
10.0
7.9
8.5
9.2
Extra ordinary exp/(inc)
0
0
0
0
0
Adj PAT
89
55
63.5
51
76.5
140
78
79.0
EPS (`)
4.0
2.7
47.3
2.3
76.5
6.3
3.9
61.4
Source: Company, Angel Research
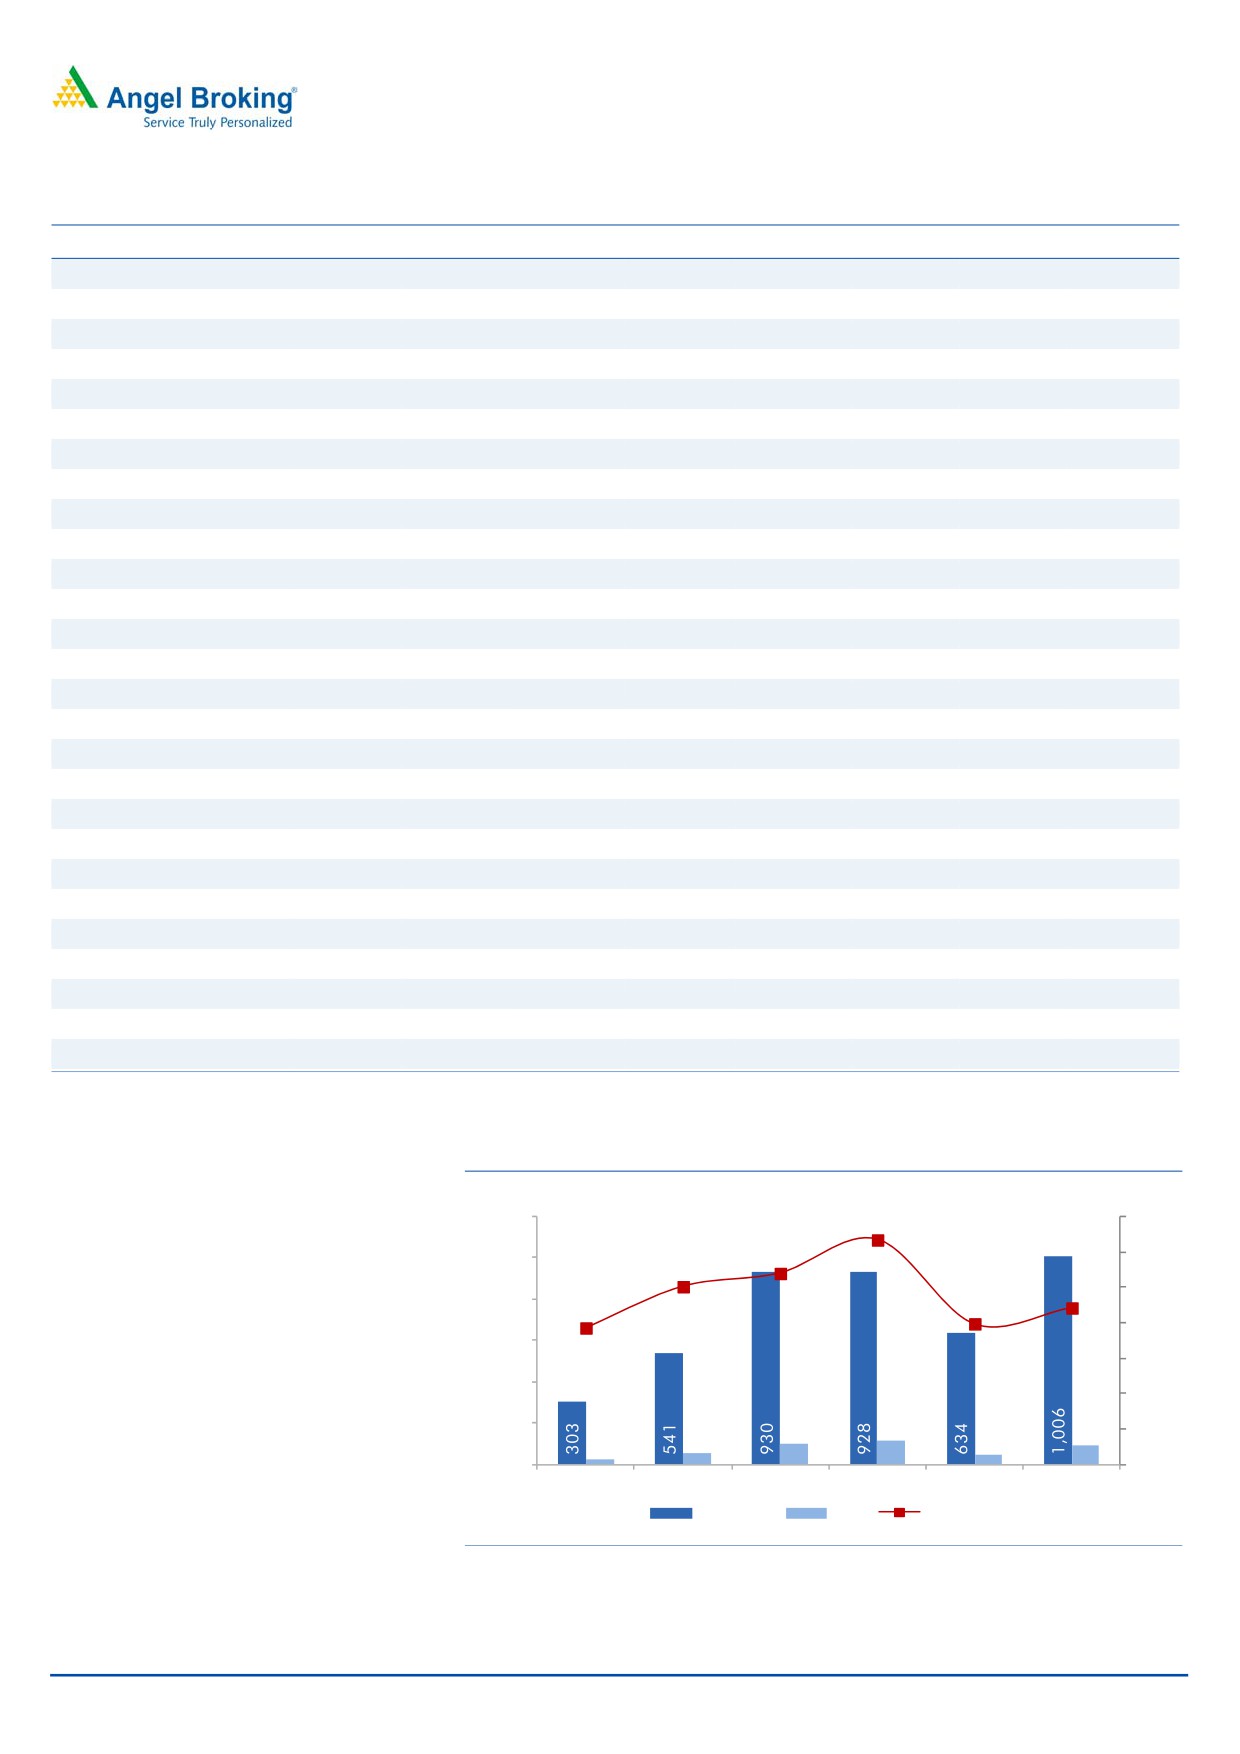
Exhibit 2: Financial Performance
(`cr)
(%)
1,200
14.0
12.7
1,000
10.8
12.0
10.0
10.0
800
7.7
7.9
8.8
8.0
600
6.0
400
4.0
200
101
118
89
2.0
55
51
23
0
0.0
1QFY15
2QFY15
3QFY15
4QFY15
1QFY16
2QFY16
Net Sales
PAT
PAT Margin
Source: Company, Angel Research
October 27, 2015
2
Inox Wind | 2QFY2016 Result Update
Strong order book and ready pipeline of project sites
IWL has delivered a strong volume growth of 84% during 1HFY2016, wherein it
has sold 332MW of WTGs as against 180MW sold during 1HFY2015. During
2QFY2016 the company sold 212MW of WTGs as against 114MW of WTGs sold
during 2QFY2015 (growth of 85.6% yoy). The order book as of June 2015 stands
at 1,202MW (down by 1.5% qoq) as against 1,220MW during June 2015, having
an execution period of 12-15 months. Out of this order book, 71% are turnkey
orders, while the remaining 29% orders are for supply of WTGs. The Management
is optimistic about the future order inflow, mainly driven by government focus on
renewable sector and larger capex from independent power producers (IPPs).
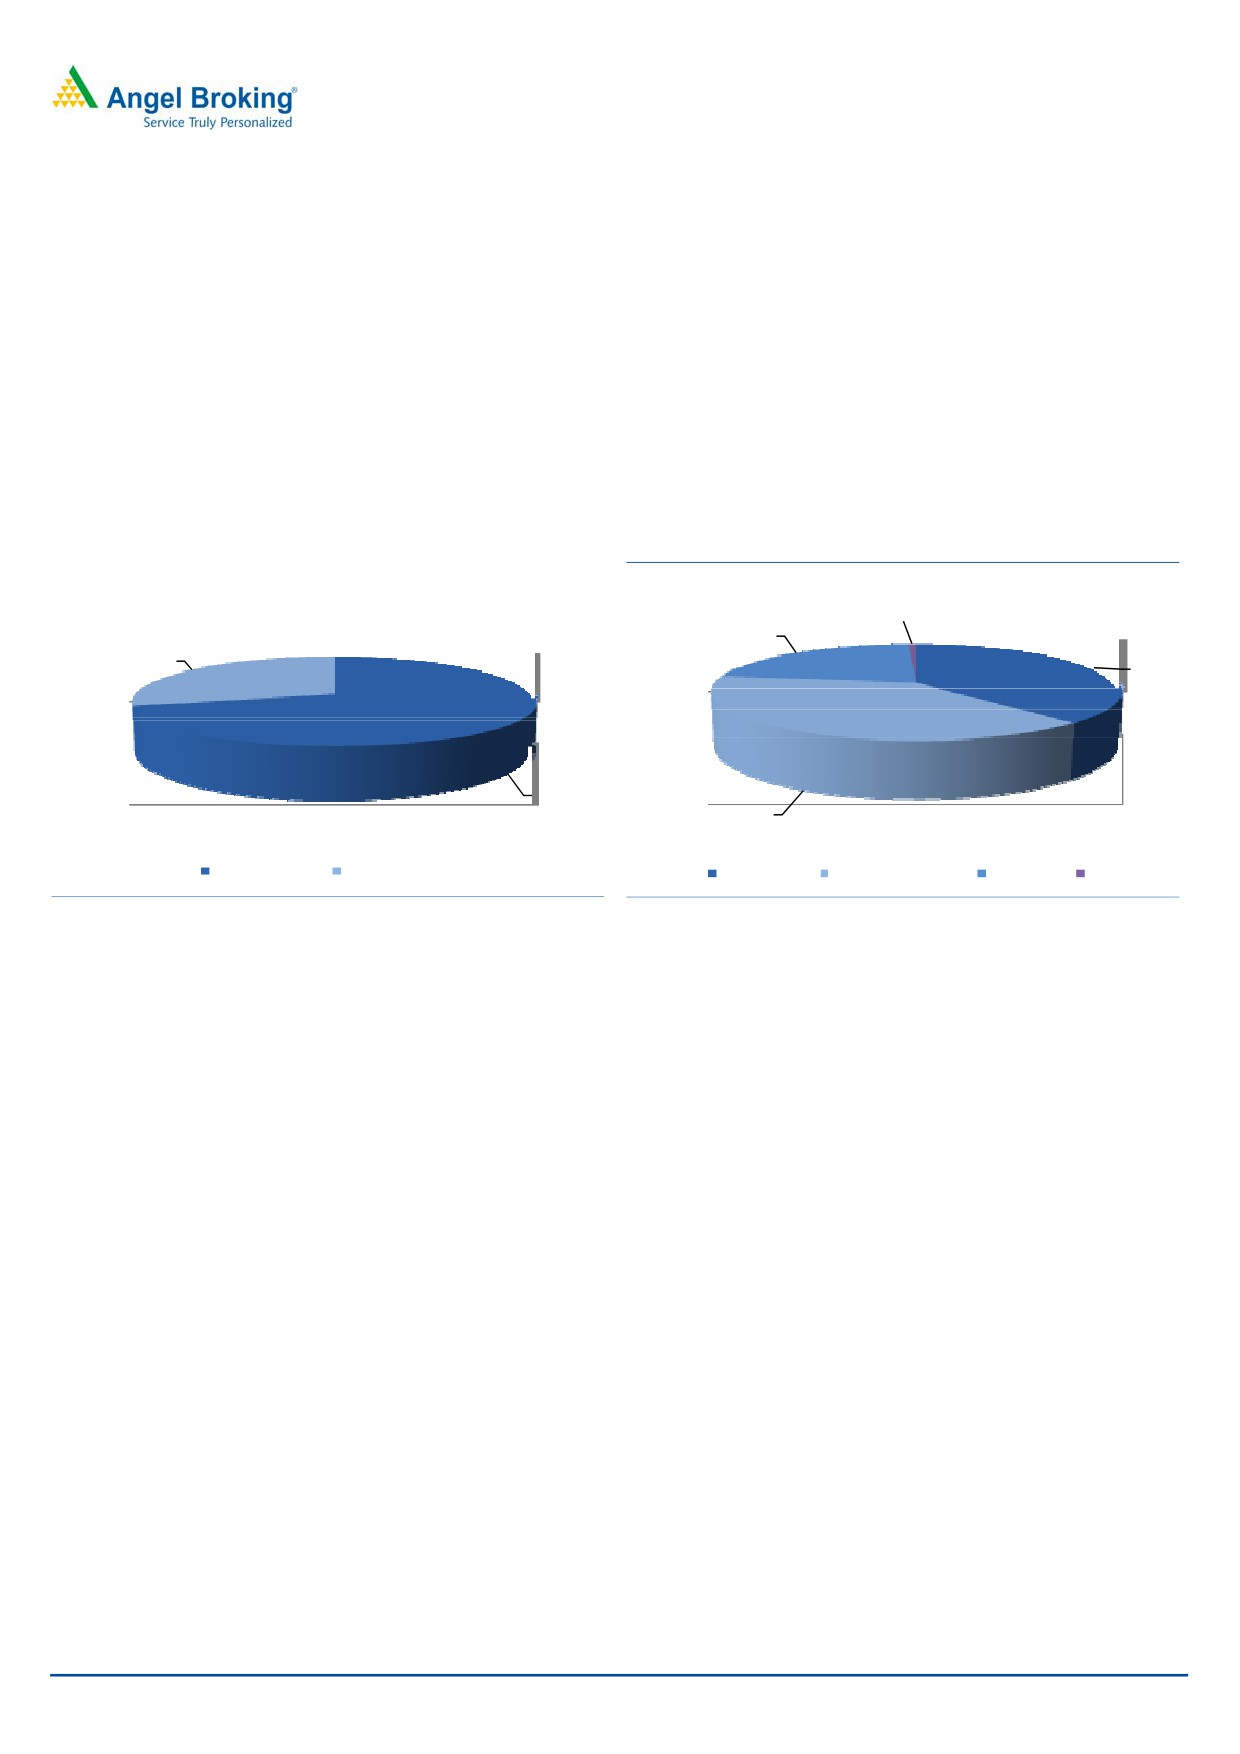
Exhibit 3: Turnkey vs Equipment supply Order Book breakup
Exhibit 4: Geography wise Order Book
1%
22%
29%
38%
71%
39%
Turnkey
Equipment supply
Rajasthan
Madhya Pradesh
Gujarat
AP
Source: Company, Angel Research
Source: Company, Angel Research
The company also has project sites worth in excess of 5,000MW, which have been
acquired or are under various stages of acquisition. These sites are located across
Rajasthan, Gujarat, Madhya Pradesh, Andhra Pradesh and Maharashtra. Thus, it
provides healthy revenue visibility for IWL over the next few years.
Improvement in working capital cycle
IWL improved its working capital (WC) cycle from 169 days in 1QFY2016 to 148
days in 2QFY2016. It was mainly due to reduced capacity mismatch, efficient
execution and increased project commissioning. The Management is confident of
further reducing the WC cycle and expects it to stabilize in the range of 120-
150days.
Margin expected to improve
On the EBITDA front, the company's consolidated margin for 2QFY2016 declined
by 242bp yoy to 13.6% and was below our estimate of 15.3%. It was led by rupee
depreciation (as 64% of raw material is imported) and increase in contribution of
the relatively low margin commissioning segment to the overall revenue. Going
forward, as IWL’s blade plant in Madhya Pradesh commences production of larger
diameter blades (of 100meters vs 93 meters earlier), we expect 50% of its business
to come from this segment. The larger blades would get higher realizations and
would improve the overall margin. We expect IWL’s margin to improve from
16.9% in FY2015 to 17.5% by FY2017.
October 27, 2015
3
Inox Wind | 2QFY2016 Result Update
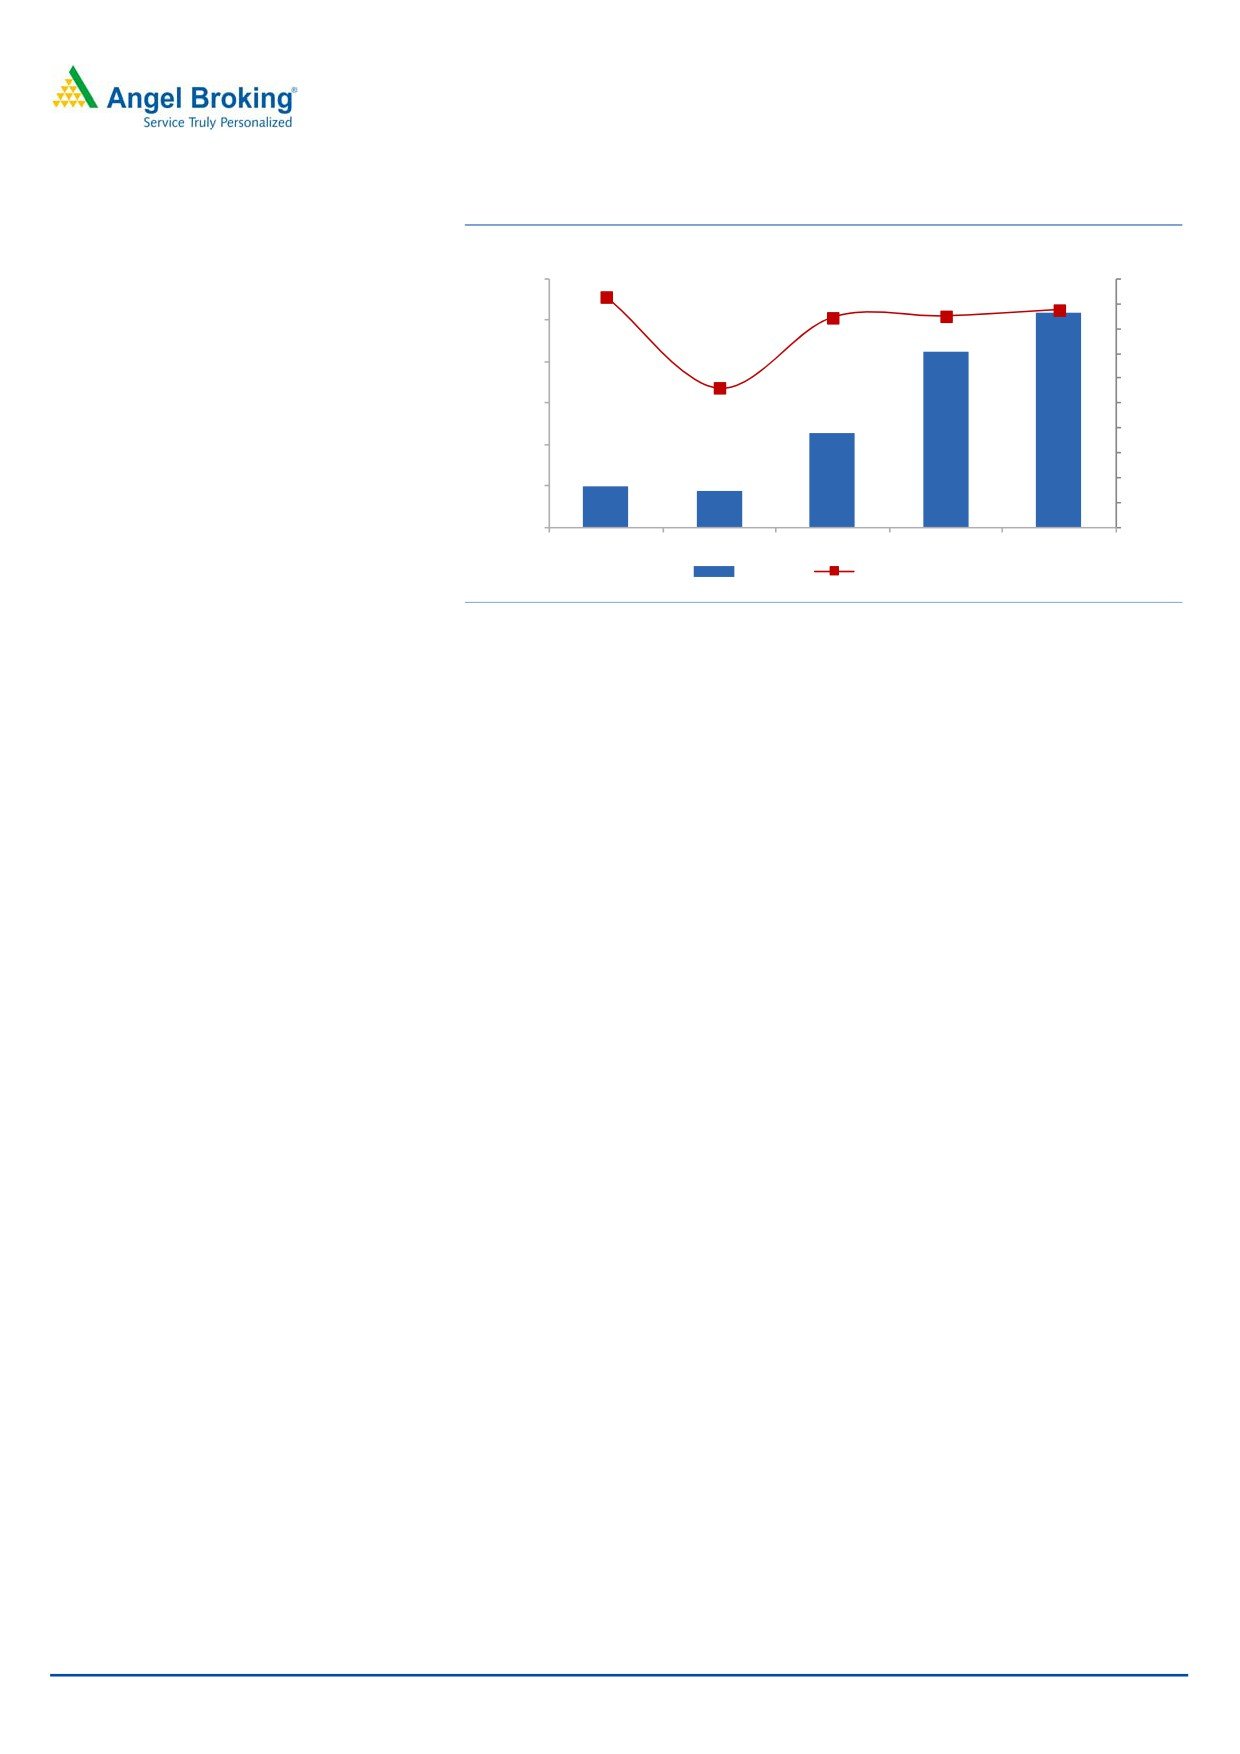
Exhibit 5: Expected margin improvement
(`cr)
(%)
1,200
20.0
18.6
1,040
17.0
18.0
1,000
17.5
16.9
16.0
847
14.0
800
12.0
600
11.3
10.0
457
8.0
400
6.0
196
176
4.0
200
2.0
0
0.0
FY2013
FY2014
FY2015
FY2016E
FY2017E
EBITDA
EBITDA margin
Source: Company, Angel Research
Outlook and Valuation: We forecast IWL’s top-line to grow at a CAGR of 48.1%
during FY2015-17, on the back of aggressive capacity expansion, strong order
book and larger project sites. We expect the EBITDA margin to improve to 17.5%
by FY2017 on the basis of higher realization of larger rotor blades (expect 50% of
revenue to come from this segment). Further, there would be no royalty payment
from FY2016. The stock is trading at 13.7x its FY2017E EPS. Given the attractive
valuation, we recommend a Buy rating on the stock. We have assigned a multiple
of 16x to its FY2017 EPS of `31.6 to arrive at a target price of `505.
October 27, 2015
4
Inox Wind | 2QFY2016 Result Update
Company Background
Inox Wind Ltd (IWL), incorporated in 2009 and a part of the Inox Group, is one of
the leading manufacturers of wind turbine generators in India. The company also
provides turnkey solutions, and operation and maintenance services for wind
power projects. Currently, IWL has an installed capacity of 550 nacelles and hubs
at Una, Himachal Pradesh, 400 rotor blade sets, and a capacity of 300 towers at
Rohika, Ahmedabad, Gujarat. The company is setting up a new integrated
capacity of 400 nacelles and hubs, 400 rotor blade sets, and 300 towers at
Barwani, Madhya Pradesh. This would take the total nacelles and hubs capacity to
950 units, rotor blades capacity to 800 sets, and tower capacity to 600 units.
October 27, 2015
5
Inox Wind | 2QFY2016 Result Update
Profit & Loss Statement (Consolidated)
Y/E March (` cr)
FY2013
FY2014
FY2015
FY2016E
FY2017E
Net Sales
1,059
1,567
2,710
4,980
5,943
% Chg
70.3
48.0
73.0
83.8
19.3
Total expenditure
862
1,391
2,252
4,133
4,903
Net Raw Materials
679
940
1,671
3,087
3,685
EPC and O&M expenses
94
273
364
672
802
Employee expenses
25
38
55
100
119
Other expenses
64
139
163
274
297
EBITDA
196
176
457
847
1,040
% Chg
38.5
(10.3)
159.5
85.1
22.9
EBIDTA %
18.6
11.3
16.9
17.0
17.5
Depreciation
9
12
20
36
40
EBIT
188
165
437
811
1,001
% Chg
39.7
(12.2)
165.4
85.5
23.4
Interest Charges
39
46
62
80
76
Other Income
5
9
14
57
10
(% of Net Sales)
0.5
0.6
0.5
1.1
0.2
PBT
154
128
389
787
934
Tax
3
(4)
93
197
234
% of PBT
2.1
(3.5)
23.8
25.0
25.0
PAT
150
132
296
590
701
% Chg
50.6
(12.0)
124.1
99.2
18.7
PAT %
14.2
8.4
10.9
11.9
11.8
Diluted EPS (`)
7.5
6.6
13.4
26.6
31.6
October 27, 2015
6
Inox Wind | 2QFY2016 Result Update
Balance Sheet (Consolidated)
Y/E March (` cr)
FY2013
FY2014
FY2015
FY2016E
FY2017E
Sources of Funds
Equity Capital
40
200
222
222
222
Reserves Total
256
228
1,170
1,760
2,461
Networth
296
428
1,392
1,982
2,683
Total Debt
337
480
845
845
845
Other long term Liabilities
2
2
2
2
2
Deferred Tax Liability
20
15
0
0
0
Total Liabilities
654
926
2,239
2,830
3,530
Application of Funds
Gross Block
177
204
277
477
527
Accumulated Depreciation
21
32
52
88
127
Net Block
157
172
225
389
400
Capital WIP
4
25
25
25
25
Goodwill
0
2
2
2
2
Investments
0
45
0
0
0
Deferred Tax Assets
0
0
1
1
1
Current Assets
Inventories
79
271
424
752
897
Sundry Debtors
500
710
1,432
2,427
2,652
Cash and Bank Balance
2
4
710
131
419
Loans, Advances and Deposits
196
203
344
631
754
Other Current Asset
12
48
34
62
74
Current Liabilities
296
554
957
1,591
1,693
Net Current Assets
494
681
1,986
2,412
3,102
Miscellaneous Expenditure
0
0
0
0
0
Total Assets
654
926
2,239
2,830
3,530
October 27, 2015
7
Inox Wind | 2QFY2016 Result Update
Cash Flow Statement (Consolidated)
Y/E March (` cr)
FY2013
FY2014
FY2015
FY2016E FY2017E
Profit before tax
154
128
389
787
934
Depreciation
9
12
20
36
40
Change in Working Capital
(286)
(185)
(599)
(1,004)
(403)
Interest / Dividend (Net)
34
46
62
80
76
Direct taxes paid
(29)
(4)
93
197
234
Other income
(3)
9
14
57
10
Cash Flow from Operations
(121)
(5)
(234)
(355)
404
(Inc.)/ Dec. in Fixed Assets
(351)
(48)
(73)
(200)
(50)
(Inc.)/ Dec. in Investments
216
(45)
45
0
0
Other income
(3)
9
14
57
10
Cash Flow from Investing
(135)
(84)
(14)
(143)
(40)
Issue of Equity
0
160
22
0
0
Inc./(Dec.) in loans
256
144
365
0
0
Dividend Paid (Incl. Tax)
0
0
0
0
0
Others
(38)
(213)
567
(80)
(76)
Cash Flow from Financing
219
91
953
(80)
(76)
Inc./(Dec.) in Cash
(38)
2
706
(578)
287
Opening Cash balances
39
1
4
709
131
Closing Cash balances
1
4
709
131
419
October 27, 2015
8
Inox Wind | 2QFY2016 Result Update
Key Ratios (Consolidated)
Y/E March
FY2013
FY2014
FY2015E FY2016E FY2017E
Valuation Ratio (x)
P/E (on FDEPS)
57.6
65.5
32.4
16.3
13.7
P/CEPS
54.4
60.2
30.3
15.3
13.0
P/BV
5.9
20.2
6.9
4.8
3.6
EV/Sales
8.5
5.8
3.6
2.1
1.7
EV/EBITDA
45.8
51.6
21.3
12.2
9.6
EV / Total Assets
13.8
9.8
4.4
3.6
2.8
Per Share Data (`)
EPS (fully diluted)
7.5
6.6
13.4
26.6
31.6
Cash EPS
8.0
7.2
14.3
28.2
33.4
Book Value
73.9
21.4
62.7
89.3
120.9
Returns (%)
RoCE (Pre-tax)
28.7
20.8
27.6
32.0
31.5
Angel RoIC (Pre-tax)
28.9
22.0
37.1
38.8
34.7
RoE
50.9
36.6
32.6
35.0
30.0
Turnover ratios (x)
Asset Turnover (Gross Block)
6.0
8.2
11.3
13.2
11.8
Inventory / Sales (days)
27
41
47
43
51
Receivables (days)
172
141
144
141
156
Payables (days)
125
112
122
113
122
WC cycle (ex-cash) (days)
170
136
132
130
152
Solvency ratios (x)
Net debt to equity
1.1
1.0
0.1
0.4
0.2
Net debt to EBITDA
1.7
2.4
0.3
0.8
0.4
Interest Coverage (EBIT / Int.)
4.8
3.6
7.0
10.1
13.2
October 27, 2015
9
Inox Wind | 2QFY2016 Result Update
Research Team Tel: 022 - 39357800
DISCLAIMER
Angel Broking Private Limited (hereinafter referred to as “Angel”) is a registered Member of National Stock Exchange of India Limited,
Bombay Stock Exchange Limited and Metropolitan Stock Exchange of India Limited. It is also registered as a Depository Participant with
CDSL and Portfolio Manager with SEBI. It also has registration with AMFI as a Mutual Fund Distributor. Angel Broking Private Limited is
a registered entity with SEBI for Research Analyst in terms of SEBI (Research Analyst) Regulations, 2014 vide registration number
INH000000164. Angel or its associates has not been debarred/ suspended by SEBI or any other regulatory authority for accessing
/dealing in securities Market. Angel or its associates including its relatives/analyst do not hold any financial interest/beneficial
ownership of more than 1% in the company covered by Analyst. Angel or its associates/analyst has not received any compensation /
managed or co-managed public offering of securities of the company covered by Analyst during the past twelve months. Angel/analyst
has not served as an officer, director or employee of company covered by Analyst and has not been engaged in market making activity
of the company covered by Analyst.
This document is solely for the personal information of the recipient, and must not be singularly used as the basis of any investment
decision. Nothing in this document should be construed as investment or financial advice. Each recipient of this document should
make such investigations as they deem necessary to arrive at an independent evaluation of an investment in the securities of the
companies referred to in this document (including the merits and risks involved), and should consult their own advisors to determine
the merits and risks of such an investment.
Reports based on technical and derivative analysis center on studying charts of a stock's price movement, outstanding positions and
trading volume, as opposed to focusing on a company's fundamentals and, as such, may not match with a report on a company's
fundamentals.
The information in this document has been printed on the basis of publicly available information, internal data and other reliable
sources believed to be true, but we do not represent that it is accurate or complete and it should not be relied on as such, as this
document is for general guidance only. Angel Broking Pvt. Limited or any of its affiliates/ group companies shall not be in any way
responsible for any loss or damage that may arise to any person from any inadvertent error in the information contained in this report.
Angel Broking Pvt. Limited has not independently verified all the information contained within this document. Accordingly, we cannot
testify, nor make any representation or warranty, express or implied, to the accuracy, contents or data contained within this document.
While Angel Broking Pvt. Limited endeavors to update on a reasonable basis the information discussed in this material, there may be
regulatory, compliance, or other reasons that prevent us from doing so.
This document is being supplied to you solely for your information, and its contents, information or data may not be reproduced,
redistributed or passed on, directly or indirectly.
Neither Angel Broking Pvt. Limited, nor its directors, employees or affiliates shall be liable for any loss or damage that may arise from
or in connection with the use of this information.
Note: Please refer to the important ‘Stock Holding Disclosure' report on the Angel website (Research Section). Also, please refer to the
latest update on respective stocks for the disclosure status in respect of those stocks. Angel Broking Pvt. Limited and its affiliates may
have investment positions in the stocks recommended in this report.
Disclosure of Interest Statement
Inox Wind
1. Analyst ownership of the stock
No
2. Angel and its Group companies ownership of the stock
No
3. Angel and its Group companies' Directors ownership of the stock
No
4. Broking relationship with company covered
No
Note: We have not considered any Exposure below ` 1 lakh for Angel, its Group companies and Directors
Ratings (Based on expected returns
Buy (> 15%)
Accumulate (5% to 15%)
Neutral (-5 to 5%)
over 12 months investment period):
Reduce (-5% to -15%)
Sell (< -15)
October 27, 2015
10