3QFY2016 Result Update | IT
January 20, 2016
Infosys
BUY
CMP
`1,139
Performance highlights
Target Price
`1,347
(` cr)
3QFY16
2QFY16
% chg (qoq)
3QFY15
% chg (yoy)
Investment Period
12 Months
Net revenue
15,902
15,635
1.7
13,796
15.3
EBITDA
4,328
4,352
(0.5)
3,980
8.7
EBITDA margin (%)
27.2
27.8
(62)bp
28.8
(163)bp
Stock Info
PAT
3,465
3,398
2.0
3,250
6.6
Sector
IT
Source: Company, Angel Research
Market Cap (` cr)
261,645
For 3QFY2016, Infosys posted a 0.6% sequential growth in USD revenues to
Net Debt (` cr)
(30,250)
US$2,407mn (V/s an expected US$2,368mn). In constant currency (CC) terms,
Beta
0.7
the company posted a 1.1% qoq growth. Volume growth during the quarter was
52 Week High / Low
1,219/933
of 3.1% qoq. On the operating front, the EBITDA margin came in at 27.2% (V/s
Avg. Daily Volume
178,359
an expected 27.0%) dipping by 62bp qoq. This was owing to pricing decline by
2.5% qoq and lower utilization. Consequently, the PAT came in at `3,465cr (V/s
Face Value (`)
5
an expected `3,251cr), a growth of 2.0% qoq. Overall, the Management is
BSE Sensex
24,480
upbeat about the company’s future prospects, given the strong order book
Nifty
7,435
position which is guided towards US$3bn. Also, the Management has guided
Reuters Code
INFY.BO
towards a higher revenue growth for FY2016, ie of 12.8-13.2% in CC terms and
Bloomberg Code
INFY@IN
16.2-16.6% in INR terms, on an exchange rate of `66.16/US$ (as on December
31, 2015). The earlier guidance was of 10-12% revenue growth in CC terms for
FY2016. We maintain our Buy rating on the stock with a target price of `1,347.
Shareholding Pattern (%)
Quarterly highlights: For 3QFY2016, Infosys posted a 0.6% sequential growth in
Promoters
13.1
USD revenues to US$2,407mn (V/s an expected US$2,368mn). In constant
MF / Banks / Indian Fls
18.0
currency (CC) terms, the company posted a 1.1% qoq growth. Volume growth
FII / NRIs / OCBs
58.2
during the quarter was of 3.1% qoq. On the operating front, the EBITDA margin
Indian Public / Others
10.7
came in at 27.2% (V/s an expected 27.0%) dipping by 62bp qoq. This was owing
to pricing decline by 2.5% qoq and lower utilization. Consequently, the PAT came
in at `3,465cr (V/s an expected `3,251cr), a growth of 2.0% qoq
Abs.(%)
3m 1yr
3yr
In terms of client additions, the company added 4 clients in the US$25mn+
Sensex
(10.5)
(13.4)
22.2
bracket and one in the US$50mn+ bracket. Overall, 1045 clients were active
Infosys
2.4
8.4
63.3
during the quarter. The Management is upbeat about the future prospects of the
company given the strong order book position, which is guided towards US$3bn.
3-year price chart
Outlook and valuation: The company has revised its future CC revenue growth
1,400
guidance for FY2016 to 12.8-13.2%. By FY2017, the company expects to lead
1,200
industry growth and reach a milestone of achieving sales of US$20bn by
1,000
FY2020. We maintain our Buy rating on the stock.
800
Key financials (Consolidated, IFRS)
600
Y/E March (` cr)
FY2014
FY2015
FY2016E
FY2017E
400
Net sales
50,133
53,319
61,850
69,891
200
% chg
24.2
6.4
16.0
13.0
0
2
3
3
3
3
4
4
4
4
5
5
5
5
6
Adj. net profit
10,867
12,330
13,631
15,087
1
1
1
1
1
1
1
ŧ
1
1r
-
ŧ
1
r
1
-
ŧ
1
1r
-
ŧ
1
c
n
u
c
n
u
c
n
u
c
n
a
p
J
a
p
J
a
p
J
a
% chg
15.4
13.5
10.6
10.7
O
J
A
O
J
A
O
J
A
O
J
EBITDA margin (%)
27.2
27.9
27.5
27.5
Source: Company, Angel Research
EPS (`)
47.3
53.7
59.4
65.7
P/E (x)
24.1
21.2
19.2
17.3
P/BV (x)
5.5
4.8
4.1
3.5
RoE (%)
22.9
22.5
21.2
20.1
RoCE (%)
21.5
20.8
20.7
20.5
Sarabjit kour Nangra
EV/Sales (x)
4.6
4.3
3.5
3.0
+91 22-39357800 Ext: 6806
EV/EBITDA (x)
16.9
15.3
12.8
10.8
Source: Company, Angel Research; Note: CMP as of January 19, 2016
Please refer to important disclosures at the end of this report
1
Infosys | 3QFY2016 Result Update
Exhibit 1: 3QFY2016 performance (IFRS, consolidated)
(` cr)
3QFY16
2QFY16
% chg (qoq)
3QFY15
% chg (yoy)
9MFY2016
9MFY2015
% chg (yoy)
Net revenue
15,902
15,635
1.7
13,796
15.3
45,891
39,908
15.0
Cost of revenue
9,621
9,365
2.7
8,171
17.7
27,797
23,924
16.2
Gross profit
6,281
6,270
0.2
5,625
11.7
18,094
15,984
13.2
SG&A expenses
1,953
1,918
1.8
1,645
18.7
5,654
4,816
17.4
EBITDA
4,328
4,352
(0.5)
3,980
8.7
12,440
11,168
11.4
Depreciation
369
359
2.9
291
26.8
1,040
785
32.5
EBIT
3,959
3,993
(0.9)
3,689
7.3
11,400
10,383
9.8
Other income
802
793
1.1
840
(4.5)
2,353
2,546
PBT
4,761
4,786
(0.5)
4,529
5.1
13,751
12,929
6.4
Income tax
1,296
1,387
(6.6)
1,279
1.3
3,857
3,697
4.3
Exceptional item
-
-
-
-
-
Reported PAT
3,465
3,399
1.9
3,250
6.6
9,894
9,232
7.2
Adjusted PAT
3,465
3,398
2.0
3,250
6.6
9,894
9,232
7.2
EPS
15.2
14.9
2.0
14.2
6.6
43.3
40.4
7.2
Gross margin (%)
39.5
40.1
(60)bp
40.8
(127)bp
39.4
40.1
(62)bp
EBITDA margin (%)
27.2
27.8
(62)bp
28.8
(163)bp
27.1
28.0
(88)bp
EBIT margin (%)
24.9
25.5
(64)bp
26.7
(184)bp
24.8
26.0
(118)bp
PAT margin (%)
21.8
21.7
5bp
23.6
(177)bp
21.6
23.1
(157)bp
Source: Company, Angel Research
Exhibit 2: 3QFY2016 - Actual vs Angel estimates
(` cr)
Actual
Estimate
% Var.
Net revenue
15,902
15,610
1.9
EBITDA margin (%)
27.2
27.0
22
PAT
3,465
3,251
6.6
Source: Company, Angel Research
Revenues ahead of expectation
For 3QFY2016, Infosys posted a 0.6% sequential growth in USD
revenues to
US$2,407mn (V/s an expected US$2,368mn). In constant currency (CC) terms, the
company posted a 1.1% qoq growth. In rupee terms, revenue came in at
`15,902cr (V/s an expected `15,610cr), a growth of 1.7% qoq. Volume growth
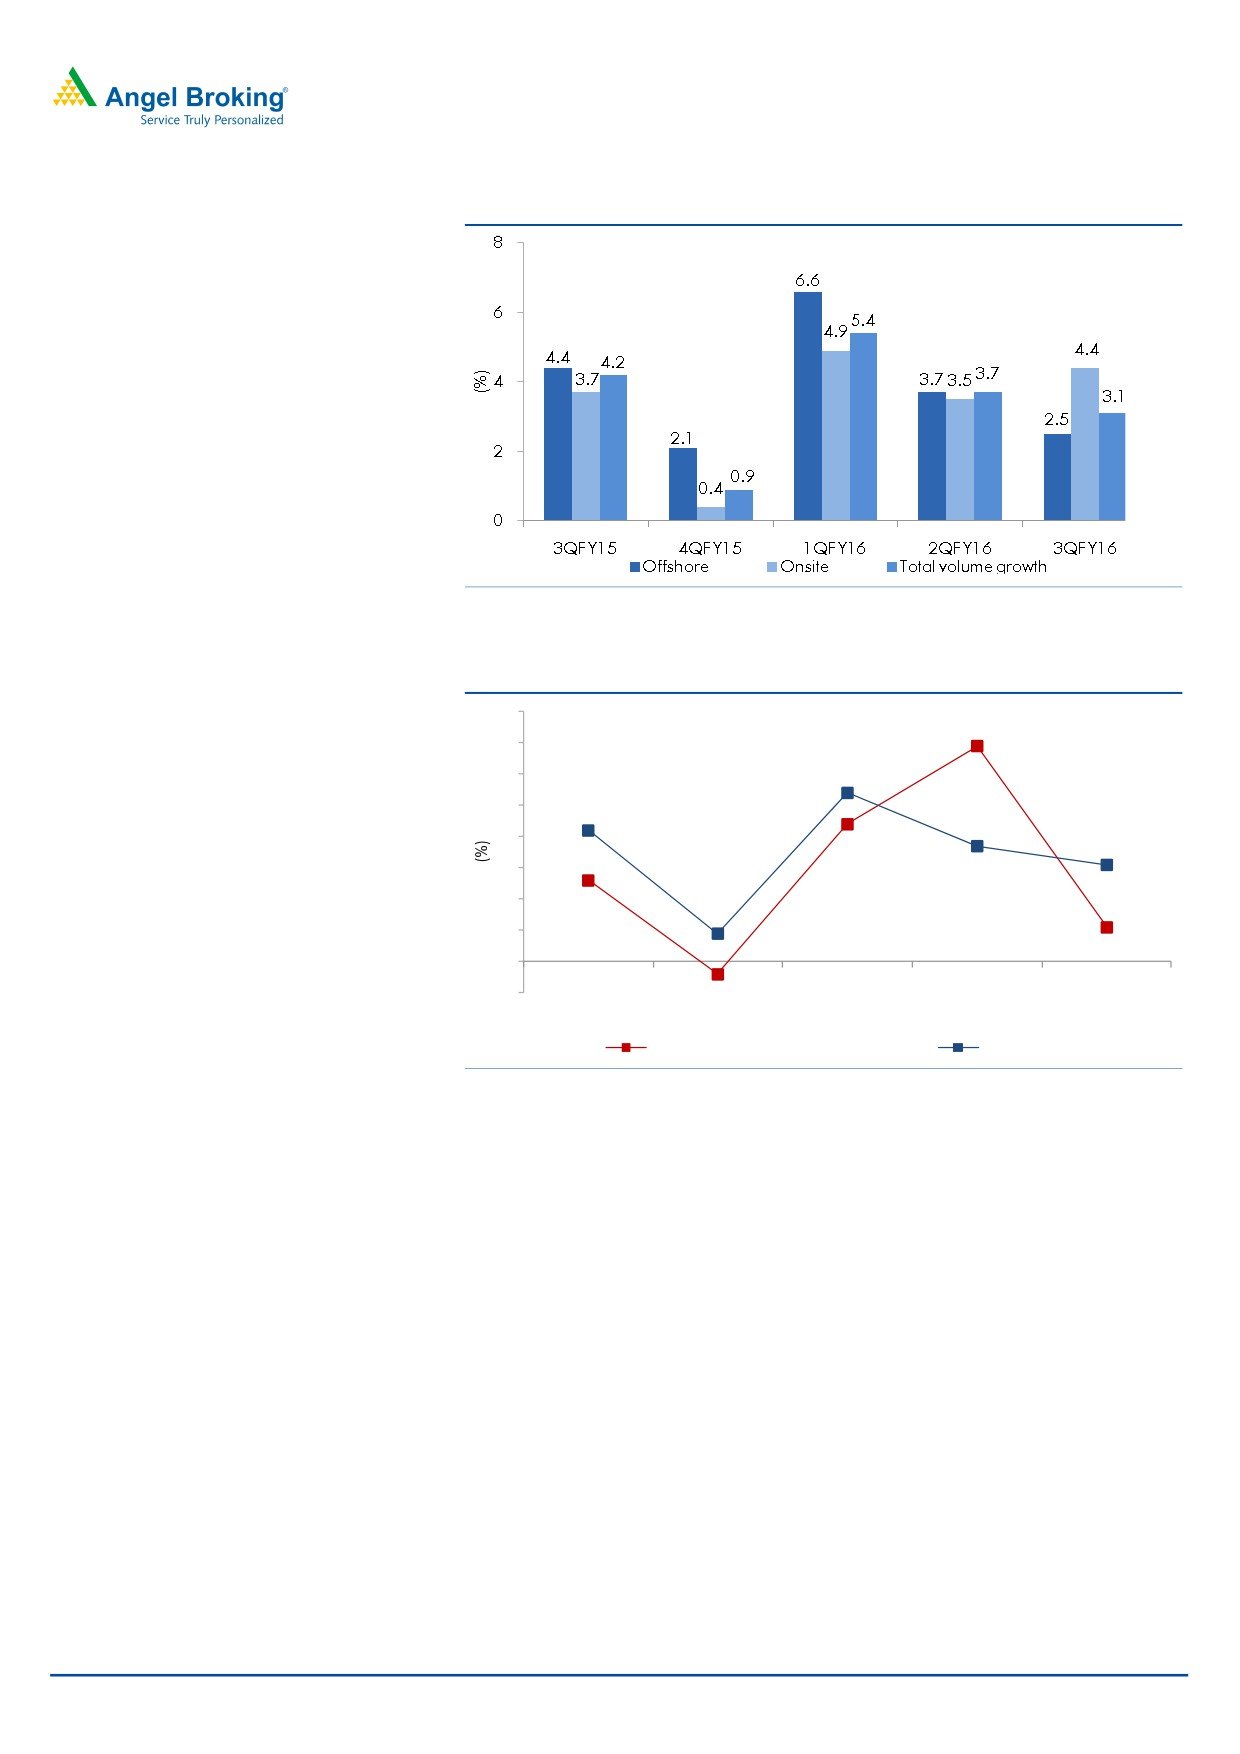
during the quarter was of 3.1% qoq. Growth was driven more by onsite volume
which grew by 4.4% qoq, while the offshore volume growth was of 2.5% qoq.
In terms of geographies, USA grew by 0.5% qoq CC, Europe grew by 3.9% qoq
CC, India grew by 24.3% qoq CC and ROW grew by 0.3% qoq CC. In terms of
domains, FSI (Banking & Financial Services) grew by 3.1% qoq CC, Manufacturing
grew by 3.2% qoq CC, RCL (Retail and Life Sciences) grew by 0.1% qoq CC and
ECS (Energy, Utilities, Communication and Services) grew by 4.6% qoq CC.
January 20, 2016
2
Infosys | 3QFY2016 Result Update
Exhibit 3: Trend in volume growth qoq (Effort wise)
Source: Company, Angel Research
Exhibit 4: Trend in volume and USD revenue growth (qoq)
8
7
4.4
6.9
6
5
3.7
4
5.4
3.1
4.2
3
2
2.6
1
1.1
0.90.4)
0
(1)
3QFY15
4QFY15
1QFY16
2QFY16
3QFY16
Revenue growth (constant currency)
Volume growth
Source: Company, Angel Research
Industry-wise, the revenue from Financial Services and Insurance, the company’s
anchor vertical which contributed by 33.5% to revenues, grew by 2.7% qoq; in CC
terms, revenue from FSI grew by 3.1% qoq. The Manufacturing industry vertical,
which contributed by 22.8% to revenues, de-grew by 3.7% qoq. In CC terms, the
revenue from this vertical grew by 3.2% sequentially.
The Retail, CPG and Logistics segment (RCL; contributed by 24.3% to revenues)
reported a 0.5% qoq growth. In CC terms, the revenue from RCL grew by 0.1%
qoq. The Energy Utilities and Communications & Services segment (contributed by
13.1% to revenue) reported a growth of 4.2% qoq in revenue, with Energy and
Utilities posting the biggest fall among verticals of 4.6% qoq.
January 20, 2016
3
Infosys | 3QFY2016 Result Update
Exhibit 5: Growth trend in industry segments (Reported basis)
Particulars
% to revenue
% growth qoq
% growth yoy
FSI
33.5
2.8
9.8
Banking and financial services
27.6
2.1
11.8
Insurance
5.9
6.0
1.6
Manufacturing
22.8
(3.6)
5.7
RCL
24.3
(0.6)
12.2
Retail and CPG
14.7
(0.7)
7.1
Transport and logistics
1.9
0.6
37.5
Life Sciences
5.8
(1.1)
23.4
Healthcare
1.9
0.6
3.1
ECS
19.4
3.8
5.3
Energy and utilities
5.1
9.2
13.0
Communication and services
8.0
1.9
(0.2)
Others
6.3
2.3
6.8
Source: Company, Angel Research
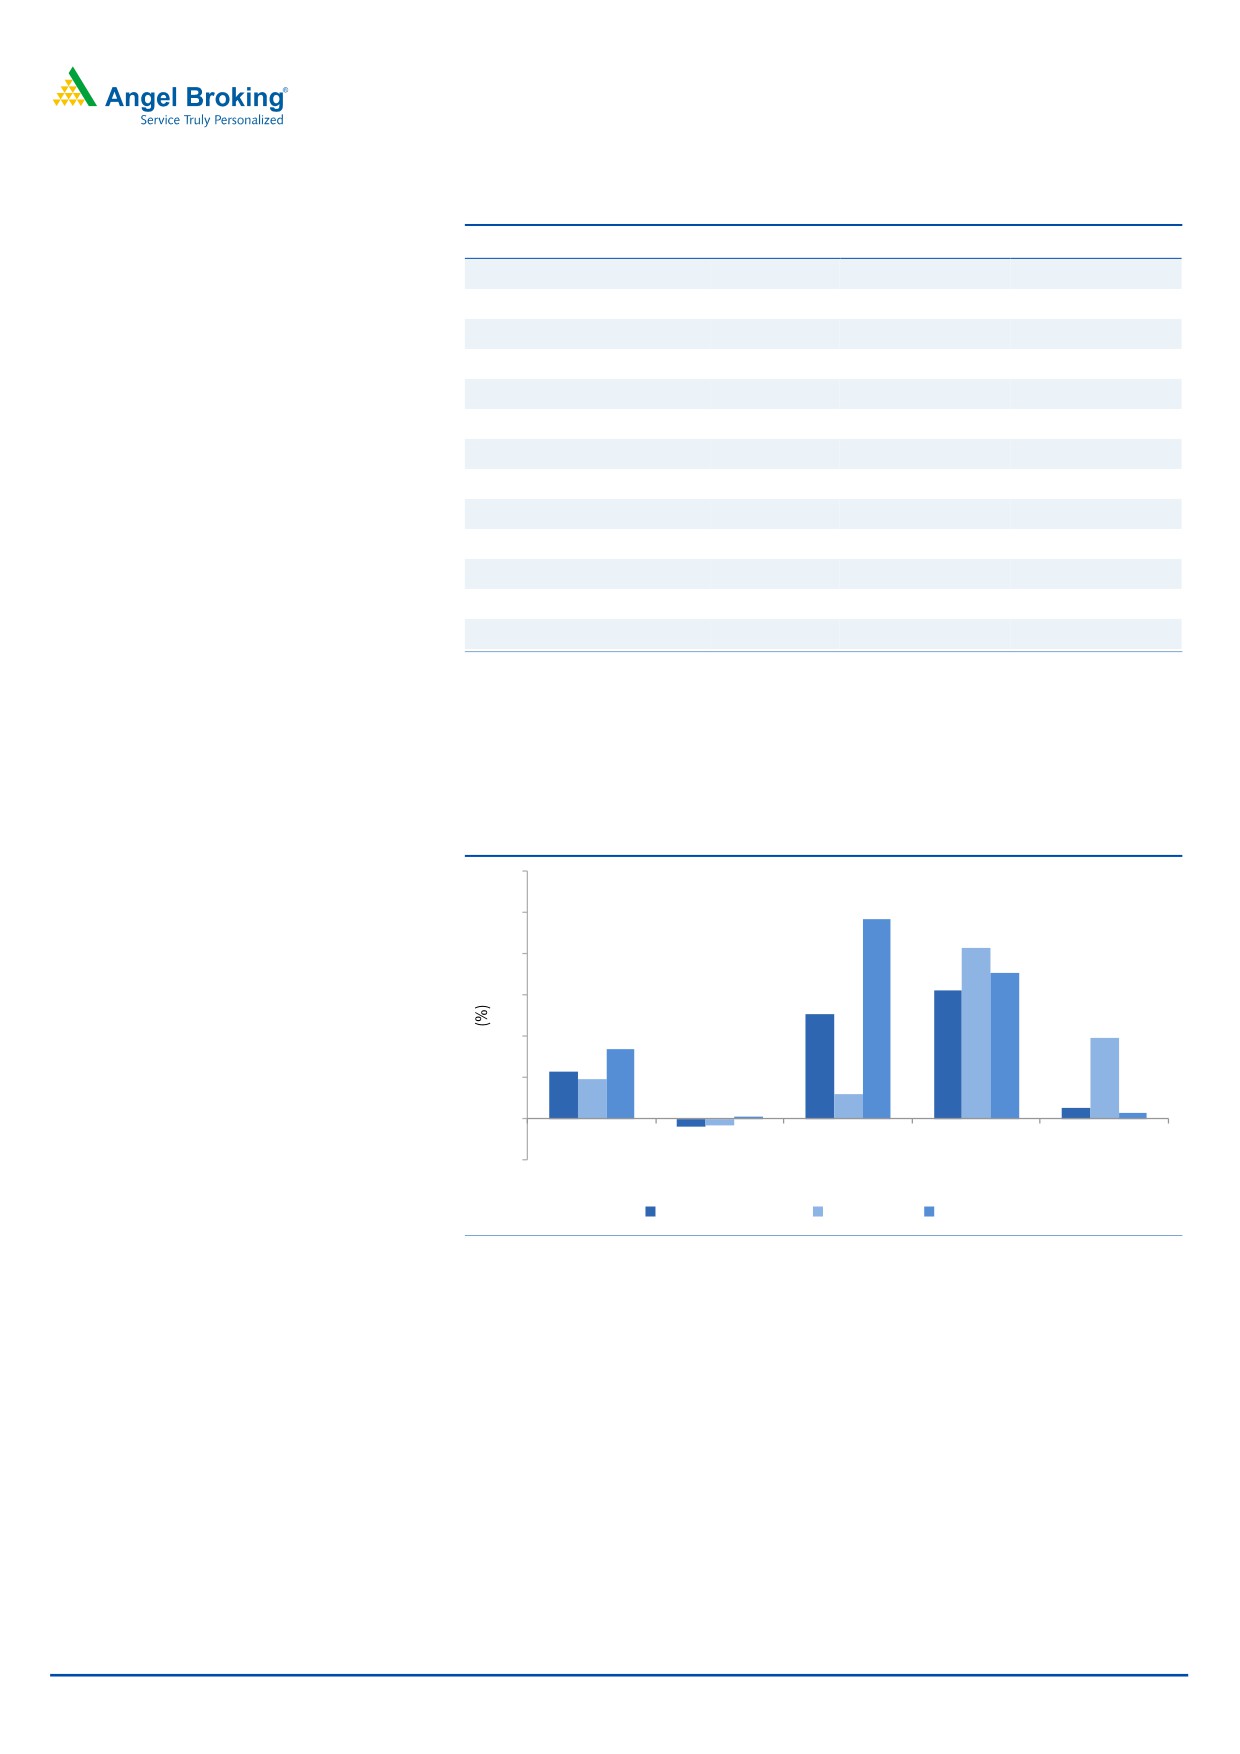
In terms of geographies, revenues from North America grew by 0.5% qoq in CC
terms, while other geographies such as Europe grew by 3.9% qoq and RoW grew
by 0.3% qoq (both in CC terms). India posted a 24.3% qoq growth in CC terms.
Exhibit 6: USD growth trend in geographies qoq (CC basis)
12
9.7
10
8.3
8
7.1
6.2
6
5.1
3.9
4
3.4
2.31.9
2
1.2
0.1
0.5
0.3
0
(0.3)
(0.4)
(2)
3QFY15
4QFY15
1QFY16
2QFY16
3QFY16
North America
Europe
Rest of the world
Source: Company, Angel Research
January 20, 2016
4
Infosys | 3QFY2016 Result Update
Hiring and utilization
Infosys added 14,027 gross employees in 3QFY2016, of which 6,115 were lateral
additions. The net addition number for the quarter stood at 8,620. Attrition (for
standalone entity) remained persistently high in 3QFY2016; it increased to 18.1%
(LTM), up from 19.9% in 2QFY2016. The levels of attrition in the company which
had been on continues rise, came down during the quarter. The company is trying
to inch up its utilization level, which could act as one of the margin levers.
Exhibit 7: Employee metrics
3QFY15 4QFY15 1QFY16 2QFY16 3QFY16
Gross addition
13,154
14,471
11,889
17,595
14,027
Net addition
4,227
6,549
3,336
8,453
8,620
Gross lateral emp. addition
6,094
8,334
5,886
7,452
6,115
Attrition - LTM basis (%)*
20.4
18.4
19.2
19.9
18.1
Source: Company, Angel Research, Note-* excluding subsidiaries
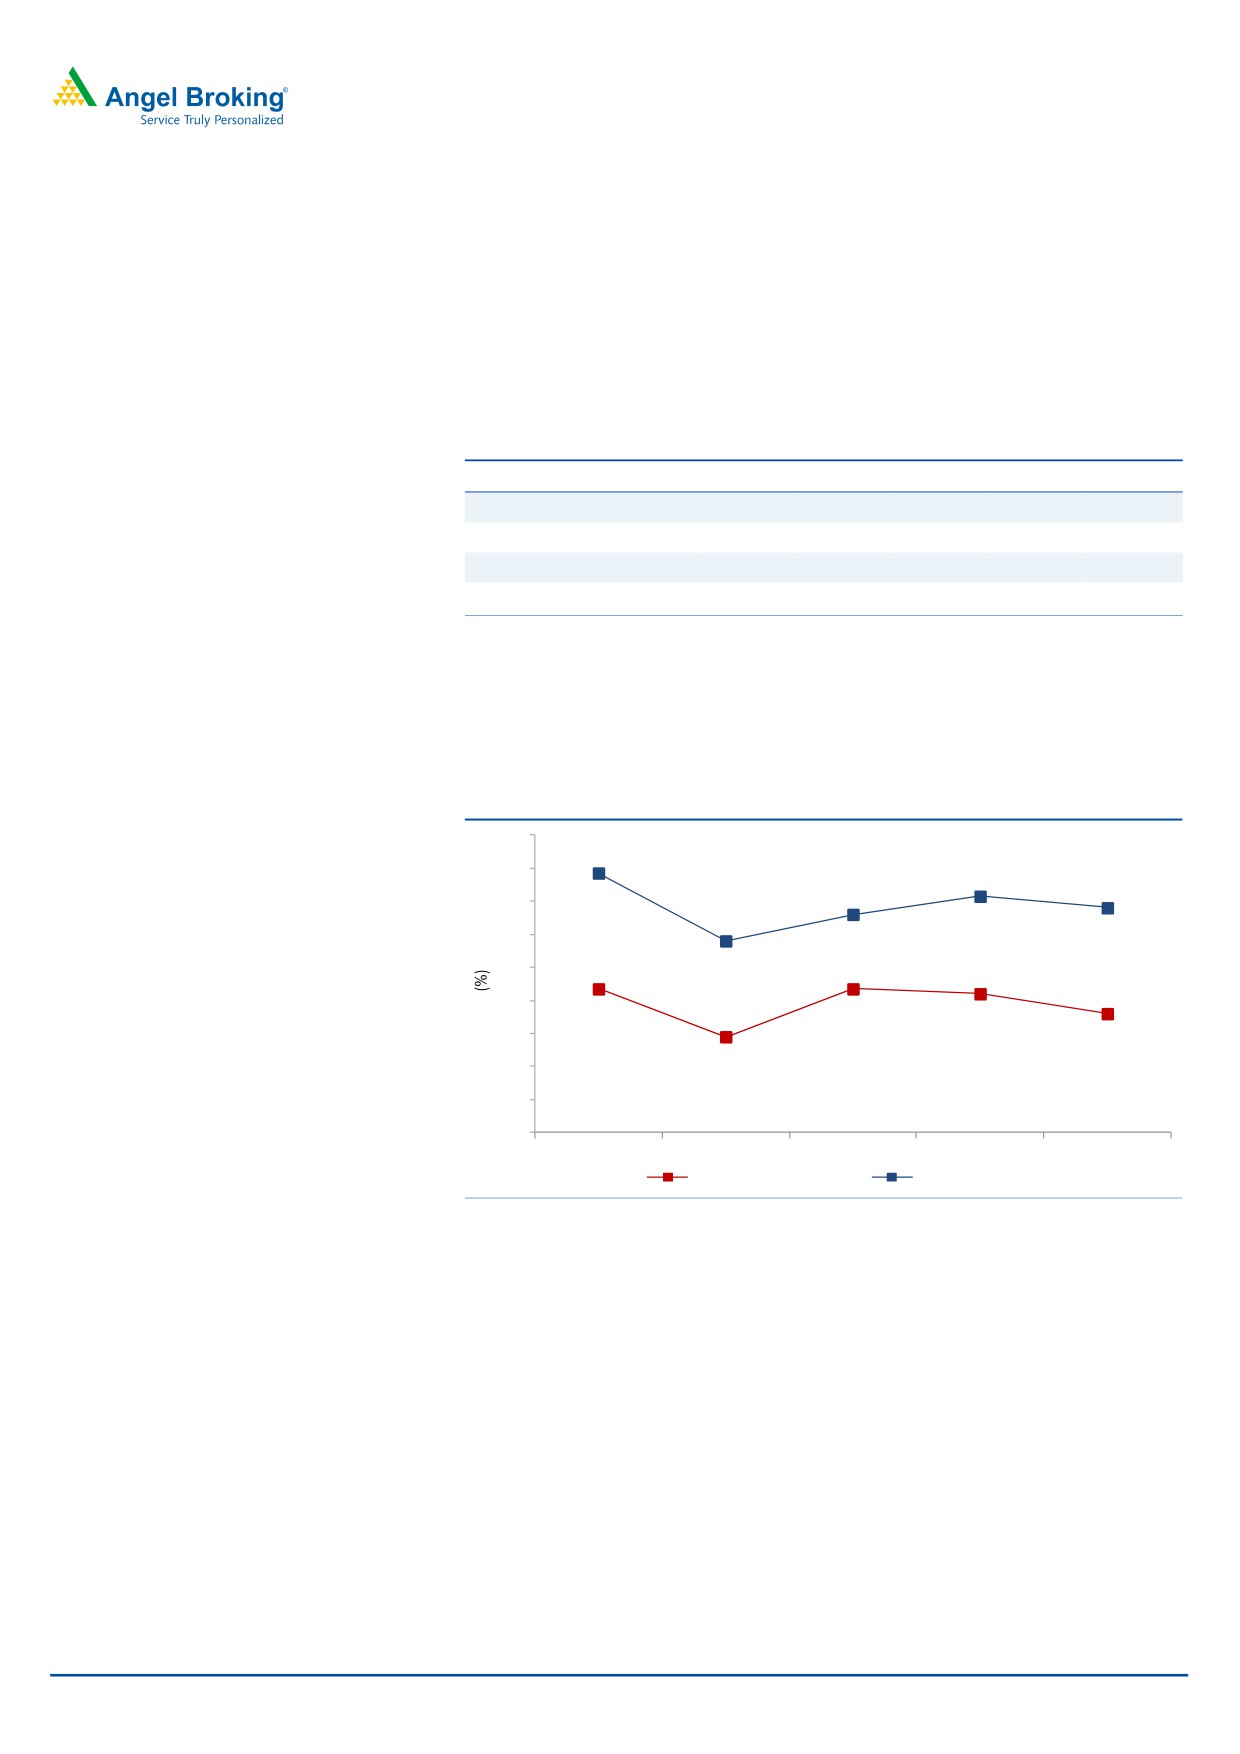
With the company focusing on improving its utilization level, the utilization rate
including trainees de-grew by 120bp qoq to 74.2% (higher than 75.4% as in
2QFY2016); while excluding trainees, it de-grew by 70bp qoq to 80.6%.
Exhibit 8: Trend in utilization (Services and consulting + Projects)
85
82.7
83
81.3
80.6
80.2
81
78.6
79
77
75
75.7
75.7
75.4
73
74.2
71
72.8
69
67
3QFY15
4QFY15
1QFY16
2QFY16
3QFY16
Including trainees
Excluding trainees
Source: Company, Angel Research
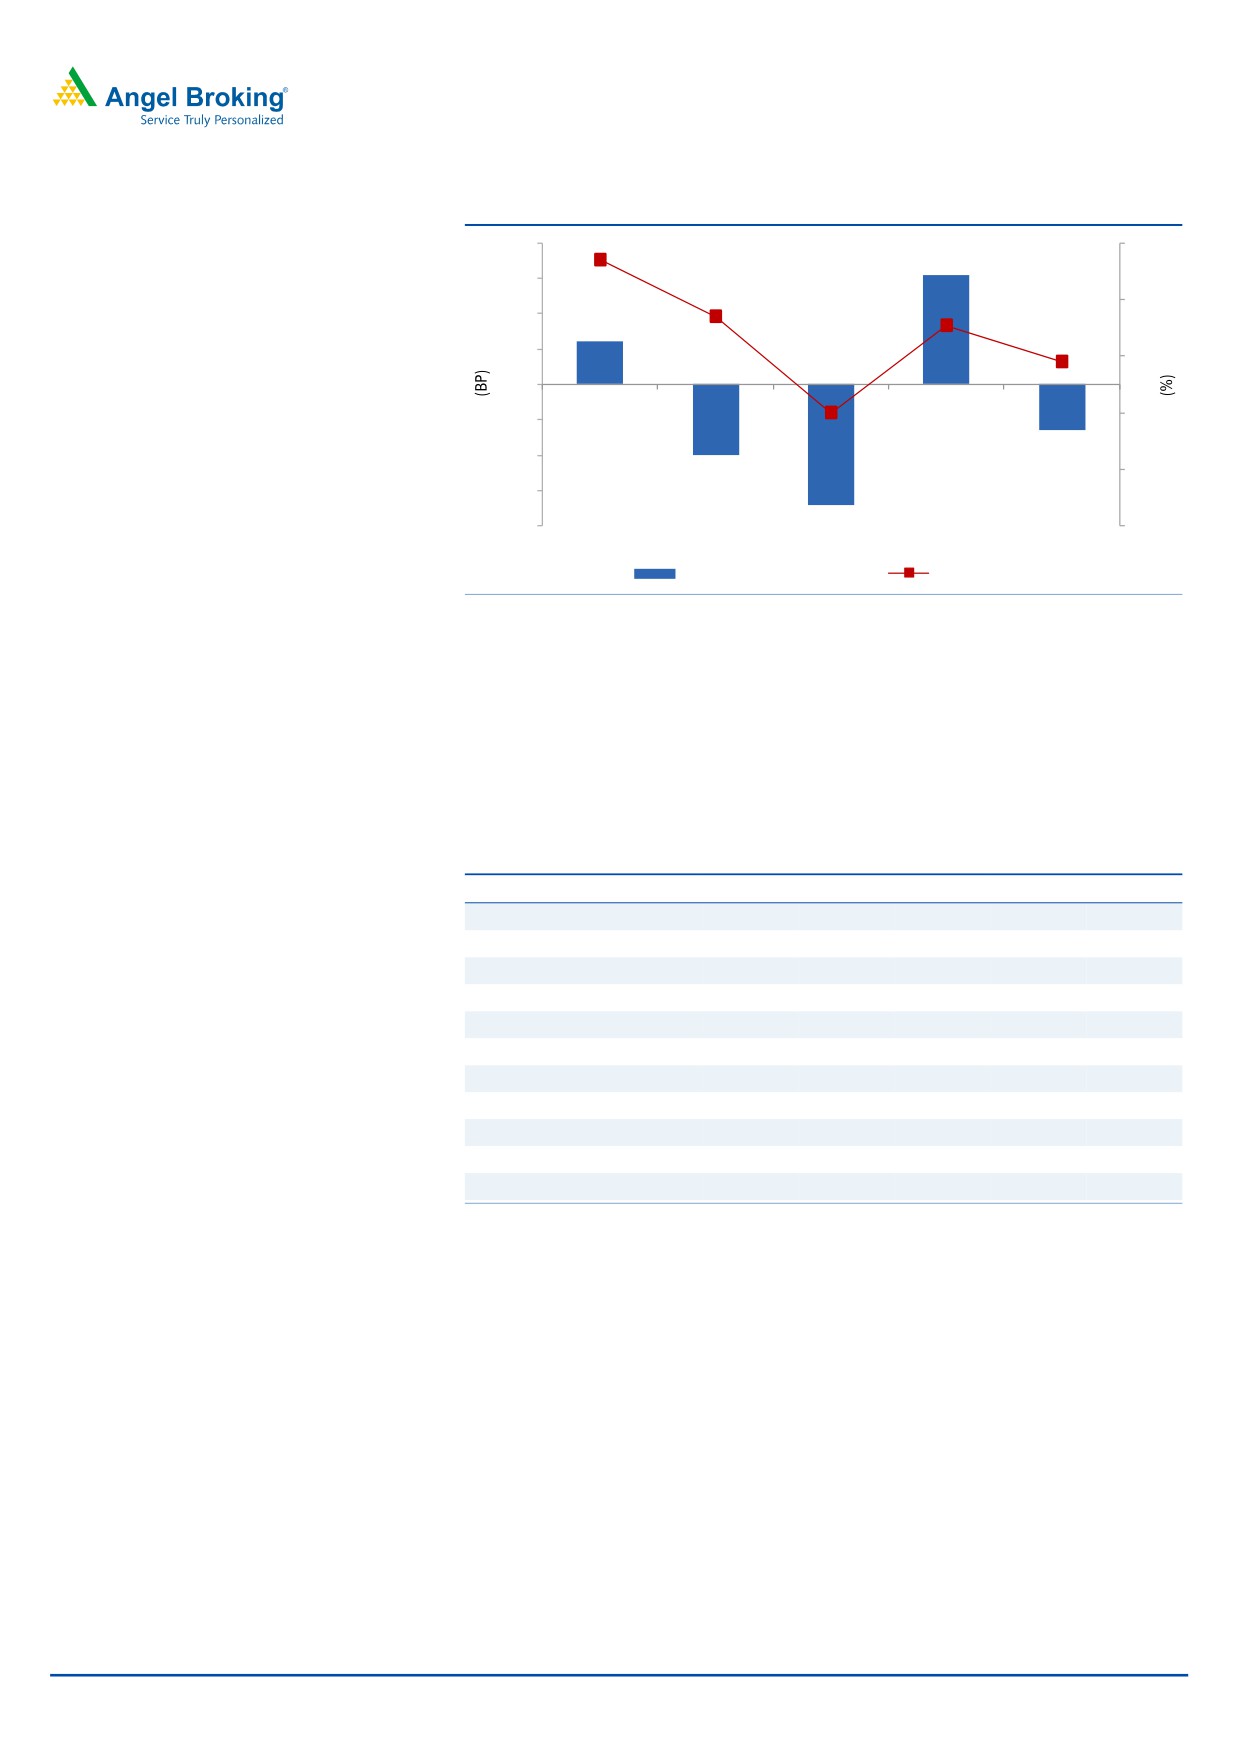
Margins dip
On the operating front, the EBITDA margin came in at 27.2% (V/s
27.0%
expected), declining by 62bp qoq, owing to pricing decline by 2.5% qoq and lower
utilization. The EBIT margin at 24.9%, declining by 64bp sequentially, impacted
adversely by lower realization
(110bp impact), lower utilization and Noah
Consulting consolidation (~60bp impact) while rupee depreciation and lower
variable pay aided to mitigate margin headwinds partially.
The Management indicated that the EBIT margin for FY2016 is expected to be in
the range of 24-26%.
January 20, 2016
5
Infosys | 3QFY2016 Result Update
Exhibit 9: Trend in EBIT margin
200
26.7
27
150
25.7
154
26
100
25.5
50
60
25
24.9
24.0
0
24
(50)
(100)
(64)
(100)
23
(170)
(150)
(200)
22
3QFY15
4QFY15
1QFY16
2QFY16
3QFY16
Margin movement (qoq)
EBIT margin (%)
Source: Company, Angel Research
Client pyramid
Infosys added 75 new clients (gross additions) during the quarter, taking its
total active client base to 1045. The client addition was across the board. The
company added 7 clients in the US$100-200mn bracket. Also, the company
bagged new deals with TCV of US$360mn, during the quarter.
Exhibit 10: Client metrics
Particulars
3QFY15 4QFY15 1QFY16 2QFY16 3QFY16
Top client (% of revenue)
3.2
3.5
3.7
3.7
3.5
Gross Client addition
59
52
79
82
75
Active client
932
950
987
1011
1045
US$1mn-5mn
292
285
287
284
294
US$5mn-10mn
86
85
87
89
90
US$10mn-20mn
71
76
78
84
82
US$20mn-50mn
37
36
34
35
23
US$50mn-100mn
17
18
21
19
15
US$100mn-200mn
15
14
14
17
7
US$200mn-300mn
10
11
8
8
5
US$300mn plus
0
0
1
1
1
Source: Company, Angel Research
Concall Highlights
Infosys won deals worth TCV of US$360mn during the quarter.
Overall, the Management is upbeat about the future prospects of the
company, given the strong order book position which is guided towards
US$3bn.
On back of strong performance in 1HFY2016, the Management has
maintained CC revenue growth guidance of 12.8-13.2% V/s 10.0-12.0%
guided earlier for FY2016.
The company reiterated its target EBIT margins band of 24-26% for the
medium term while citing continued need for calibrated investments in the
business.
January 20, 2016
6
Infosys | 3QFY2016 Result Update
Investment arguments
Revenue growth guidance upgraded to 12.8-13.2% from 10-12% CC guided
earlier for FY2016: The Management has guided towards higher revenue growth
for FY2016, ie of 12.8-13.2% in CC terms and 16.2-16.6% in INR terms on
exchange rate of (as on December 31, 2015). The earlier revenue growth
guidance was of 10-12% in CC terms for FY2016. We expect the company to post
~9.6% USD revenue growth in FY2016. The company expects to lead industry
growth and reach a milestone of achieving sales of US$20bn by FY2020.
Currently we have factored in a moderate growth for FY2017 (INR and USD
growth of 13.0%).
Aims to be US$20bn company by FY2020: The Management believes the
traditional IT services model is dying and a structural change is taking place in the
industry. Pricing pressure is being witnessed in commoditized services, thus
necessitating the company to pursue newer growth avenues including acquisitions
in areas like automation. The outsourcing services provider is therefore looking to
ramp up its productivity through automation and is looking for acquisitions to
boost growth. Infosys' cash and cash equivalents were at US$5.2bn as at the end
of March 2015.
The company expects its revenue to rise to US$20bn by FY2020, from US$8.7bn
now, as it focuses on acquisitions and win more new technology services, implying
a 14% CAGR over the period. Over the near term, we expect Infosys to post a
9.6% USD revenue growth in FY2016. Over FY2015-17E, we expect USD and INR
revenue to grow at a CAGR of 11.3% and 14.5%, respectively. The Management
expects to lead industry growth from FY2017 onwards.
Operating margin likely to be range bound in near term: The Management
maintained its stance that the company is right now focused on growth (at least for
the next couple of quarters) and this may lead to sacrifice in margins in the near
term. The operating margin is subject to tailwinds on a stable rupee, further
improvement in utilization rates and cost optimization drive running in the
company, though it has headroom to increase its utilization level by ~300bp to be
comparable with peers. This, in turn, will assist in increasing operating margins
further. Going ahead, given a stable rupee, higher S&M spends, and wage hikes
in FY2016, we expect the EBIT margin to remain at 25.5% in FY2016 and FY2017
(V/s 25.9% in FY2015). Over FY2015-17E, we expect an EBIT CAGR of 13.5%.
However, as part of its `Vision 2020’ (target to have US$20bn revenues at 30%
operating margins and US$80,000 per employee revenue productivity by
CY2020), the Management expects acceleration in revenue growth and margin
improvement to reflect ahead of the increase in revenue productivity.
Outlook and valuation
The company has upgraded its USD revenue growth guidance for FY2016 to 12.8-
13.2% from 10-12% on CC basis earlier. We expect the company to post ~9.6%
USD revenue growth in FY2016. By FY2017, the company expects to lead industry
growth. It aims to reach a milestone of achieving sales of US$20bn by FY2020.
Also, the company plans to utilize cash properly through increased dividends and
acquisitions, so that it can increase its capital efficiency. Currently we have built in
a conservative growth for FY2017. The stock trades at current valuations of 17.3x
FY2017E earnings. We recommend a Buy on the stock with a price target of
`1,347.
January 20, 2016
7
Infosys | 3QFY2016 Result Update
Exhibit 11: Key assumptions
Parameters
FY2016E
FY2017E
Revenue growth - USD terms (%)
9.6
13.0
USD-INR rate
65.0
65.0
Revenue growth - INR terms (%)
16.0
13.0
EBITDA margin (%)
27.5
27.5
Tax rate (%)
29.0
29.0
EPS growth (%)
10.6
10.7
Source: Company, Angel Research
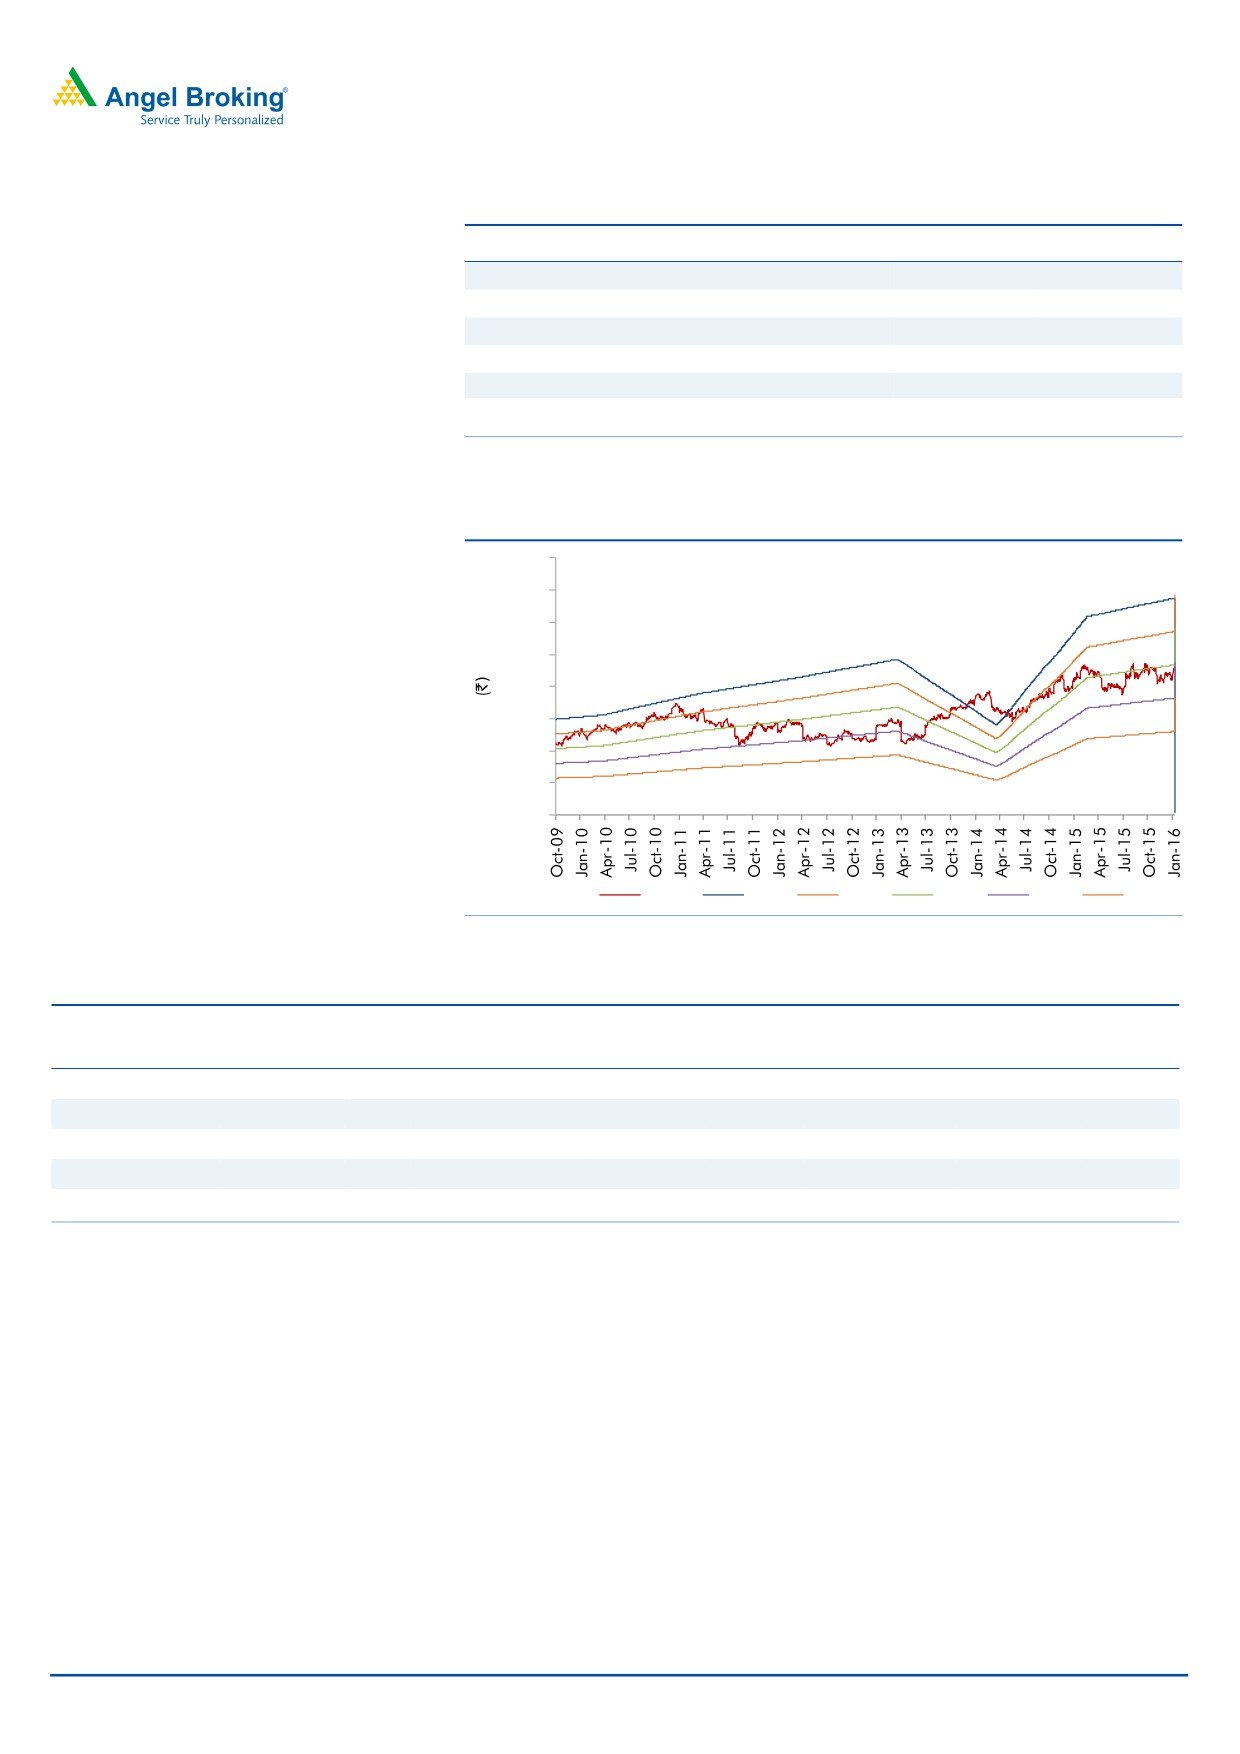
Exhibit 12: One-year forward PE (x)
2,000
1,750
1,500
1,250
1,000
750
500
250
0
Price
26x
22x
18x
14x
10x
Source: Company, Angel Research
Exhibit 13: Recommendation summary
Company
Reco
CMP Tgt. price Upside
FY2017E FY2017E
FY2015-17E
FY2017E
FY2017E
(`)
(`)
(%)
EBITDA (%)
P/E (x)
EPS CAGR (%)
EV/Sales (x)
RoE (%)
HCL Tech
Buy
839
1,132
34.9
23.5
13.3
10.6
1.9
19.8
Infosys
Buy
1,139
1,347
18.3
27.5
17.3
10.6
3.1
20.1
TCS
Buy
2,279
2,854
25.2
28.5
16.5
11.8
3.2
38.9
Tech Mahindra
Buy
512
646
25.9
17.0
16.1
8.0
1.4
18.6
Wipro
Buy
542
719
32.6
23.8
12.8
9.7
1.7
17.9
Source: Company, Angel Research
Company Background
Infosys is the second largest IT company in India, employing over
1,76,187
professionals (as of FY2015). The company services more than 900 clients across
various verticals, such as financial services, manufacturing, telecom, retail and
healthcare. Infosys has the widest portfolio of service offerings amongst Indian IT
companies, spanning across the entire IT service value chain - from traditional
Application Development and Maintenance to Consulting and Package
Implementation to Products and Platforms.
January 20, 2016
8
Infosys | 3QFY2016 Result Update
Profit and loss statement (IFRS, consolidated)
Y/E March (` cr)
FY2012
FY2013
FY2014
FY2015
FY2016E FY2017E
Net sales
33,733
40,352
50,133
53,319
61,850
69,891
Cost of revenue
18,877
24,158
30,767
31,817
42,034
35,994
Gross profit
14,856
16,194
19,366
21,502
24,431
27,607
% of net sales
44.0
40.1
38.6
40.3
39.5
39.5
Selling and mktg exp.
1,757
2,034
2,625
2,941
3,402
3,844
% of net sales
5.2
5.0
5.2
5.5
5.5
5.5
General and admin exp.
2,390
2,609
3,107
3,663
4,020
4,543
% of net sales
7.1
6.5
6.2
6.9
6.5
6.5
EBITDA
10,709
11,551
13,634
14,898
17,009
19,220
% of net sales
31.7
28.6
27.2
27.9
27.5
27.5
Dep and amortization
931
1,122
1,374
1,066
1,237
1,398
% of net sales
2.8
2.8
2.7
2.0
2.0
2.0
EBIT
9,778
10,429
12,260
13,832
15,772
17,822
% of net sales
29.0
25.8
24.5
25.9
25.5
25.5
Other income
1,904
2,359
2,669
3,427
3,427
3,427
Profit before tax
11,683
12,788
14,929
17,259
19,199
21,249
Provision for tax
3,368
3,367
4,062
4,929
5,568
6,162
% of PBT
28.8
26.3
27.2
28.6
29.0
29.0
PAT
8,315
9,421
10,648
12,330
13,631
15,087
Exceptional item
-
-
219
-
-
-
Adj. PAT
8,315
9,421
10,867
12,330
13,631
15,087
EPS (`)
36.2
41.0
47.3
53.7
59.4
65.7
January 20, 2016
9
Infosys | 3QFY2016 Result Update
Balance sheet (IFRS, consolidated)
Y/E March (` cr)
FY2012
FY2013
FY2014
FY2015
FY2016E FY2017E
Current assets
Cash and cash equivalents
20,591
21,832
25,950
30,367
38,702
48,978
Available for sale financial assets
32
1,739
2,197
874
2,197
2,197
Investment in certificates of deposit
345
-
859
93
859
859
Trade receivables
5,882
7,083
8,351
9,713
10,122
11,742
Unbilled revenue
1,873
2,435
2,811
2,845
3,434
3,434
Derivative financial instruments
-
101
215
101
215
215
Prepayments and other current assets
1,523
2,123
2,636
3,296
3,497
4,054
Total current assets
30,246
35,313
43,019
47,289
59,026
71,479
Non-current assets
Property, plant and equipment
5,409
6,468
7,887
9,125
9,325
9,525
Goodwill
993
1,976
2,157
3,091
2,157
2,157
Intangible assets
173
368
342
638
342
342
Available for sale financial assets
12
394
1,252
1,345
1,252
1,252
Deferred income tax assets
316
503
656
537
656
656
Income tax assets
1,037
1,092
1,522
4,089
1,722
1,722
Other non-current assets
162
237
220
238
1,632
1,632
Total non-current assets
8,102
11,038
14,036
19,063
17,086
15,507
Total assets
38,348
46,351
57,055
66,352
76,112
86,986
Current liabilities
Trade payables
23
189
173
140
173
173
Derivative financial instruments
42
-
-
3
-
-
Current income tax liabilities
1,054
1,329
2,187
2,818
3,787
3,787
Client deposits
15
36
40
27
40
40
Unearned revenue
545
823
660
1,052
660
660
Employee benefit obligations
498
614
954
1,069
954
954
Provisions
133
213
379
478
379
379
Other liabilties
2,456
3,082
4,745
5,796
5,545
5,545
Total current liabilities
4,766
6,286
9,138
11,383
11,538
11,538
Non-current liabilities
Deferred income tax liabilties
12
119
64
160
64
64
Employee benefit obligations
109
149
323
46
323
323
Other liabilities
-
-
-
-
-
-
Total non-current liabilties
121
268
387
206
387
387
Total liabilities
4,887
6,554
9,525
11,589
11,925
11,925
Equity
Share capital
286
286
286
572
1,148
1,148
Share premium
3,089
3,090
3,090
3,090
3,090
3,090
Retained earnings
29,816
36,114
43,584
50,531
59,378
70,253
Other components of equity
270
307
570
570
570
570
Total equity
33,461
39,797
47,530
54,763
64,187
75,061
Total liabilties and equity
38,348
46,351
57,055
66,352
76,112
86,986
January 20, 2016
10
Infosys | 3QFY2016 Result Update
Cash flow statement (IFRS, consolidated)
Y/E March (` cr)
FY2012
FY2013
FY2014
FY2015 FY2016E FY2017E
Pre tax profit from operations
9,778
10,429
12,260
13,832
15,772
17,822
Depreciation
931
1,122
1,374
1,066
1,237
1,398
Pre tax cash from operations
10,709
11,551
13,634
14,898
17,009
19,220
Other income/prior period ad
1,904
2,359
2,669
3,427
3,427
3,427
Net cash from operations
12,614
13,910
16,303
18,325
20,436
22,647
Tax
3,368
3,367
4,062
4,929
5,568
6,162
Cash profits
9,246
10,543
12,241
13,396
14,868
16,485
(Inc)/dec in current assets
(2,399)
(2,464)
(2,271)
(1,942)
(1,313)
(2,176)
Inc/(dec) in current liabilties
1,125
1,520
2,852
2,245
155
-
(Inc)/dec in net trade WC
(1,274)
(944)
581
303
(1,158)
(2,176)
Cashflow from operating actv.
7,972
9,599
12,822
13,699
13,710
14,308
(Inc)/dec in fixed assets
(1,496)
(2,181)
(2,793)
(2,304)
(1,437)
(1,598)
(Inc)/dec in investments
(233)
(1,362)
(1,317)
2,089
(2,089)
-
(inc)/dec in sale of financial assets
11
(382)
(858)
(93)
93
-
(Inc)/dec in deferred tax assets
18
(242)
(583)
(2,448)
2,248
-
Inc/(dec) in other non current liab.
(198)
147
119
(181)
181
-
(Inc)/dec in other non current ass.
8
(1,253)
(138)
(1,248)
(164)
-
Cashflow from investing actv.
(1,890)
(5,273)
(5,570)
(4,185)
(1,168)
(1,598)
Inc/(dec) in debt
-
-
-
-
-
-
Inc/(dec) in equity/premium
(1,155)
(280)
1,077
(885)
4
748
Dividends
1,002
2,805
4,211
4,212
4,212
3,182
Cashflow from financing actv.
(2,157)
(3,085)
(3,134)
(5,097)
(4,208)
(2,434)
Cash generated/(utilised)
3,925
1,241
4,118
4,417
8,335
10,277
Cash at start of the year
16,666
20,591
21,832
25,950
30,367
38,702
Cash at end of the year
20,591
21,832
25,950
30,367
38,702
48,978
January 20, 2016
11
Infosys | 3QFY2016 Result Update
Key ratios
Y/E March
FY2012
FY2013
FY2014
FY2015
FY2016E
FY2017E
Valuation ratio (x)
P/E
31.5
27.8
24.1
21.2
19.2
17.3
P/CEPS
28.3
24.8
21.4
19.5
17.6
15.9
P/BVPS
7.8
6.6
5.5
4.8
4.1
3.5
Dividend yield (%)
1.3
3.7
5.5
5.5
5.5
5.5
EV/Sales
7.1
5.9
4.6
4.3
3.5
3.0
EV/EBITDA
22.3
20.4
16.9
15.3
12.8
10.8
EV/Total assets
6.2
5.1
4.0
3.4
2.9
2.4
Per share data (`)
EPS
36
41
47
54
59
66
Cash EPS
40
46
53
58
65
72
Dividend
15
42
63
63
63
63
Book value
146
173
207
239
280
327
Dupont analysis
Tax retention ratio (PAT/PBT)
0.7
0.7
0.7
0.7
0.7
0.7
Cost of debt (PBT/EBIT)
1.2
1.2
1.2
1.2
1.2
1.2
EBIT margin (EBIT/Sales)
0.3
0.3
0.2
0.3
0.3
0.3
Asset turnover ratio (Sales/Assets)
0.9
0.9
0.9
0.8
0.8
0.8
Leverage ratio (Assets/equity)
1.1
1.2
1.2
1.2
1.2
1.2
Operating ROE
24.9
23.7
22.4
22.5
21.2
20.1
Return ratios (%)
RoCE (pre-tax)
25.5
22.5
21.5
20.8
20.7
20.5
Angel RoIC
56.3
45.8
43.7
39.5
45.9
51.0
RoE
24.9
23.7
22.9
22.5
21.2
20.1
Turnover ratios(x)
Asset turnover (fixed assets)
4.2
3.7
3.6
2.8
3.6
4.5
Receivables days
84
86
81
86
80
79
January 20, 2016
12
Infosys | 3QFY2016 Result Update
Research Team Tel: 022 - 39357800
DISCLAIMER
Angel Broking Private Limited (hereinafter referred to as “Angel”) is a registered Member of National Stock Exchange of India Limited,
Bombay Stock Exchange Limited and Metropolitan Stock Exchange of India Limited. It is also registered as a Depository Participant with
CDSL and Portfolio Manager with SEBI. It also has registration with AMFI as a Mutual Fund Distributor. Angel Broking Private Limited is
a registered entity with SEBI for Research Analyst in terms of SEBI (Research Analyst) Regulations, 2014 vide registration number
INH000000164. Angel or its associates has not been debarred/ suspended by SEBI or any other regulatory authority for accessing
/dealing in securities Market. Angel or its associates including its relatives/analyst do not hold any financial interest/beneficial
ownership of more than 1% in the company covered by Analyst. Angel or its associates/analyst has not received any compensation /
managed or co-managed public offering of securities of the company covered by Analyst during the past twelve months. Angel/analyst
has not served as an officer, director or employee of company covered by Analyst and has not been engaged in market making activity
of the company covered by Analyst.
This document is solely for the personal information of the recipient, and must not be singularly used as the basis of any investment
decision. Nothing in this document should be construed as investment or financial advice. Each recipient of this document should
make such investigations as they deem necessary to arrive at an independent evaluation of an investment in the securities of the
companies referred to in this document (including the merits and risks involved), and should consult their own advisors to determine
the merits and risks of such an investment.
Reports based on technical and derivative analysis center on studying charts of a stock's price movement, outstanding positions and
trading volume, as opposed to focusing on a company's fundamentals and, as such, may not match with a report on a company's
fundamentals.
The information in this document has been printed on the basis of publicly available information, internal data and other reliable
sources believed to be true, but we do not represent that it is accurate or complete and it should not be relied on as such, as this
document is for general guidance only. Angel Broking Pvt. Limited or any of its affiliates/ group companies shall not be in any way
responsible for any loss or damage that may arise to any person from any inadvertent error in the information contained in this report.
Angel Broking Pvt. Limited has not independently verified all the information contained within this document. Accordingly, we cannot
testify, nor make any representation or warranty, express or implied, to the accuracy, contents or data contained within this document.
While Angel Broking Pvt. Limited endeavors to update on a reasonable basis the information discussed in this material, there may be
regulatory, compliance, or other reasons that prevent us from doing so.
This document is being supplied to you solely for your information, and its contents, information or data may not be reproduced,
redistributed or passed on, directly or indirectly.
Neither Angel Broking Pvt. Limited, nor its directors, employees or affiliates shall be liable for any loss or damage that may arise from
or in connection with the use of this information.
Note: Please refer to the important ‘Stock Holding Disclosure' report on the Angel website (Research Section). Also, please refer to the
latest update on respective stocks for the disclosure status in respect of those stocks. Angel Broking Pvt. Limited and its affiliates may
have investment positions in the stocks recommended in this report.
Disclosure of Interest Statement
Infosys
1. Analyst ownership of the stock
No
2. Angel and its Group companies ownership of the stock
No
3. Angel and its Group companies' Directors ownership of the stock
No
4. Broking relationship with company covered
No
Note: We have not considered any Exposure below ` 1 lakh for Angel, its Group companies and Directors
Ratings (Based on expected returns
Buy (> 15%)
Accumulate (5% to 15%)
Neutral (-5 to 5%)
over 12 months investment period):
Reduce (-5% to -15%)
Sell (< -15)
January 20, 2016
13