2QFY2016 Result Update | Pharmaceutical
November 9, 2015
Indoco Remedies
NEUTRAL
CMP
`305
Performance Highlights
Target Price
-
Y/E March (` cr)
2QFY16
1QFY16
% chg (qoq) 2QFY15
% chg (yoy)
Investment Period
-
Net sales
248
216
14.7
226
9.4
Other operating income
8
8
(0.8)
3
194.2
Stock Info
Gross profit
160
140
14.3
147
8.7
Operating profit
38
35
9.4
47
(17.4)
Sector
Pharmaceutical
Net profit
23
20
11.6
22
0.9
Market Cap (` cr)
2,810
Source: Company, Angel Research
Net Debt (` cr)
73
Indoco Remedies posted lower than expected numbers for 2QFY2016. The
Beta
0.9
company posted a 9.4% yoy growth in sales to `248cr V/s `272cr expected and
52 Week High / Low
413/262
V/s `226cr in 2QFY2015, on back of domestic and exports posting a growth of
Avg. Daily Volume
17,447
1.2% and 23.6% respectively. On the operating front, the EBITDA margin came in
Face Value (`)
2
at 15.5% V/s 20.9% expected and V/s 20.6% in 2QFY2015, on back of lower
BSE Sensex
26,265
than expected sales and 28.3% yoy and 82.6% yoy rise in staff expenditure and
Nifty
7,954
R&D expenditure, respectively. The R&D expenditure during the quarter was 3.6%
Reuters Code
INRM.BO
of sales V/s 2.2% of sales in 2QFY2015. Thus, the Adj. net profit came in at
Bloomberg Code
INDR@IN
`22.6cr V/s `33.4cr expected and V/s `22.4cr in 2QFY2015, a yoy growth of
0.9%. The lower than expected net profit is on back of lower than expected sales
and OPM. On back of valuations, we maintain our Neutral stance on the stock.
Shareholding Pattern (%)
Results lower than expected: The company posted lower than expected numbers
Promoters
59.3
for 2QFY2016. The company posted a 9.4% yoy growth in sales to `248cr V/s
MF / Banks / Indian Fls
13.5
`272cr expected and V/s `226cr in 2QFY2015, on back of domestic and exports
FII / NRIs / OCBs
9.4
posting a growth of 1.2% and 23.6% respectively. On the operating front, the
Indian Public / Others
17.8
EBITDA margin came in at 15.5% V/s 20.9% expected and V/s 20.6% in
2QFY2015, on back of lower than expected sales and 28.3% yoy and 82.6% yoy
rise in staff expenditure and R&D expenditure, respectively. The R&D expenditure
Abs. (%)
3m 1yr 3yr
during the quarter was 3.6% of sales V/s 2.2% of sales in 2QFY2015. Thus, the
Sensex
(7.2)
(5.9)
39.6
Adj. net profit came in at `22.6cr V/s `33.4cr expected and V/s `22.4cr in
Indoco
(11.4)
(1.6)
370.2
2QFY2015, a yoy growth of 0.9%. The lower than expected net profit is on back
of lower than expected sales and OPM
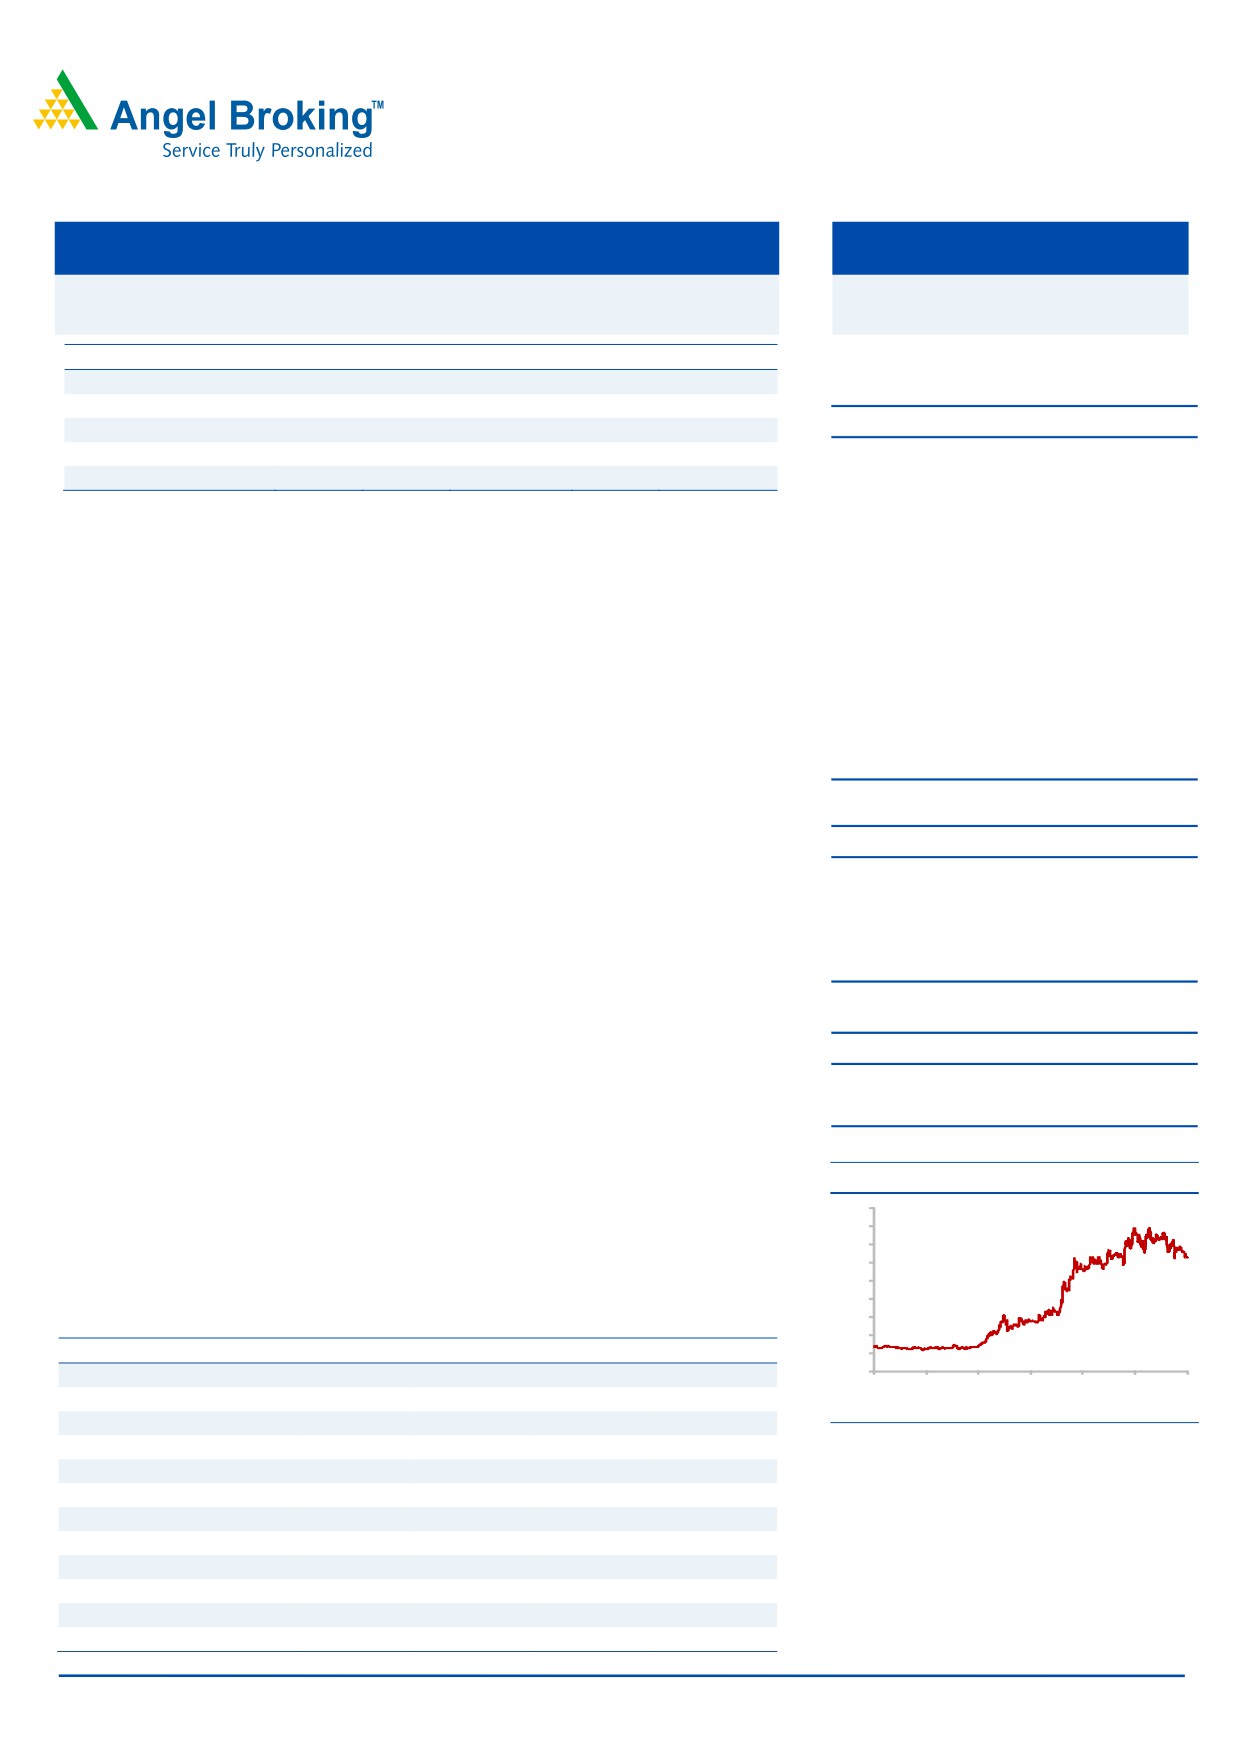
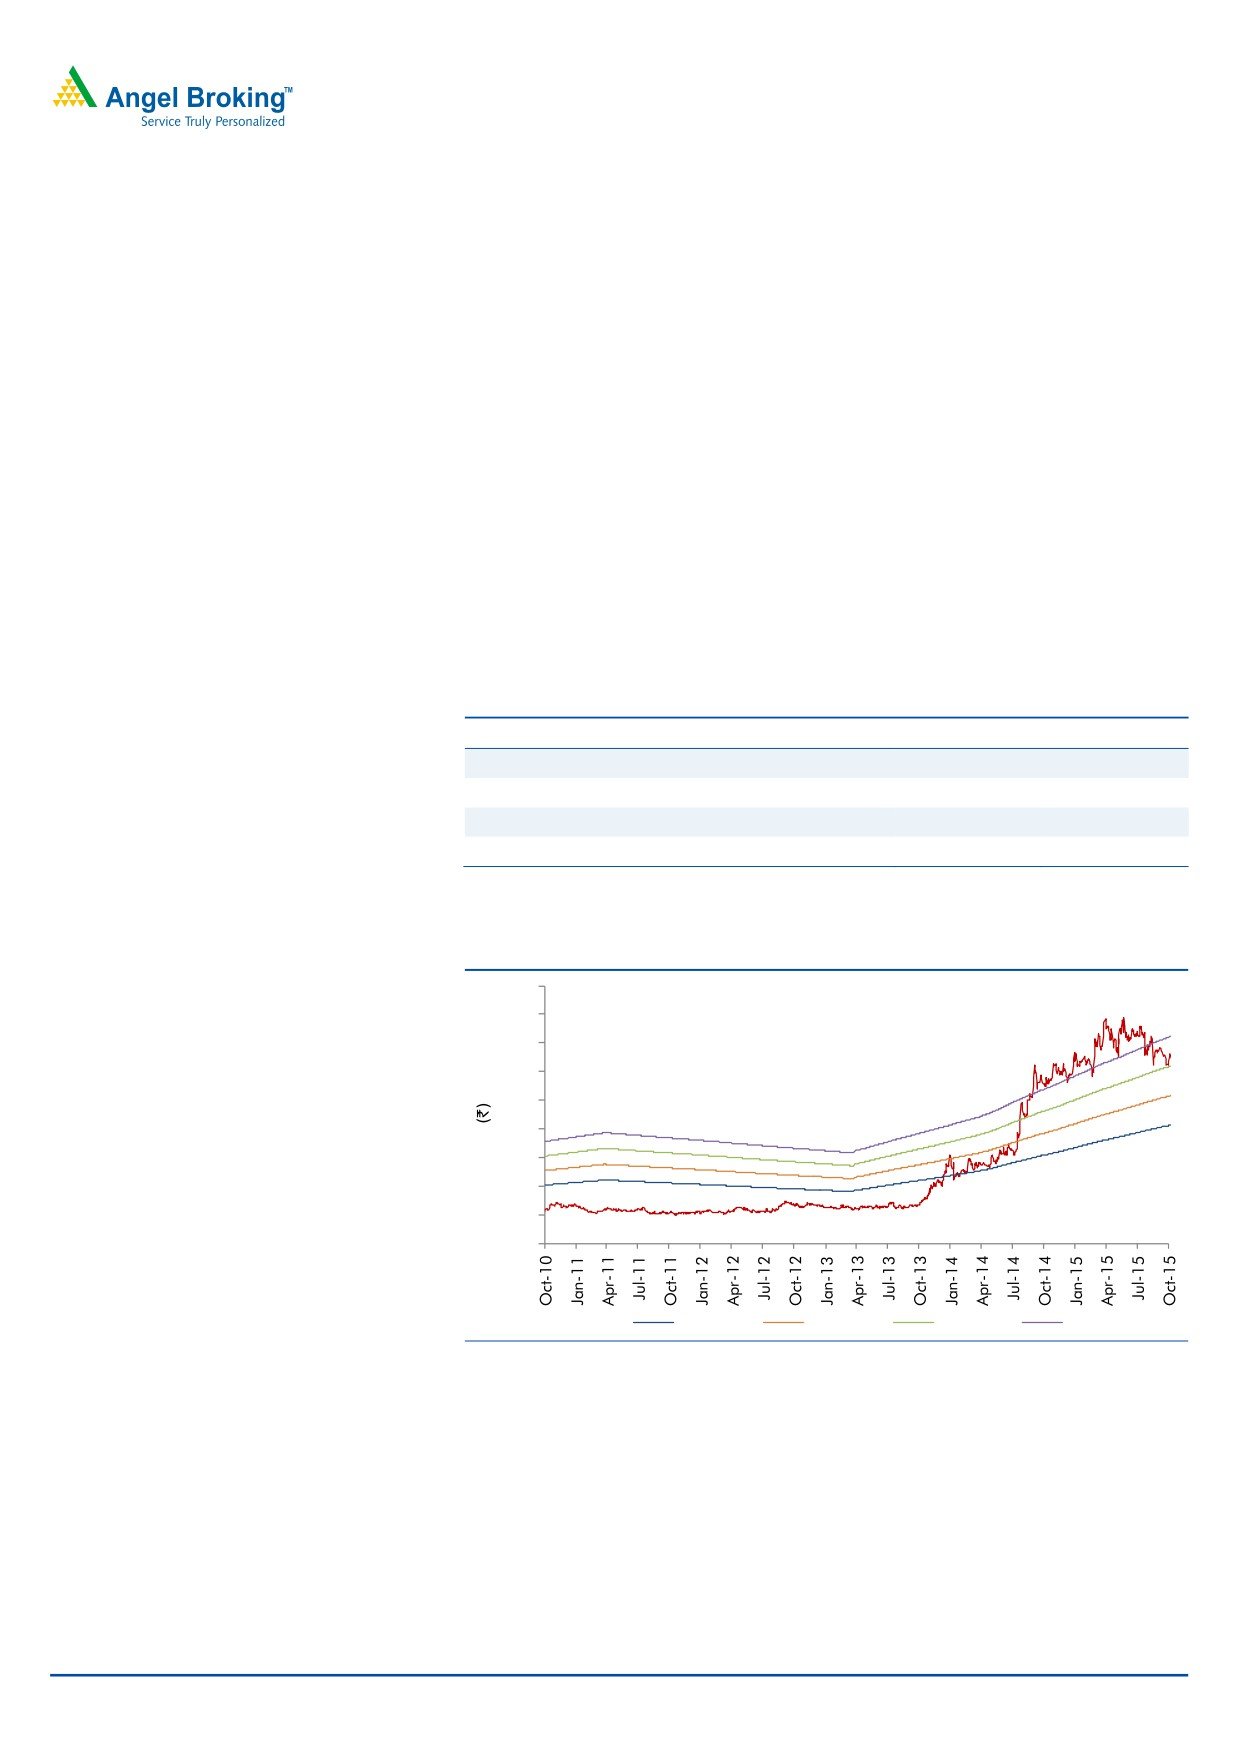
3-Year Daily Price Chart
Outlook and valuation: We expect net sales to post a 19.6% CAGR to `1,199cr
450
400
and EPS to post a 23.0% CAGR to `13.6 over FY2015-17E. At the current market
350
price, the stock is trading at 32.4x and 22.4x its FY2016E and FY2017E earnings,
300
250
respectively. We recommend a Neutral rating on the stock, given the valuations.
200
150
Key financials (Consolidated)
100
Y/E March (` cr)
FY2014
FY2015
FY2016E
FY2017E
50
0
Net sales
722.3
852.2
1,032.6
1,198.6
2
3
3
4
4
5
5
1
1
1
1
1
1
1
ŧ
r
ŧ
r
ŧ
r
ŧ
% chg
15.3
18.0
21.2
16.1
c
p
c
p
c
p
c
O
A
O
A
O
A
O
Net profit
58.2
82.8
86.8
125.3
Source: Company, Angel Research
% chg
36.5
42.3
4.9
44.4
EPS (`)
6.3
9.0
9.4
13.6
EBITDA margin (%)
15.2
18.9
15.9
18.2
P/E (x)
48.3
33.9
32.4
22.4
RoE (%)
13.4
17.0
15.7
19.7
RoCE (%)
13.9
18.3
15.3
19.2
P/BV (x)
6.1
5.4
4.8
4.1
Sarabjit Kour Nangra
EV/Sales (x)
4.0
3.4
2.9
2.4
+91 22 39357600 - Ext: 6806
EV/EBITDA (x)
26.1
17.9
17.9
13.3
Source: Company, Angel Research; Note: CMP as of November 6, 2015
Please refer to important disclosures at the end of this report
1
Indoco Remedies | 2QFY2016 Result Update
Exhibit 1: 2QFY2016 (Consolidated) performance
Y/E March (` cr)
2QFY2016
1QFY2016
% chg (qoq) 2QFY2015
% chg (yoy) 1HFY2016 1HFY2015
% chg (yoy)
Net sales
248
216
14.7
226
9.4
464
424
9.3
Other income
7.6
7.6
(0.8)
3
194.2
15
4
292.2
Total income
255
224
14.2
229
11.5
479
428
11.8
Gross profit
160
140
14.3
147
8.7
299
272
9.9
Gross margins (%)
64.4
64.6
64.8
64.5
64.1
Operating profit
38.5
35.2
9.4
46.6
(17.4)
73.7
82.5
(10.7)
OPM (%)
15.5
16.3
20.6
15.9
19.4
Interest
3
2
21.3
3
(2.2)
5
5
(11.6)
Dep & amortisation
15
15
(0.5)
13
13.2
30
23
32.0
PBT
29
26
11.2
33
(14.4)
54
58
(7.1)
Provision for taxation
5.9
5.4
9.8
11
(45.9)
11
16
(28.9)
Reported Net profit
23
20
11.6
22
0.9
43
42
1.0
Less : Exceptional items
0
0
-
0
0
0
PAT after exceptional items
23
20
11.6
22
0.9
43
42
1.0
EPS (`)
2.5
2.2
2.4
4.7
4.6
Source: Company, Angel Research
Exhibit 2: 2QFY2016 - Actual vs. Angel estimates
(` cr)
Actual
Estimate
Variation (%)
Net sales
248
272
(8.9)
Other operating income
8
3
194.2
Operating profit
38
57
(32.4)
Tax
6
9
(33.4)
Net profit
23
33
(32.4)
Source: Company, Angel Research
Revenues below expectations: The company posted a 9.4% yoy growth in sales to
`248cr V/s `272cr expected and V/s `226cr in 2QFY2015, on back of domestic
and exports posting a growth of 1.2% and 23.6% respectively.
Domestic markets (`146cr) posted a growth of 1.2% yoy, mainly on back a
tepid formulation sales (`138cr; up 0.5% yoy), while API sales (`7.6cr) posted
an 11.7% yoy growth. Top 10 therapies of the company contributed by 88.1%
to the IPM market. Indoco’s rank has improved from 28th to 27th in Sept’15
over the same month last year and on MAT basis, the rank improved from
29th to 28th (as on Sept’15; Source : AWACs)
Exports (`101cr) grew 23.6% yoy on back of formulation exports (`92.8cr; up
23.7% yoy), while API exports (`6.9cr) grew 3.6% yoy. The regulated markets
during the quarter grew by 25.6% yoy to `82.3cr as against `65.5cr during the
same quarter last year.
During the quarter, the company’s US business grew by 84% with revenues at
`26.4cr. Latanoprost ophthalmic solution sales picked up well during the quarter.
Launch of ophthalmic solution, viz Olopatadine 0.1% and Brimonidine 0.2% (own
ANDA), have been planned in quarter III and quarter IV respectively. In terms of
filings, the company (through partners or by itself), filed 19 ANDAs which are
pending approvals with 6 ANDAs approved till date. There are 33 under the
pipeline for the company.
November 9, 2015
2
Indoco Remedies | 2QFY2016 Result Update
The emerging markets for the quarter grew by 10.8% at `10.5cr as against `9.5cr
during the same quarter last year. Kenya, French West Africa, Uganda, Tanzania
and Myanmar drove sales during the quarter.
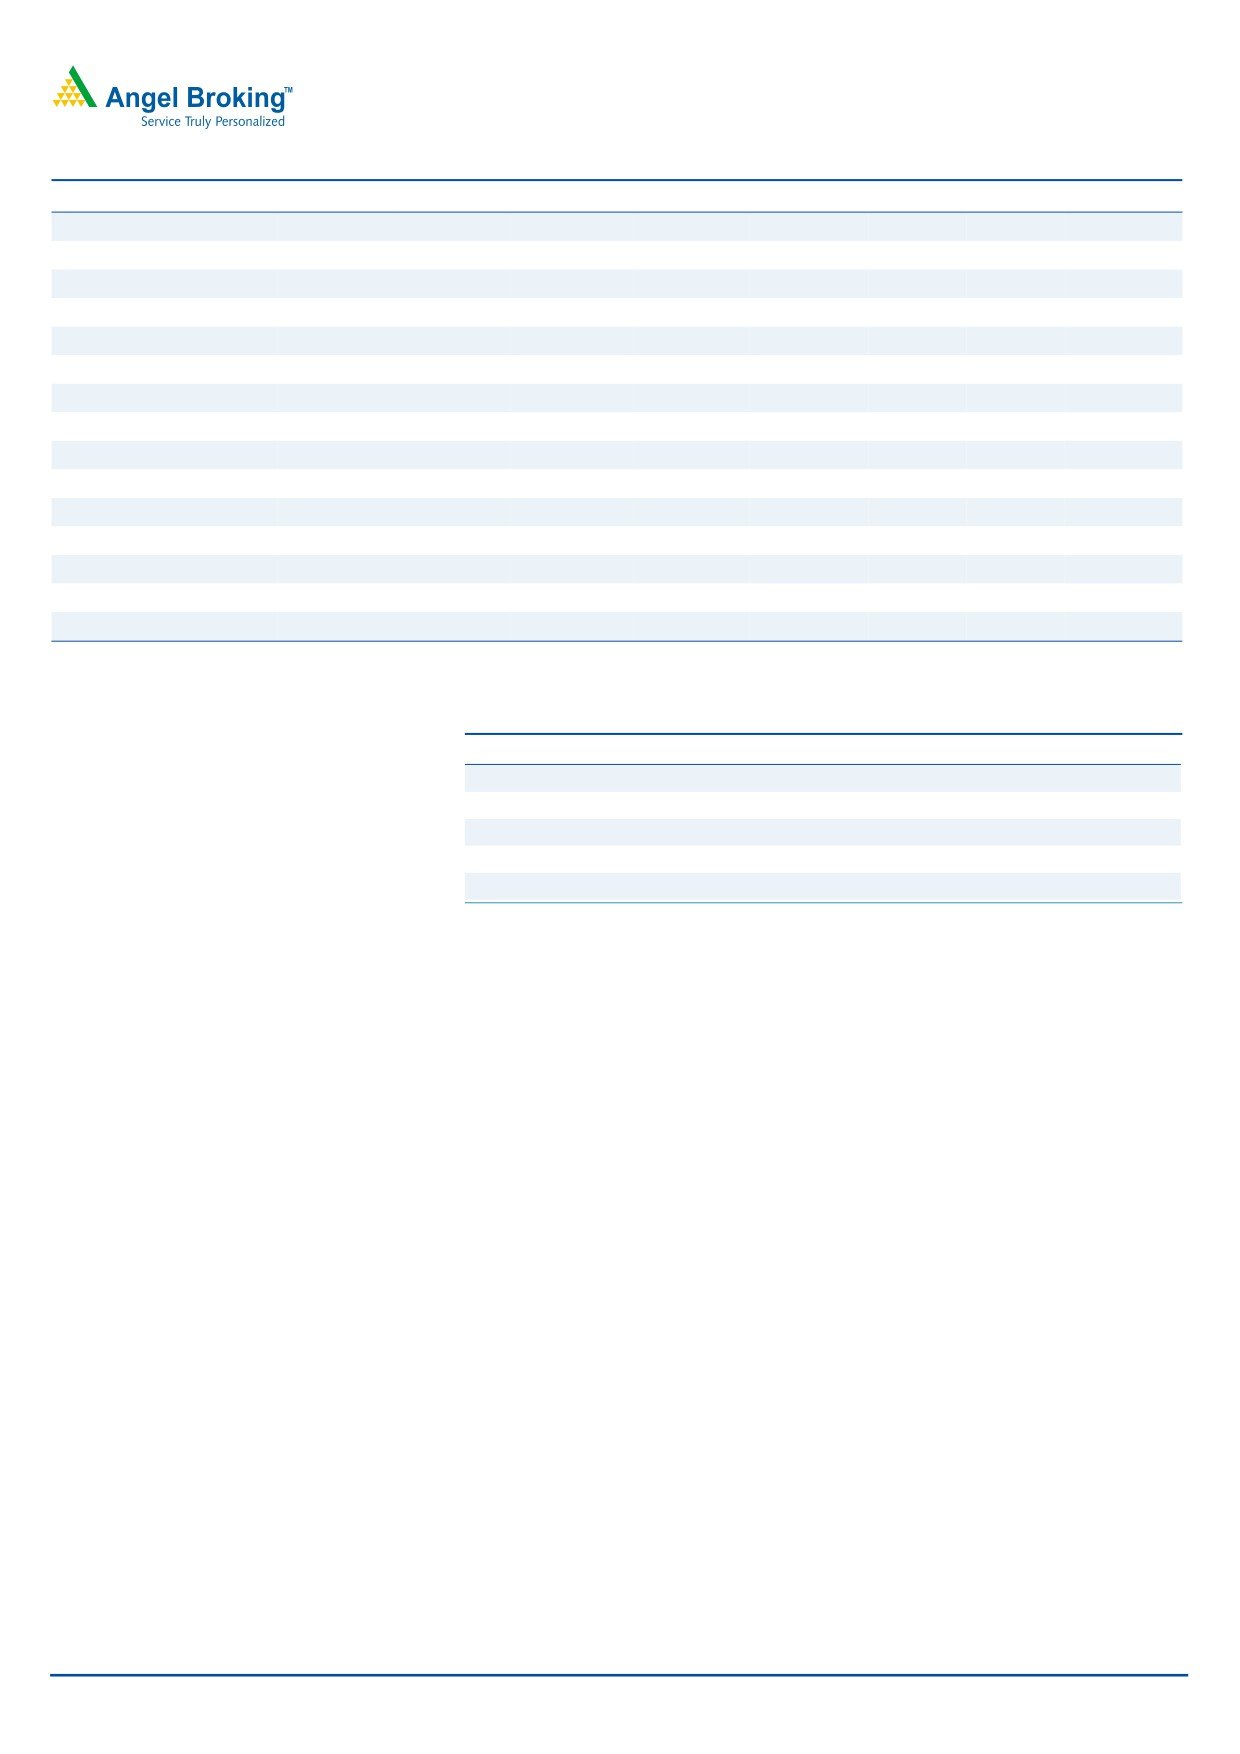
Exhibit 3: Domestic Formulation sales trend
150
137
138
140
130
123
123
124
120
110
100
90
80
70
60
50
2QFY2015
3QFY2015
4QFY2015
1QFY2016
2QFY2016
Source: Company, Angel research
Exhibit 4: Export sales trend
120.0
101
100.0
82
83
82
84
80.0
60.0
40.0
20.0
0.0
2QFY2015
3QFY2015
4QFY2015
1QFY2016
2QFY2016
Source: Company, Angel research
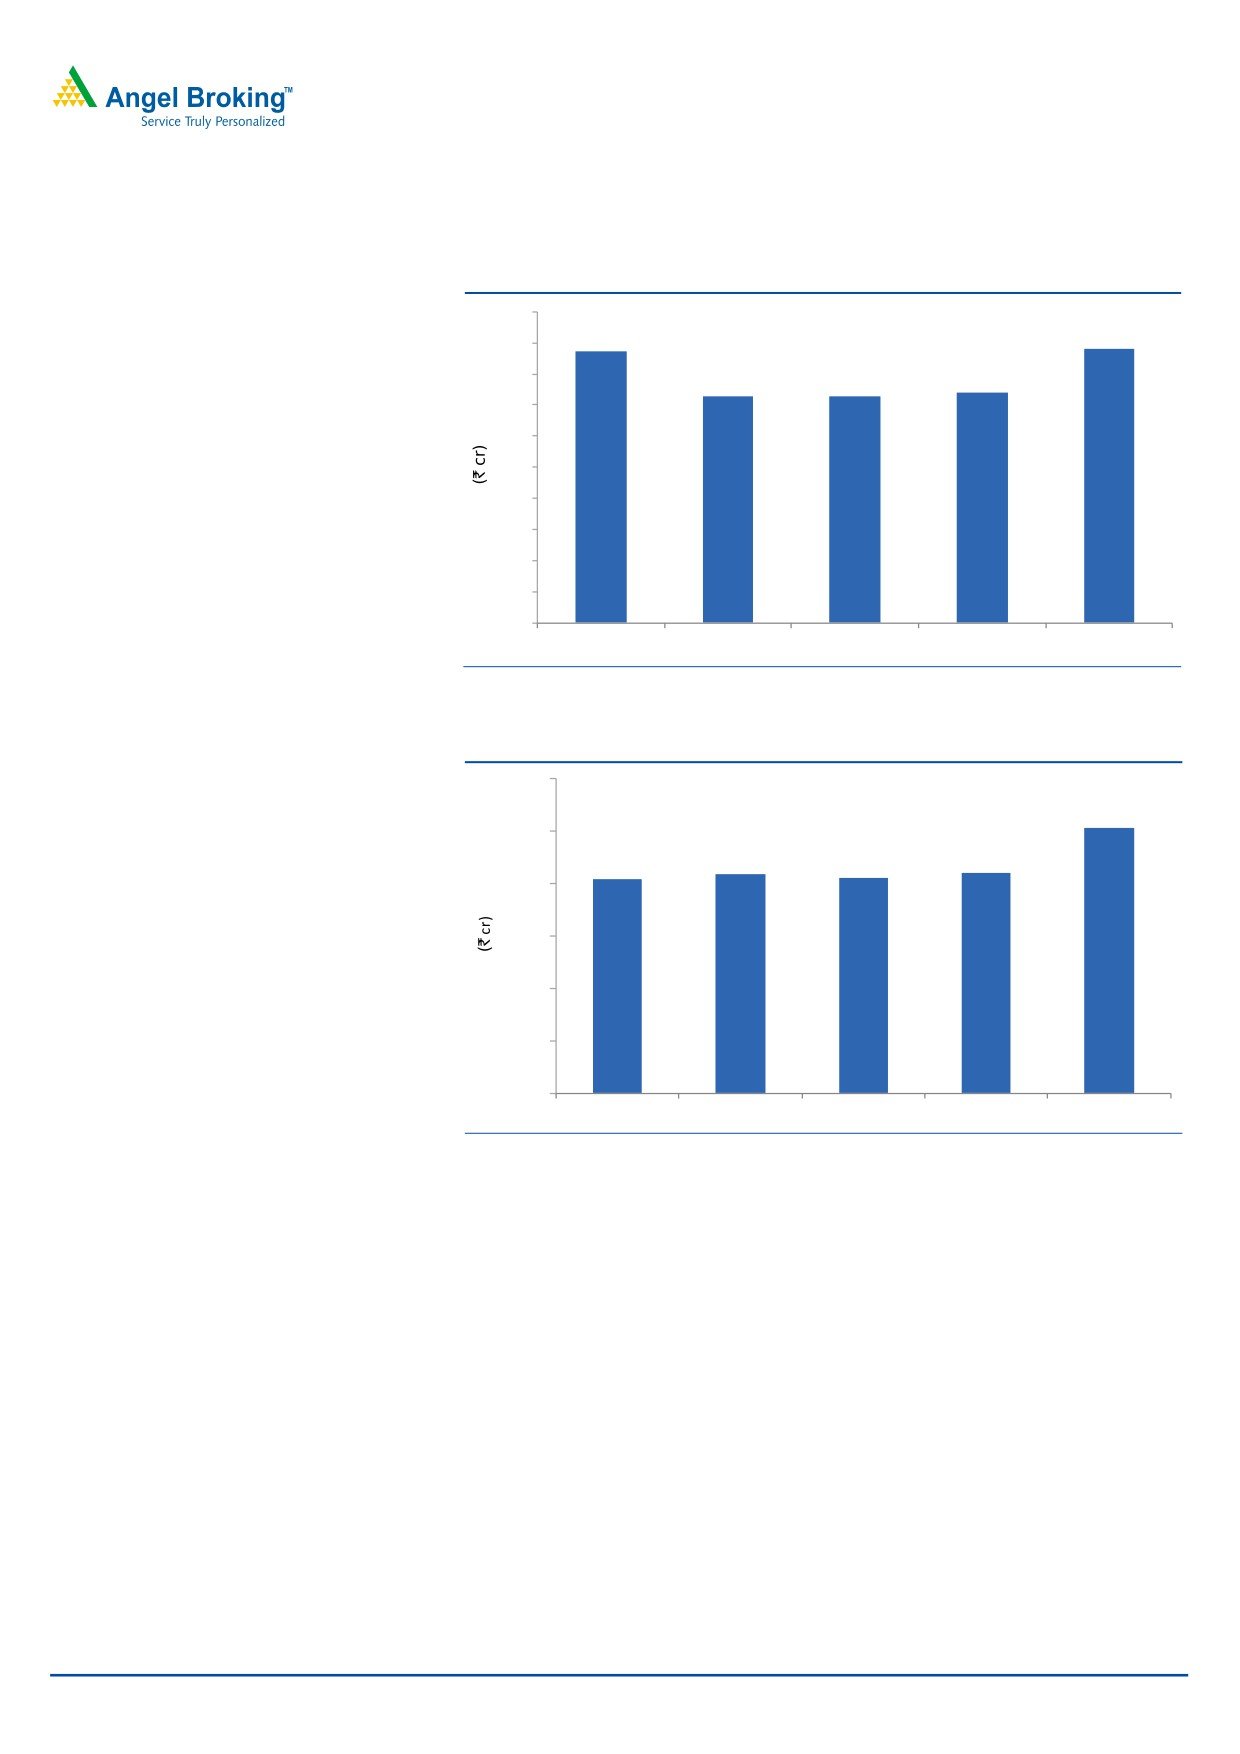
OPM lower than estimated: On the operating front, the EBITDA margin came in at
15.5% V/s 20.9% expected and V/s 20.6% in 2QFY2015, on back of lower than
expected sales and 28.3% yoy and 82.6% yoy rise in staff expenditure and R&D
expenditure respectively. The R&D expenditure during the quarter was 3.6% of
sales V/s 2.2% of sales in 2QFY2015.
November 9, 2015
3
Indoco Remedies | 2QFY2016 Result Update
Exhibit 5: OPM trend
25.0
20.6
18.3
18.4
20.0
16.3
15.5
15.0
10.0
5.0
0.0
2QFY2015
3QFY2015
4QFY2015
1QFY2016
2QFY2016
Source: Company, Angel Research
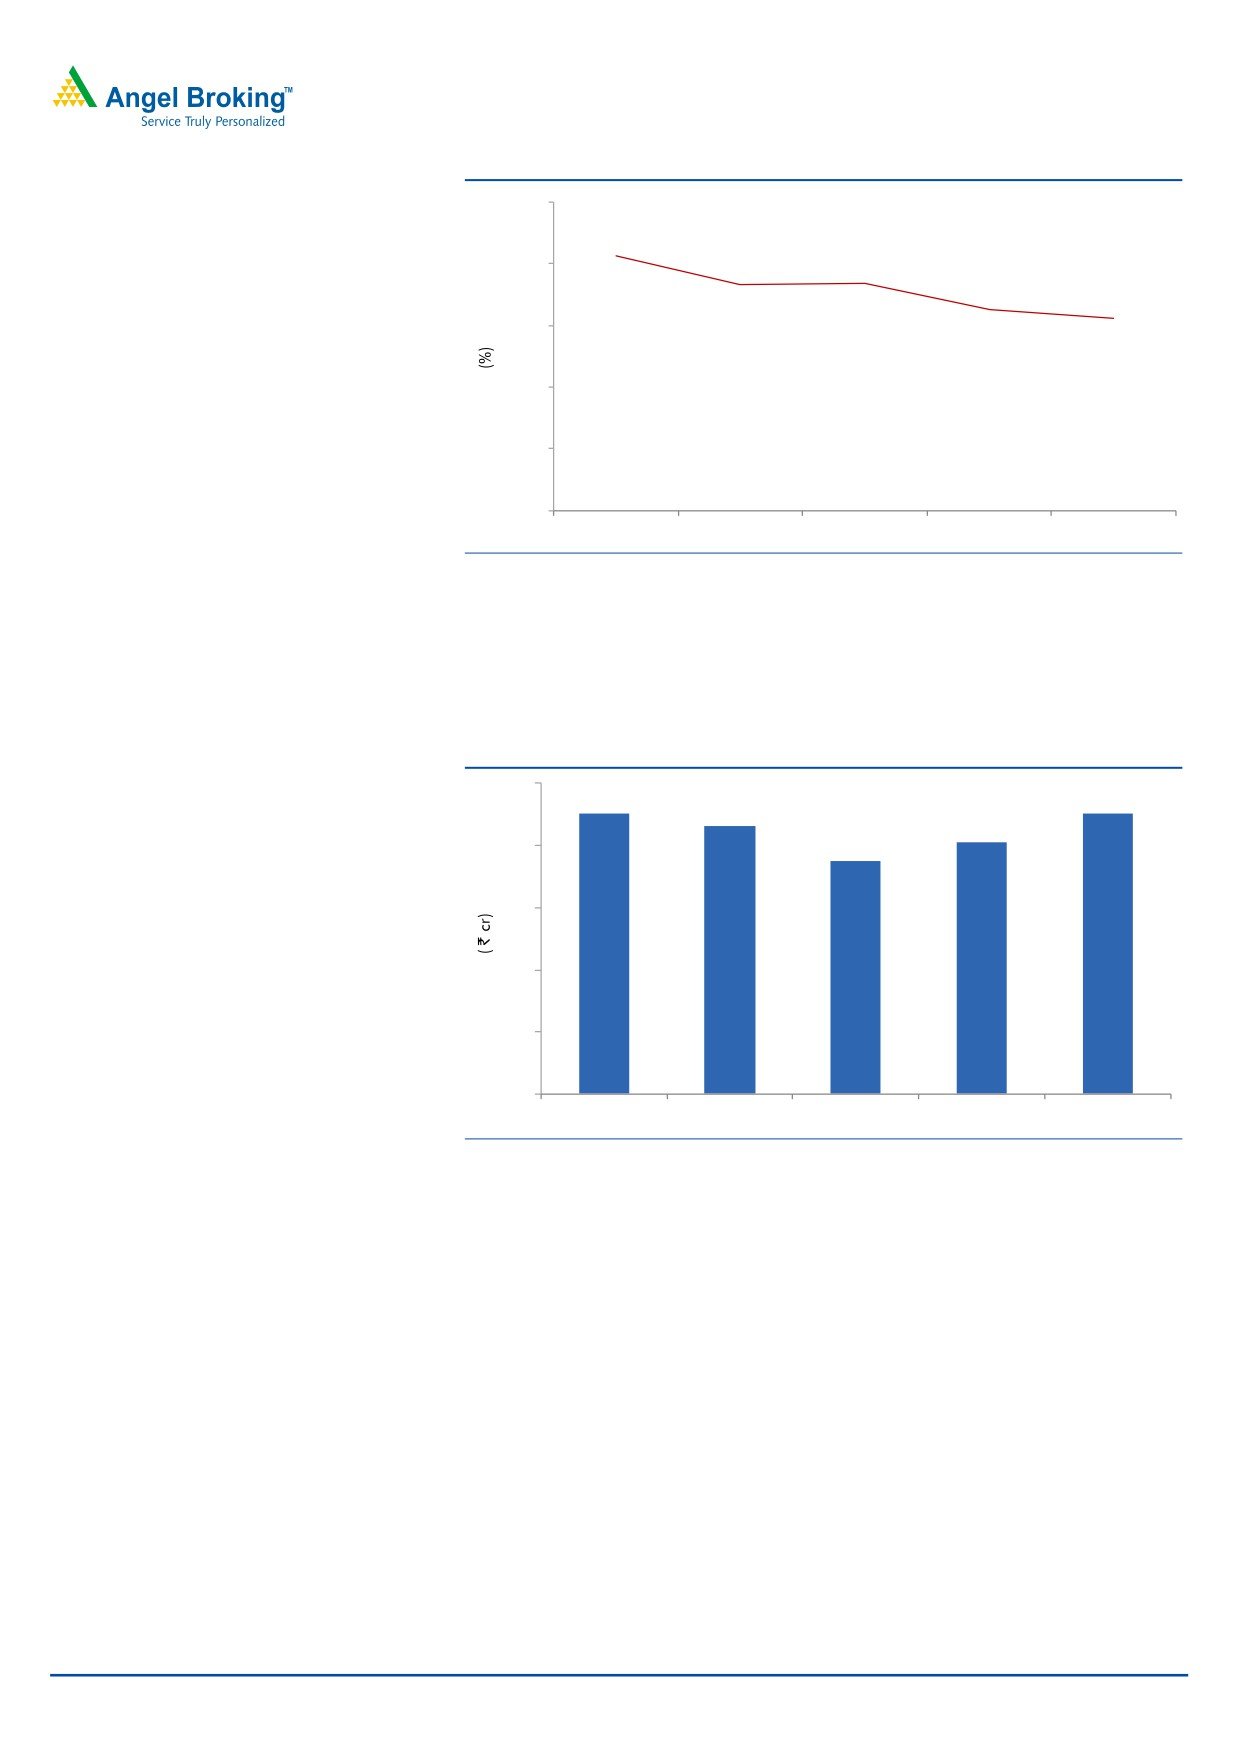
Net profit lower than expectation: Thus, the Adj. net profit came in at `22.6cr V/s
`33.4cr expected and V/s `22.4cr in 2QFY2015, a yoy growth of 0.9%. The lower
than expected net profit is on back of lower than expected sales and OPM.
Exhibit 6: Net profit trend
25
23
23
22
20
20
19
15
10
5
0
2QFY2015
3QFY2015
4QFY2015
1QFY2016
2QFY2016
Source: Company, Angel Research
November 9, 2015
4
Indoco Remedies | 2QFY2016 Result Update
Concall takeaways
During the quarter, the company successfully completed USFDA audit of its
Sterile Plant and Finished dosage Plant at Goa.
The company has re-structured some of its marketing divisions in domestic
markets with addition to the field force to accelerate growth and build on its
core strengths in the mass specialty segments.
Going forward, the company’s business from US and EU territory is expected
to grow speedily as ANDAs and Dossiers will be commercialized at regular
intervals.
While surging ahead in the regulated markets, Indoco is also consolidating its
position in the emerging markets through active brand promotion. Part of the
emerging market is exploited through distributors appointed by Indoco and
part through alliances.
Investment arguments
Focus on domestic formulations- Aiming for a higher-than-industry growth: Indoco
has a strong brand portfolio of 135 products and a base of ~2,300 MRs. It
operates in various
therapeutic
segments, including anti-infective,
anti-diabetic, CVS, ophthalmic, dental care, pain management and respiratory.
Prominent Indoco brands include Cyclopam, Vepan, Febrex Plus, ATM,
Sensodent-K and Sensoform. The company has seen strong growth across the
respiratory, anti-infective, ophthalmic and alimentary therapeutic segments.
Further, the company is investing to enhance the share of the chronic segment,
which constitutes 10% of overall sales.
Post the restructuring of the domestic business in FY2009, which has resulted in an
improvement in the working capital cycle, Indoco is back on the growth trajectory
with its domestic formulation business growing at 15.1% in FY2015. We expect the
domestic formulation segment to grow at a 9.3% CAGR over FY2015-17E, on
back of a muted FY2016, restructuring, and low monsoon.
Scaling-up on the exports front: Indoco has also started focusing on regulated
markets by entering into long-term supply contracts. The company is currently
executing several contract-manufacturing projects, and covering a number of
products for its clients in the UK, Germany and Slovenia. Indoco has received a
nod from the USFDA for two of its facilities in Goa.
Recently, the US health regulator has approved the sterile facility (plant-II) and
solid dosage facility (plant -III) located at Verna. The nod will facilitate the generic
approvals in the US market and subsequent product launches there will boost
revenues from the highly remunerative US market. With this, the number of Indoco
facilities having approval from the US regulator has gone up to 63 for finished
dosages, and 2 for APIs. The company derived ~39% of its revenues from exports
in 2014-15.
The development is positive for Indoco’s ophthalmic business, as it has filed
products from these facilities, and hence the approval opens up avenues for
high-margin, low-competition product sales in the US. In the last four years, the
company has filed ~15 ANDAs in the ophthalmic space and expects to secure
approval for ~5 products over FY2015-16E, addressing opportunities of US$1bn
brand sales. Thus, we estimate the company to garner around
`120cr of
November 9, 2015
5
Indoco Remedies | 2QFY2016 Result Update
sales in FY2016. We expect the exports segment to grow at a 35.6% CAGR over
FY2015-17E.
Partnering with pharmaceutical majors: The company has a large customer base
of small and medium sized generic companies across the globe and has major
tie-ups with generic companies for certain territories and products. The company
has a deal with Watson Pharmaceuticals to develop and manufacture a number of
sterile (ophthalmic) products for marketing in the USA. The agreement with South
Africa's largest pharmaceutical company, Aspen Pharmacare, encompasses a
number of solid dosages and ophthalmic products, extending to 30 emerging
market countries, while the contract signed with DSM, Austria, is for marketing 8 of
Indoco's APIs in various geographies. These deals have further strengthened
Indoco's image in the international arena.
Valuation: We expect the company to post a net sales CAGR of 19.6% to `1,199cr
and EPS to post a 23.0% CAGR to `13.6 over FY2015-17E. At the current market
price, the stock is trading at 32.4x and 22.4x its FY2016E and FY2017E earnings,
respectively. We recommend a Neutral rating on the stock, given the valuations.
Exhibit 7: Key assumptions
FY2016E
FY2017E
Domestic sales growth (%)
4.0
15.0
Exports growth
55.6
18.0
Operating margins (%)
15.9
18.2
Capex (` cr)
60.0
60.0
Source: Company, Angel Research
Exhibit 8: One-year forward PE band
450
400
350
300
250
200
150
100
50
0
20x
25x
30x
35x
Source: Company, Angel Research
November 9, 2015
6
Indoco Remedies | 2QFY2016 Result Update
Exhibit 9: Recommendation summary
Company
Reco
CMP Tgt. price Upside
FY2017E
FY15-17E
FY2017E
(`)
(`)
(%) PE (x) EV/Sales (x) EV/EBITDA (x) CAGR in EPS (%) RoCE (%) RoE (%)
Alembic Pharma
Neutral
675
-
-
28.3
4.0
20.0
26.2
31.5
31.8
Aurobindo Pharma Accumulate
820
872
6.3
18.8
3.0
13.2
16.3
23.4
30.2
Cadila Healthcare
Neutral
429
-
-
24.4
3.7
16.7
24.6
25.2
29.0
Cipla
Neutral
659
-
-
22.8
3.1
16.4
21.4
17.1
16.8
Dr Reddy's
Neutral
4,253
-
-
22.1
3.3
14.7
21.6
20.6
22.0
Dishman Pharma
Neutral
402
-
-
18.6
1.7
8.6
20.4
11.7
11.7
GSK Pharma*
Neutral
3,191
-
-
46.7
8.1
36.9
6.6
33.7
34.3
Indoco Remedies
Neutral
310
-
-
22.4
2.4
13.4
23.0
19.7
19.7
Ipca labs
Buy
733
900
22.7
26.2
2.6
14.0
26.1
13.0
14.9
Lupin
Neutral
1,838
-
-
25.8
4.4
16.5
9.7
27.9
23.4
Sanofi India*
Neutral
4,276
-
-
28.2
3.7
17.6
33.1
27.9
25.5
Sun Pharma
Buy
816
950
16.4
30.3
5.3
17.4
8.4
15.8
16.6
Source: Company, Angel Research; Note: *December year ending, Price as of November 6, 2015
November 9, 2015
7
Indoco Remedies | 2QFY2016 Result Update
Company Background
Indoco has a strong brand portfolio of 135 products and a base of 2,300 MRs.
The company operates in various therapeutic segments including anti-infective,
anti-diabetic, CVS, ophthalmic, dental care, pain management and respiratory
areas. Prominent Indoco brands include Cyclopam, Vepan, Febrex Plus, ATM,
Sensodent-K and Sensoform. The company’s top-10 brands contribute over 50%
of its domestic sales. Indoco now proposes to scale up its exports through higher
exposure to the regulated markets.
Profit & loss statement (Consolidated)
Y/E March (` cr)
FY2012
FY2013
FY2014
FY2015
FY2016E
FY2017E
Gross sales
576
638
735
863
1,043
1,211
Less: Excise duty
7
11
13
11
10
12
Net sales
569
626
722
852
1,033
1,199
Other operating income
2
4
10
5
5
5
Total operating income
571
630
733
857
1,038
1,204
% chg
17.4
10.4
16.2
17.0
21.0
16.0
Total expenditure
484
537
612
691
868
981
Net raw materials
245
262
272
300
382
443
Other mfg costs
39
37
42
50
60
70
Personnel
82
100
130
140
185
215
Other
119
138
168
201
241
253
EBITDA
85
89
110
161
164
218
% chg
31.2
5.4
23.5
46.1
2.3
32.3
(% of Net Sales)
14.9
14.2
15.2
18.9
15.9
18.2
Depreciation& amortisation
19
24
31
47
52
57
EBIT
65
65
79
114
112
160
% chg
28.1
0.1
21.0
43.7
(1.2)
42.9
(% of Net Sales)
11.5
10.4
11.0
13.3
10.9
13.4
Interest & other charges
16
22
19
11
11
11
Other income
-
1
2
2
2
2
(% of PBT)
0.0
1.8
2.4
1.6
1.6
1.1
Share in profit of Associates
-
-
-
-
1.0
2.0
Recurring PBT
51
48
72
110
109
157
PBT (reported)
51
48
72
110
109
157
Tax
5
6
14
27
22
31
(% of PBT)
9.6
11.8
19.6
24.3
20.0
20.0
PAT (reported)
46
43
58
83
87
125
Add: Share of earnings of asso.
-
-
-
-
-
-
Less: Minority interest (MI)
-
-
-
-
-
-
Prior period items
-
-
-
-
-
-
PAT after MI (reported)
46
43
58
83
87
125
ADJ. PAT
46
43
58
83
87
125
% chg
(9.2)
(7.9)
36.5
42.3
4.9
44.4
(% of Net Sales)
8.1
6.8
8.1
9.7
8.4
10.5
Basic EPS (`)
5.0
4.6
6.3
9.0
9.4
13.6
Fully Diluted EPS (`)
5.0
4.6
6.3
9.0
9.4
13.6
% chg
(9.2)
(7.9)
36.5
42.3
4.9
44.4
November 9, 2015
8
Indoco Remedies | 2QFY2016 Result Update
Balance Sheet (Consolidated)
Y/E March (` cr)
FY2012
FY2013
FY2014
FY2015
FY2016E
FY2017E
SOURCES OF FUNDS
Equity share capital
12
18
18
18
18
18
Reserves & surplus
372
396
439
500
566
669
Shareholders funds
385
414
457
519
584
688
Minority Interest
-
0
-
-
-
-
Total loans
114
90
72
88
181
120
Other Long Term Liab.
9
9
9
9
9
9
Long Term Provisions
5
7
16
16
16
16
Deferred tax liability
29
35
31
27
27
27
Total liabilities
542
555
585
659
792
835
APPLICATION OF FUNDS
Gross block
404
447
481
561
621
681
Less: acc. depreciation
102
126
156
203
255
312
Net block
302
321
325
358
366
369
Capital work-in-progress
33
38
44
44
44
44
Goodwill
-
0
-
0
0
0
Investments
0
0
0
0
0
0
Long Term Loans And Adv.
55
57
55
58
101
117
Current assets
267
273
305
385
535
600
Cash
10
12
13
15
32
16
Loans & advances
38
41
42
85
103
120
Other
219
220
249
285
400
464
Current liabilities
114
134
144
187
255
296
Net current assets
152
139
160
199
280
304
Mis. Exp. not written off
0
0
-
-
-
-
Total assets
542
555
585
659
792
835
November 9, 2015
9
Indoco Remedies | 2QFY2016 Result Update
Cash Flow Statement (Consolidated)
Y/E March (` cr)
FY2012
FY2013
FY2014
FY2015
FY2016E FY2017E
Profit before tax
51
48
72
110
109
157
Depreciation
19
24
31
47
52
57
(Inc)/Dec in working capital
(28)
13
(18)
(39)
(109)
(56)
Less: Other income
-
1
2
2
2
2
Direct taxes paid
1
6
14
27
22
31
Cash Flow from Operations
41
79
69
90
29
125
(Inc.)/Dec.in fixed assets
(84)
(49)
(41)
(80)
(60)
(60)
(Inc.)/Dec. in investments
0
-
-
-
-
-
Other income
-
1
2
2
2
2
Cash Flow from Investing
(84)
(48)
(39)
(78)
(58)
(58)
Issue of equity
-
-
-
-
-
-
Inc./(Dec.) in loans
39
(22)
(9)
16
93
(61)
Dividend Paid (Incl. Tax)
(12)
(12)
(12)
(22)
(22)
(22)
Others
14
3
(16)
(3)
(15)
9
Cash Flow from Financing
41
(30)
(37)
(9)
56
(74)
Inc./(Dec.) in Cash
(2)
1
(7)
3
26
(7)
Opening Cash balances
27
10
12
13
15
32
Closing Cash balances
10
12
13
15
32
16
November 9, 2015
10
Indoco Remedies | 2QFY2016 Result Update
Key Ratios
Y/E March
FY2012
FY2013
FY2014
FY2015
FY2016E
FY2017E
Valuation Ratio (x)
P/E (on FDEPS)
60.6
65.9
48.3
33.9
32.4
22.4
P/CEPS
42.8
42.3
31.5
21.6
20.2
15.4
P/BV
7.3
6.8
6.1
5.4
4.8
4.1
Dividend yield (%)
0.2
0.4
0.4
0.4
0.4
0.4
EV/Sales
5.1
4.6
4.0
3.4
2.9
2.4
EV/EBITDA
34.5
32.4
26.1
17.9
18.0
13.4
EV / Total Assets
5.4
5.2
4.9
4.4
3.7
3.5
Per Share Data (`)
EPS (Basic)
5.0
4.6
6.3
9.0
9.4
13.6
EPS (fully diluted)
5.0
4.6
6.3
9.0
9.4
13.6
Cash EPS
7.1
7.2
9.7
14.1
15.1
19.8
DPS
0.7
1.1
1.1
1.1
1.1
1.1
Book Value
41.8
44.9
49.6
56.3
63.4
74.6
Dupont Analysis
EBIT margin
11.5
10.4
11.0
13.3
10.9
13.4
Tax retention ratio
90.4
88.2
80.4
75.7
80.0
80.0
Asset turnover (x)
1.2
1.2
1.3
1.4
1.5
1.5
ROIC (Post-tax)
12.2
10.8
11.6
14.2
12.9
16.3
Cost of Debt (Post Tax)
15.5
18.9
18.7
10.0
6.3
5.6
Leverage (x)
0.2
0.2
0.2
0.1
0.2
0.2
Operating ROE
11.6
8.9
10.4
14.8
14.2
18.5
Returns (%)
ROCE (Pre-tax)
13.0
11.9
13.9
18.3
15.5
19.7
Angel ROIC (Pre-tax)
14.8
13.0
15.3
20.2
17.1
21.5
ROE
12.6
10.7
13.4
17.0
15.7
19.7
Turnover ratios (x)
Asset Turnover (Gross Block)
1.6
1.5
1.6
1.6
1.8
1.8
Inventory / Sales (days)
56
52
50
55
62
60
Receivables (days)
71
66
64
62
79
76
Payables (days)
47
43
40
46
50
52
WC cycle (ex-cash) (days)
78
78
68
70
76
81
Solvency ratios (x)
Net debt to equity
0.3
0.2
0.1
0.1
0.3
0.2
Net debt to EBITDA
1.2
0.9
0.5
0.5
0.9
0.5
Interest Coverage (EBIT / Int.)
4.0
3.0
4.2
10.7
10.6
15.2
November 9, 2015
11
Indoco Remedies | 2QFY2016 Result Update
Research Team Tel: 022 - 39357800
DISCLAIMER
Angel Broking Private Limited (hereinafter referred to as “Angel”) is a registered Member of National Stock Exchange of India Limited,
Bombay Stock Exchange Limited and Metropolitan Stock Exchange of India Limited. It is also registered as a Depository Participant with
CDSL and Portfolio Manager with SEBI. It also has registration with AMFI as a Mutual Fund Distributor. Angel Broking Private Limited is
a registered entity with SEBI for Research Analyst in terms of SEBI (Research Analyst) Regulations, 2014 vide registration number
INH000000164. Angel or its associates has not been debarred/ suspended by SEBI or any other regulatory authority for accessing
/dealing in securities Market. Angel or its associates including its relatives/analyst do not hold any financial interest/beneficial
ownership of more than 1% in the company covered by Analyst. Angel or its associates/analyst has not received any compensation /
managed or co-managed public offering of securities of the company covered by Analyst during the past twelve months. Angel/analyst
has not served as an officer, director or employee of company covered by Analyst and has not been engaged in market making activity
of the company covered by Analyst.
This document is solely for the personal information of the recipient, and must not be singularly used as the basis of any investment
decision. Nothing in this document should be construed as investment or financial advice. Each recipient of this document should
make such investigations as they deem necessary to arrive at an independent evaluation of an investment in the securities of the
companies referred to in this document (including the merits and risks involved), and should consult their own advisors to determine
the merits and risks of such an investment.
Reports based on technical and derivative analysis center on studying charts of a stock's price movement, outstanding positions and
trading volume, as opposed to focusing on a company's fundamentals and, as such, may not match with a report on a company's
fundamentals.
The information in this document has been printed on the basis of publicly available information, internal data and other reliable
sources believed to be true, but we do not represent that it is accurate or complete and it should not be relied on as such, as this
document is for general guidance only. Angel Broking Pvt. Limited or any of its affiliates/ group companies shall not be in any way
responsible for any loss or damage that may arise to any person from any inadvertent error in the information contained in this report.
Angel Broking Pvt. Limited has not independently verified all the information contained within this document. Accordingly, we cannot
testify, nor make any representation or warranty, express or implied, to the accuracy, contents or data contained within this document.
While Angel Broking Pvt. Limited endeavors to update on a reasonable basis the information discussed in this material, there may be
regulatory, compliance, or other reasons that prevent us from doing so.
This document is being supplied to you solely for your information, and its contents, information or data may not be reproduced,
redistributed or passed on, directly or indirectly.
Neither Angel Broking Pvt. Limited, nor its directors, employees or affiliates shall be liable for any loss or damage that may arise from
or in connection with the use of this information.
Note: Please refer to the important ‘Stock Holding Disclosure' report on the Angel website (Research Section). Also, please refer to the
latest update on respective stocks for the disclosure status in respect of those stocks. Angel Broking Pvt. Limited and its affiliates may
have investment positions in the stocks recommended in this report.
Disclosure of Interest Statement
Indoco Remedies
1. Analyst ownership of the stock
No
2. Angel and its Group companies ownership of the stock
No
3. Angel and its Group companies' Directors ownership of the stock
No
4. Broking relationship with company covered
No
Note: We have not considered any Exposure below ` 1 lakh for Angel, its Group companies and Directors
Ratings (Based on expected returns
Buy (> 15%)
Accumulate (5% to 15%)
Neutral (-5 to 5%)
over 12 months investment period):
Reduce (-5% to -15%)
Sell (< -15)
November 9, 2015
12