4QFY2016 Result Update | FMCG
May 23, 2016
ITC
BUY
CMP
`330
Performance Highlights
Target Price
`380
Quarterly result (Standalone)
Investment Period
12 Months
(` cr)
4QFY16
4QFY15
% chg
3QFY16
% qoq
Revenue
10,169
9,293
9.4
9,177
10.8
Stock Info
Sector
FMCG
EBITDA
3,687
3,243
13.7
3,605
2.3
Market Cap (` cr)
2,65,518
OPM (%)
36.3
34.9
136bp
39.3
(303bp)
Net Debt (` cr)
-15,928
PAT
2,495
2,361
5.7
2,653
(5.9)
Beta
0.8
Source: Company, Angel Research
52 Week High / Low
360/268
ITC posted a healthy set of numbers for 4QFY2016, both on the top-line and the
Avg. Daily Volume
6,90,195
bottom-line front. The top-line was strong due to higher growth in Cigarettes &
Face Value (`)
1
Agri businesses; however, higher taxes slightly dragged down the overall
BSE Sensex
25,302
profitability of the company.
Nifty
7,750
Reuters Code
ITC.BO
Key highlights: ITC’s net sales for the quarter grew by 9.4% yoy to `10,169cr. The
Bloomberg Code
ITC@IN
Cigarettes business posted a 10.2% yoy growth in net sales to `4,639cr, aided by
price hikes, which enabled an 11.5% yoy growth in the segment’s EBIT. The
FMCG (Others) business posted a 5.4% yoy growth in net sales to `2,704cr, and
Shareholding Pattern (%)
an EBIT level profit of `71cr. Further, the Paperboards and Packaging division
Promoters
0.0
posted a growth of 3.0% yoy and 6.5% yoy in revenue and EBIT, respectively. The
MF / Banks / Indian Fls
38.7
Hotels business posted a 4.8% yoy growth in its top-line, while it reported a flat
FII / NRIs / OCBs
51.2
growth at the EBIT level. The Agri business posted a strong growth of 26.5% yoy
Indian Public / Others
10.1
in revenue, while its EBIT grew by 6.1% on a yoy basis. Overall, the company’s
OPM expanded by 136bp yoy to 36.3%, owing to reduction in overall operating
Abs. (%)
3m
1yr
3yr
expenses.
Sensex
6.7
(9.1)
25.8
Outlook and valuation: We expect ITC to report a top-line and bottom-line CAGR
ITC
8.2
(0.8)
6.9
of 8.3% and 9.3% respectively over FY2016-18E. At the current market price, the
stock is trading at 22.6x FY2018E EPS. We recommend a Buy on the stock with a
3-year price chart
target price of `380.
410
390
Key financials (Standalone)
370
Y/E March (` cr)
FY2015
FY2016E
FY2017E
FY2018E
350
330
Net Sales
36,507
36,837
39,726
43,194
310
% chg
9.8
0.9
7.8
8.7
290
270
Net Profit (Adj)
9,608
9,845
10,844
11,754
250
% chg
9.4
2.5
10.2
8.4
EBITDA (%)
36.9
38.7
38.8
38.8
Source: Company, Angel Research
EPS (`)
11.9
12.2
13.5
14.6
P/E (x)
27.6
27.0
24.5
22.6
P/BV (x)
8.7
7.5
6.6
5.8
RoE (%)
31.3
27.8
26.9
25.7
RoCE (%)
40.6
37.3
35.4
33.8
Amarjeet S Maurya
EV/Sales (x)
6.8
6.7
6.2
5.6
022 - 3935 7800 Ext: 6831
EV/EBITDA (x)
18.5
17.3
15.9
14.6
Source: Company, Angel Research; Note: CMP as of May 20, 2016
Please refer to important disclosures at the end of this report
1
ITC | 4QFY2016 Result Update
Exhibit 1: Quarterly performance (Standalone)
Y/E March (` cr)
4QFY16
4QFY15
% yoy
3QFY16
%qoq
FY2016
FY2015
% chg
Net Sales
10,169
9,293
9.4
9,177
10.8
36,837
36,507
0.9
Consumption of RM
3,980
3,662
8.7
3,336
19.3
13,703
14,672
(6.6)
(% of Sales)
39.14
39.40
36.35
37.2
40.2
Staff Costs
465
454
2.4
450
3.5
1,884
1,780
5.8
(% of Sales)
4.6
4.9
4.9
5.1
4.9
Other Expenses
2,037
1,934
5.3
1,786
14.0
7,013
6,582
6.5
(% of Sales)
20.0
20.8
19.5
19.0
18.0
Total Expenditure
6,482
6,050
7.1
5,572
16.3
22,599
23,034
(1.9)
Operating Profit
3,687
3,243
13.7
3,605
2.3
14,238
13,474
5.7
OPM
36.3
34.9
136
39.3
(303)
38.7
36.9
174.5
Interest
12
16
(20.9)
16
(23.7)
49
57
(14.4)
Depreciation & Amortization
255
250
2.1
263
(2.9)
1,034
962
7.6
Other Income
412
370
11.1
678
(39.3)
1,804
1,543
16.9
PBT (excl. Extraordinary Items)
3,832
3,348
14.4
4,004
(4.3)
14,958
13,998
6.9
Extraordinary Income/(Expense)
-
-
-
-
PBT (incl. Extraordinary Items)
3,832
3,348
14.4
4,004
(4.3)
14,958
13,998
6.9
(% of Sales)
37.7
36.0
43.6
40.6
38.3
Provision for Taxation
1,336
987
35.4
1,352
(1.1)
5,114
4,390
16.5
(% of PBT)
34.9
29.5
33.8
34.2
31.4
Reported PAT
2,495
2,361
5.7
2,653
(5.9)
9,845
9,608
2.5
PATM
25
25
29
27
26
EPS (`)
3.1
2.9
5.7
3.3
(5.9)
12.3
12.0
2.5
Source: Company, Angel Research
May 23, 2016
2
ITC | 4QFY2016 Result Update
Top-line remains healthy
ITC’s net sales for the quarter grew by 9.4% yoy to `10,169cr. The Cigarettes
business posted a 10.2% yoy growth in net sales to `4,639cr, aided by price hikes,
which enabled an 11.5% yoy growth in the segment’s EBIT. The FMCG (Others)
business posted a 5.4% yoy growth in net sales to `2,704cr, and an EBIT level
profit of `71cr. Further, the Paperboards and Packaging division posted a growth
of 3.0% yoy and 6.5% yoy in revenue and EBIT, respectively. The Hotels business
posted a 4.8% yoy growth in its top-line, while it reported a flat growth at the EBIT
level. The Agri business posted a strong growth of 26.5% yoy in revenue, while its
EBIT grew by 6.1% on a yoy basis.
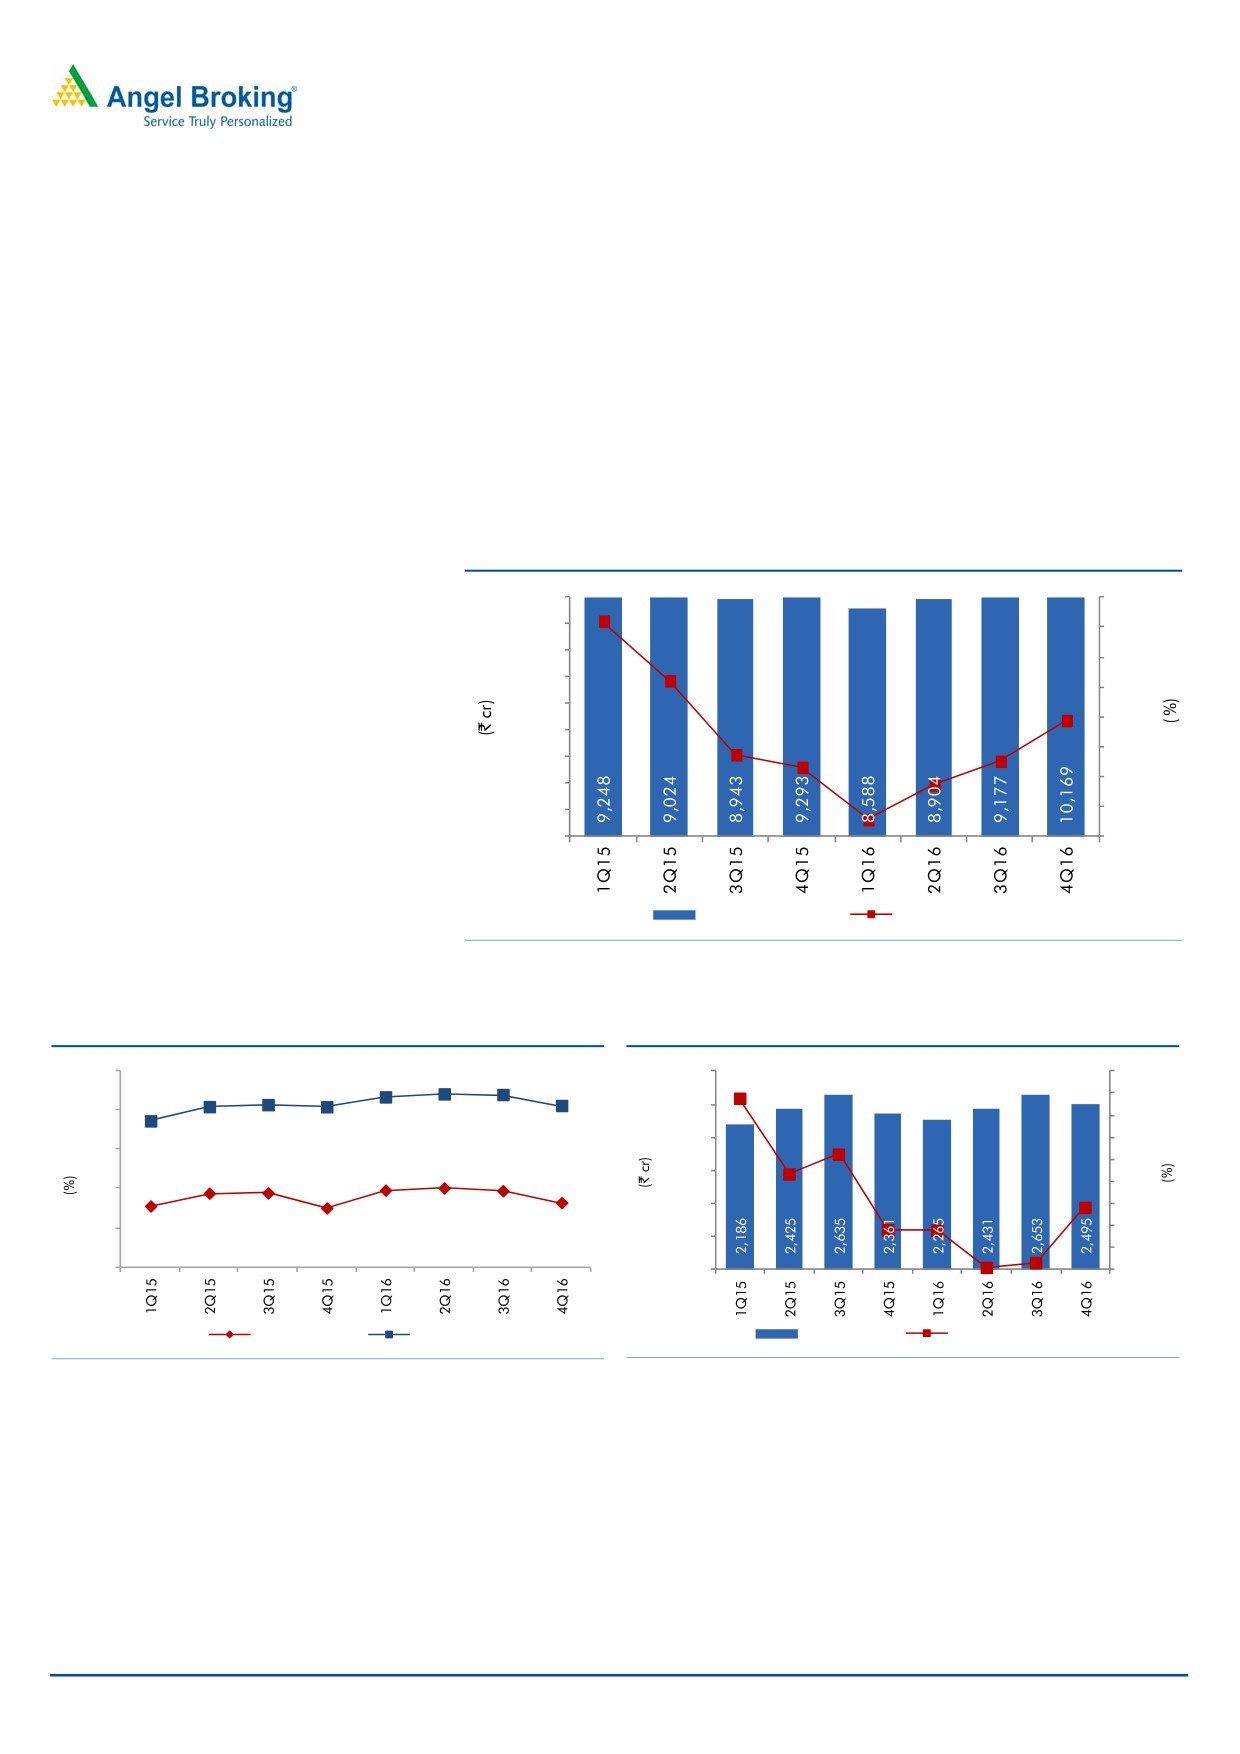
Exhibit 2: Top-line grows 9.4% yoy
9,000
30.0
8,000
25.0
7,000
20.0
6,000
15.0
5,000
10.0
4,000
5.0
3,000
-
2,000
1,000
(5.0)
-
(10.0)
Top-line (LHS)
yoy growth (RHS)
Source: Company, Angel Research
Exhibit 3: OPM increases by 136bp yoy to 36.3%
Exhibit 4: Earnings grow 5.7% yoy
70
63.1
63.9
63.7
3,000
15.6
18.0
60.6
61.1
60.6
60.9
57
16.0
2,500
60
14.0
10.5
2,000
5.7
12.0
50
8.7
10.0
38.7
38.7
39.4
40.0
39.3
1,500
35.4
34.9
36.3
8.0
40
3.6
0.3
3.7
0.7
1,000
6.0
30
4.0
500
2.0
20
-
-
OPM
Gross margin
PAT (LHS)
yoy growth (RHS)
Source: Company, Angel Research
Source: Company, Angel Research
Operating profit up 13.7% yoy
The company reported an operating profit of `3,687cr for 4QFY2016, up
13.7% yoy. Further, the company’s OPM expanded by 136bp yoy to 36.3%, owing
to reduction in overall operating expenses.
May 23, 2016
3
ITC | 4QFY2016 Result Update
Exhibit 5: Segment-wise performance (Standalone)
Y/E Mar (` cr)
4QFY16
4QFY15
% yoy 3QFY16
% qoq FY2016 FY2015
% chg
Net Income
Cigarettes
4639
4211
10.2
4380
5.9
17486
16805
4.1
Others
2704
2567
5.4
2478
9.1
9704
9011
7.7
Hotels
363
346
4.8
345
5.1
1286
1187
8.4
Agri Business
1806
1428
26.5
1481
22.0
7457
8380
(11.0)
Paperboards & Packaging
1238
1203
3.0
1260
(1.7)
5017
4974
0.9
PBIT
Cigarettes
3019
2706
11.5
2984
1.2
11752
11196
5.0
Others
71
49
46.0
19
277.8
71
34
106.9
Hotels
43
42
1.5
26
65.1
56
49
13.5
Agri Business
174
164
6.1
231
(24.6)
934
904
3.3
Paperboards & Packaging
203
191
6.5
241
(15.8)
908
921
(1.5)
PBIT Margin (%)
Cigarettes
65.1
64.3
68.1
67.2
66.6
Others
2.6
1.9
0.8
0.7
0.4
Hotels
11.8
12.1
7.5
4.3
4.1
Agri Business
9.7
11.5
15.6
12.5
10.8
Paperboards & Packaging
16.4
15.8
19.1
18.1
18.5
Source: Company, Angel Research
May 23, 2016
4
ITC | 4QFY2016 Result Update
Investment rationale
Cigarettes business to enjoy strong pricing power: We believe ITC’s cigarettes
business is well poised to continue to post a healthy profit growth over
FY2016-18E due to its strong pricing power and improvement in volume
growth.
Non-cigarettes businesses to register healthy growth over FY2016-18E: While
cigarettes remain the main profit center for the company, investments in
the non-cigarettes businesses such as FMCG, Hotels and Paperboards have
given the company a foothold in the respective businesses. We expect these
businesses to play a major role in driving the company’s long-term growth.
Outlook and valuation
We expect ITC to report a top-line and bottom-line CAGR of 8.3% and 9.3%
respectively over FY2016-18E. At the current market price, the stock is trading at
22.6x FY2018E EPS. We recommend a Buy on the stock with a target price of
`380.
Company Background
ITC is a diversified conglomerate, present across various categories - Cigarettes
(41% of revenue); Hotels (3% of revenue); Paperboards and Packaging (13% of
revenue); Agri-business (22% of revenue); and other FMCG (branded apparel,
personal care, stationery, safety matches and specialty papers [21% of revenue])
businesses. Although ITC is a market leader in the cigarettes category, it is rapidly
gaining market share even in its evolving businesses of packaged foods and
confectionery, branded apparel, personal care and stationery.
May 23, 2016
5
ITC | 4QFY2016 Result Update
Profit and loss statement (Standalone)
Y/E March (` cr)
FY13
FY14
FY15
FY16E
FY17E
FY18E
Total operating income
29,901
33,239
36,507
36,837
39,726
43,194
% chg
18.9
11.2
9.8
0.9
7.8
8.7
Total Expenditure
19,274
20,784
23,034
22,599
24,312
26,435
Cost of Materials
12,066
13,156
14,672
13,703
14,619
15,766
Personnel
1,387
1,608
1,780
1,884
2,066
2,289
Others
5,821
6,019
6,582
7,013
7,627
8,380
EBITDA
10,628
12,455
13,474
14,238
15,414
16,759
% chg
20.1
17.2
8.2
5.7
8.3
8.7
(% of Net Sales)
35.5
37.5
36.9
38.7
38.8
38.8
Depreciation& Amortisation
796
900
962
1,034
1,123
1,256
EBIT
9,832
11,555
12,512
13,204
14,290
15,503
% chg
20.6
17.5
8.3
5.5
8.2
8.5
(% of Net Sales)
32.9
34.8
34.3
35.8
36.0
35.9
Interest & other Charges
86
3
57
49
55
60
Other Income
939
1,107
1,543
1,804
1,950
2,100
(% of PBT)
8.8
8.7
11.0
12.1
12.0
12.0
Share in profit of Associates
-
-
-
-
-
-
Recurring PBT
10,684
12,659
13,998
14,958
16,185
17,543
% chg
20.1
18.5
10.6
6.9
8.2
8.4
Extraordinary Expense/(Inc.)
-
-
-
-
-
-
PBT (reported)
10,684
12,659
13,998
14,958
16,185
17,543
Tax
3,266
3,874
4,390
5,114
5,341
5,789
(% of PBT)
30.6
30.6
31.4
34.2
33.0
33.0
PAT (reported)
7,418
8,785
9,608
9,845
10,844
11,754
Add: Share of associates
-
-
-
-
-
-
ADJ. PAT
7,418
8,785
9,608
9,845
10,844
11,754
% chg
20.4
18.4
9.4
2.5
10.2
8.4
(% of Net Sales)
24.8
26.4
26.3
26.7
27.3
27.2
Basic EPS (`)
9.2
10.9
11.9
12.2
13.5
14.6
Fully Diluted EPS (`)
9.2
10.9
11.9
12.2
13.5
14.6
% chg
20.4
18.4
9.4
2.5
10.2
8.4
May 23, 2016
6
ITC | 4QFY2016 Result Update
Balance Sheet (Standalone)
Y/E March (` cr)
FY13
FY14
FY15
FY16E FY17E FY18E
SOURCES OF FUNDS
Equity Share Capital
790
795
802
805
805
805
Reserves& Surplus
21,498
25,467
29,934
34,561
39,550
44,956
Shareholders Funds
22,288
26,262
30,736
35,366
40,354
45,761
Minority Interest
-
-
-
-
-
-
Total Loans
78
67
53
29
35
40
Deferred Tax Liability
1,706
1,741
2,099
2,099
2,099
2,099
Total Liabilities
24,072
28,070
32,888
37,495
42,489
47,900
APPLICATION OF FUNDS
Gross Block
16,944
18,545
21,727
25,140
28,641
32,143
Less: Acc. Depreciation
5,735
6,532
7,548
8,583
9,706
10,963
Net Block
11,209
12,013
14,178
16,557
18,935
21,181
Capital Work-in-Progress
1,488
2,296
2,114
2,114
2,114
2,114
Investments
7,060
8,823
8,405
12,854
12,854
12,854
Current Assets
14,260
16,097
19,498
19,735
22,316
26,273
Inventories
6,600
7,360
7,837
7,872
8,707
9,704
Sundry Debtors
1,163
2,165
1,722
1,615
1,524
1,657
Cash
3,615
3,289
7,589
6,565
7,716
8,865
Loans & Advances
1,154
1,803
843
1,842
2,384
3,024
Other
1,728
1,480
1,506
1,842
1,986
3,024
Current liabilities
10,448
11,604
11,775
14,234
14,199
14,989
Net Current Assets
3,812
4,494
7,722
5,501
8,117
11,284
Deferred Tax Asset
503
445
468
468
468
468
Mis. Exp. not written off
-
-
-
-
-
-
Total Assets
24,072
28,070
32,888
37,495
42,489
47,900
May 23, 2016
7
ITC | 4QFY2016 Result Update
Cash flow statement (Standalone)
Y/E March (` cr)
FY13
FY14
FY15
FY16E FY17E FY18E
Profit before tax
10,684
12,659
13,998
14,958
16,185
17,543
Depreciation
796
900
962
1,034
1,123
1,256
Change in Working Capital
(1,049)
(1,732)
30
1,280
(1,465)
(2,017)
Interest / Dividend (Net)
(580)
(767)
(1,131)
49
55
60
Direct taxes paid
(2,886)
(3,797)
(4,226)
(5,114)
(5,341)
(5,789)
Others
(255)
(300)
(324)
-
-
-
Cash Flow from Operations
6,710
6,962
9,309
12,208
10,557
11,054
(Inc.)/ Dec. in Fixed Assets
(4,324)
(4,586)
(4,402)
(12,398)
(3,501)
(3,502)
(Inc.)/ Dec. in Investments
(744)
(1,763)
418
(4,449)
-
-
Cash Flow from Investing
(3,581)
(2,823)
(4,820)
(7,949)
(3,501)
(3,502)
Issue of Equity
922
691
979
3
-
-
Inc./(Dec.) in loans
(10)
(11)
(15)
(24)
6
5
Dividend Paid (Incl. Tax)
(3,518)
(4,148)
(4,772)
(5,218)
(5,856)
(6,347)
Interest / Dividend (Net)
273
(996)
3,619
(45)
(55)
(60)
Cash Flow from Financing
(2,333)
(4,465)
(190)
(5,284)
(5,905)
(6,402)
Inc./(Dec.) in Cash
796
(326)
4,299
(1,024)
1,151
1,149
Opening Cash balances
2,819
3,615
3,289
7,589
6,565
7,716
Closing Cash balances
3,615
3,289
7,589
6,565
7,716
8,865
May 23, 2016
8
ITC | 4QFY2016 Result Update
Key ratios
Y/E March
FY13
FY14
FY15
FY16E
FY17E
FY18E
Valuation Ratio (x)
P/E (on FDEPS)
35.8
30.2
27.6
27.0
24.5
22.6
P/CEPS
32.3
27.4
25.1
24.4
22.2
20.4
P/BV
11.9
10.1
8.7
7.5
6.6
5.8
Dividend yield (%)
1.6
1.8
1.9
2.0
2.2
2.4
EV/Sales
8.5
7.6
6.8
6.7
6.2
5.6
EV/EBITDA
24.0
20.4
18.5
17.3
15.9
14.6
EV / Total Assets
7.4
6.4
5.6
4.8
4.3
3.9
Per Share Data (`)
EPS (Basic)
9.2
10.9
11.9
12.2
13.5
14.6
EPS (fully diluted)
9.2
10.9
11.9
12.2
13.5
14.6
Cash EPS
10.2
12.0
13.1
13.5
14.9
16.2
DPS
5.3
6.0
6.2
6.5
7.3
7.9
Book Value
27.6
32.6
38.1
43.9
50.1
56.8
Returns (%)
RoCE
44.0
43.9
40.6
37.3
35.4
33.8
Angel RoIC (Pre-tax)
84.1
81.3
84.6
82.6
72.1
64.4
RoE
33.3
33.5
31.3
27.8
26.9
25.7
Turnover ratios (x)
Asset Turnover
1.8
1.8
1.7
1.5
1.4
1.3
Inventory / Sales (days)
81
81
78
78
80
82
Receivables (days)
14
24
17
16
14
14
Payables (days)
24
25
22
24
26
26
Net Working capital (days)
71
79
74
70
68
70
May 23, 2016
9
ITC | 4QFY2016 Result Update
Research Team Tel: 022 - 39357800
DISCLAIMER
Angel Broking Private Limited (hereinafter referred to as “Angel”) is a registered Member of National Stock Exchange of India Limited,
Bombay Stock Exchange Limited and Metropolitan Stock Exchange of India Limited. It is also registered as a Depository Participant with
CDSL and Portfolio Manager with SEBI. It also has registration with AMFI as a Mutual Fund Distributor. Angel Broking Private Limited is
a registered entity with SEBI for Research Analyst in terms of SEBI (Research Analyst) Regulations, 2014 vide registration number
INH000000164. Angel or its associates has not been debarred/ suspended by SEBI or any other regulatory authority for accessing
/dealing in securities Market. Angel or its associates including its relatives/analyst do not hold any financial interest/beneficial
ownership of more than 1% in the company covered by Analyst. Angel or its associates/analyst has not received any compensation /
managed or co-managed public offering of securities of the company covered by Analyst during the past twelve months. Angel/analyst
has not served as an officer, director or employee of company covered by Analyst and has not been engaged in market making activity
of the company covered by Analyst.
This document is solely for the personal information of the recipient, and must not be singularly used as the basis of any investment
decision. Nothing in this document should be construed as investment or financial advice. Each recipient of this document should
make such investigations as they deem necessary to arrive at an independent evaluation of an investment in the securities of the
companies referred to in this document (including the merits and risks involved), and should consult their own advisors to determine
the merits and risks of such an investment.
Reports based on technical and derivative analysis center on studying charts of a stock's price movement, outstanding positions and
trading volume, as opposed to focusing on a company's fundamentals and, as such, may not match with a report on a company's
fundamentals.
The information in this document has been printed on the basis of publicly available information, internal data and other reliable
sources believed to be true, but we do not represent that it is accurate or complete and it should not be relied on as such, as this
document is for general guidance only. Angel Broking Pvt. Limited or any of its affiliates/ group companies shall not be in any way
responsible for any loss or damage that may arise to any person from any inadvertent error in the information contained in this report.
Angel Broking Pvt. Limited has not independently verified all the information contained within this document. Accordingly, we cannot
testify, nor make any representation or warranty, express or implied, to the accuracy, contents or data contained within this document.
While Angel Broking Pvt. Limited endeavors to update on a reasonable basis the information discussed in this material, there may be
regulatory, compliance, or other reasons that prevent us from doing so.
This document is being supplied to you solely for your information, and its contents, information or data may not be reproduced,
redistributed or passed on, directly or indirectly.
Neither Angel Broking Pvt. Limited, nor its directors, employees or affiliates shall be liable for any loss or damage that may arise from
or in connection with the use of this information.
Note: Please refer to the important ‘Stock Holding Disclosure' report on the Angel website (Research Section). Also, please refer to the
latest update on respective stocks for the disclosure status in respect of those stocks. Angel Broking Pvt. Limited and its affiliates may
have investment positions in the stocks recommended in this report.
Disclosure of Interest Statement
ITC
1. Analyst ownership of the stock
No
2. Angel and its Group companies ownership of the stock
No
3. Angel and its Group companies' Directors ownership of the stock
No
4. Broking relationship with company covered
No
Note: We have not considered any Exposure below ` 1 lakh for Angel, its Group companies and Directors
Ratings (Based on expected returns
Buy (> 15%)
Accumulate (5% to 15%)
Neutral (-5 to 5%)
over 12 months investment period):
Reduce (-5% to -15%)
Sell (< -15)
May 23, 2016
10