IPO Note | Insurance
Sept 14, 2017
ICICI Lombard General Insurance Co Ltd
SUBSCRIBE
Issue Open: Sept 15, 2017
Issue Close: Sept 19, 2017
ICICI Lombard is the largest non-life private sector insurer in India. It is a JV
Issue Details
between ICICI Bank and Fairfax Financial Holdings Ltd of Canada. Backed by
Face Value: `10
strong parentage, and under penetration of non-life insurance business in India,
Present Eq. Paid up Capital:
the company has been on a strong growth path with its Gross Direct Premium
`453.95cr
Income growing by 26.7% over FY2015-17.
O ffer for Sale: **8.62cr Shares
Leadership position among private general insurers: ICICI Lombard has retained
Fresh issue: ` 0cr
its leadership position among the private non-life insurance players since 2004
Post Eq. Paid up Capital: `453.95 cr
and has been gaining market share. In FY2017, it had a market share of 8.4%
among all non-life insurance companies and 18% among the private sector non-
Issue size (amount): *`5,615cr -
**5,700cr
life insurance companies. The leadership position of the company can be
attributed to the fact that it is one of the most efficient in terms of claim settlement
Price Band: `651-661
ratios.
Lot Size: 22 shares and in multiple
thereafter
Higher share of business from the low loss ratio segments should improve
Post-issue implied mkt. cap:
*`29,538cr - **`29,992cr
profitability: Motor Insurance forms the largest part of the business (42.3%) for the
company followed by health and personal accident segments (18.8%). However,
Promoters holding Pre-Issue: 84.83%
over the last two years the share of other segments like crop/ weather insurance
Promoters holding Post-Issue: 65.83%
has gone up, which has a relatively lower loss ratio. Increasing share of business
*Calculated on lower price band
from the low loss ratio segments will be a positive trigger for the company.
** Calculated on upper price band
Growth driven by strong parentage & wide distribution network: ICICI Lombard
Book Building
operates through 51 corporate agents, including ICICI Bank (its promoter), which
QIBs
50% of issue
gives the company an access to their 4,850 branches. Moreover, it has a network
Non-Institutional
15% of issue
of 20,775 individual agents. With large distribution network in place, we believe
Retail
35% of issue
the company would continue to gain market share in the years to come.
High solvency ratio leads to better bottom-line with strong RoE: The Company has
Post Issue Shareholding Patter
a strong capital base with a solvency ratio of 2.1x (FY2017) as compared to IRDA
Promoters
66%
prescribed minimum of 1.5x. The company’s net premium income has grown at a
Others
34%
CAGR of 11.3% over FY2013-17, while its PAT has grown by 16.1% over the
same period, which is a testimony to its improving efficiency and as a result its
RoE has also improved to 17.2% by FY17 from 15.6% in FY2015.
Outlook & Valuation: At the upper price band of `661 the issue is offered at 8x its
FY2017 BV. While on the reported numbers it might appear to be fairly valued,
we believe with strong potential to deliver high double digit growth for next
multiple years, the issue looks decently priced, and hence we have a SUBSCRIBE
rating on the issue.
Key Financials
Y/E March (` cr)
FY2013
FY2014
FY2015
FY2016
FY2017
Premium Earned
4,012
4,352
4,234
4,826
6,158
% chg
8
(3)
14
28
Net profit
353
520
585
505
642
% chg
47
13
-14
27
EPS
8
11
13
11
14
Book Value
43
53
64
71
82
P/E
86
58
52
60
47
Siddhart Purohit
P/BV (x)
15
13
10
9
8
+022 39357600, Extn: 6872
RoE (%)
18
22
20
16
17
Source: RHP, Angel Research; Note: Valuation ratios based on pre-issue outstanding shares and at upper end of the price band
Please refer to important disclosures at the end of this report
1
ICICI Lombard | IPO Note
Company background
ICICI Lombard General Insurance is the largest private non-life insurer in India
based on gross direct premium income for FY2017. The company has maintained
its leadership stance since 2004. The company offers a comprehensive and well
diversified range of products including motor, health, crop/ weather, fire, personal
accident, marine and engineering insurance, etc.
The company has multiple distribution channels and operates through
51
corporate agents including its promoter ICICI Bank, which gives it an access to
4,850 branches. It caters to 80% of the motor vehicle manufactures in India by
vehicle sales. Further, the company has 20,775 individual agents.
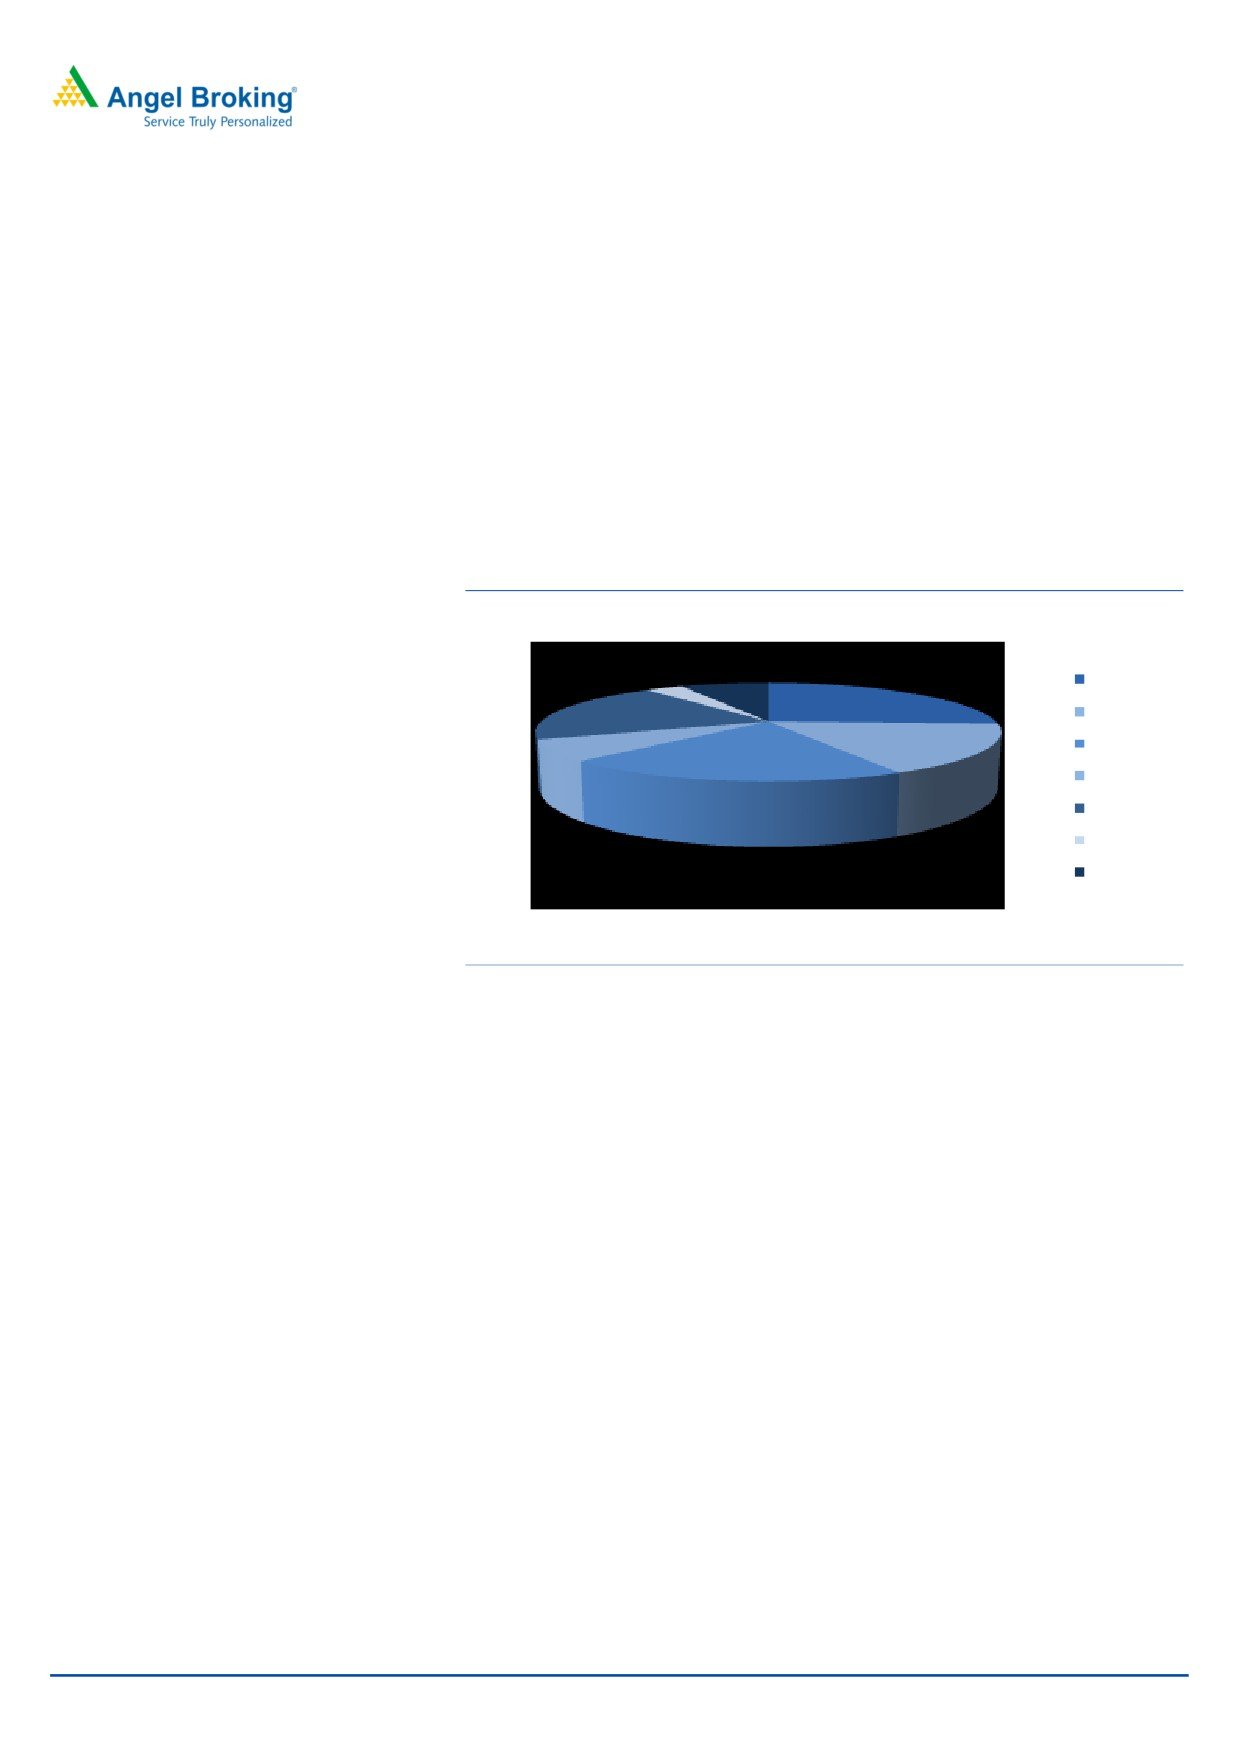
Exhibit 1: Business Contribution Across Segments (FY17)
7.5
3.2
Motor OD
25.7
20.1
Motor TP
Health PA
Fire
Marine
6.9
16.6
Crop
20.0
Others
Source: RHP, Angel Research
Sept 14, 2017
2
ICICI Lombard | IPO Note
Issue details
Issuance of 8.62cr Equity Shares, 3.17 cr shares by ICICI Bank Ltd and 5.44 cr
equity shares by Fairfax Financial Holdings Ltd via an offer for sale.
Objects of the offer
To list the equity share of the company the on the exchanges
Enhance the “ICICI Lombard” brand name and provide liquidity to the existing
shareholders
Being an offer for sale, the company will not receive any proceeds from the
offer
Exhibit 2: Top 10 Share Holders Pre-issues
Shareholders
No Of Equity Shares
%
1 ICICI Bank
28,56,05,284
62.92
2 FAL
9,94,64,479
21.91
3 Red Bloom Investment Ltd
4,08,89,791
9.01
4 Tamarind Capital Pte Ltd
72,11,596
1.59
5 IIFL Special Opportunities Fund
40,76,135
0.90
6 IIFL Special Opportunities Fund-Series 2
27,17,424
0.60
7 IVF Trustee Company Pvt Ltd
14,02,200
0.31
8 IIFL Special Opportunities Fund-Series 3
9,70,509
0.21
9 Sandeep Bakshi
9,41,250
0.21
10 Alok Kumar Agrawal
4,55,000
0.10
Total
44,37,33,668
97.76
Source: RHP, Angel Research
Sept 14, 2017
3
ICICI Lombard | IPO Note
Investment rationale
Leadership position among private General Insurers: ICICI Lombard has retained
its leadership position among the private non-life insurance players since 2004
and has been gaining market share. In FY2017, ICICI Lombard issued ~17.7 mn
policies and had a market share of 8.4% among all non-life insurance companies
and 18% among the private sector non-life insurance companies, while its
competitor, Bajaj Allianz has a market share of 12.8%.
Exhibit 3: Market Share (%)
Exhibit 4: Market Share (%)
14
12.8
12
FY17
18.0
9.8
10
9.2
8
7.0
FY16
18.5
6
4
FY15
17.6
2
0
17
17.5
18
18.5
19
Bajaj Alianz
HDFC Ergo
IIFCO-Tokio
Tata AIG
Source: RHP, Angel Research
Source: RHP, Angel Research
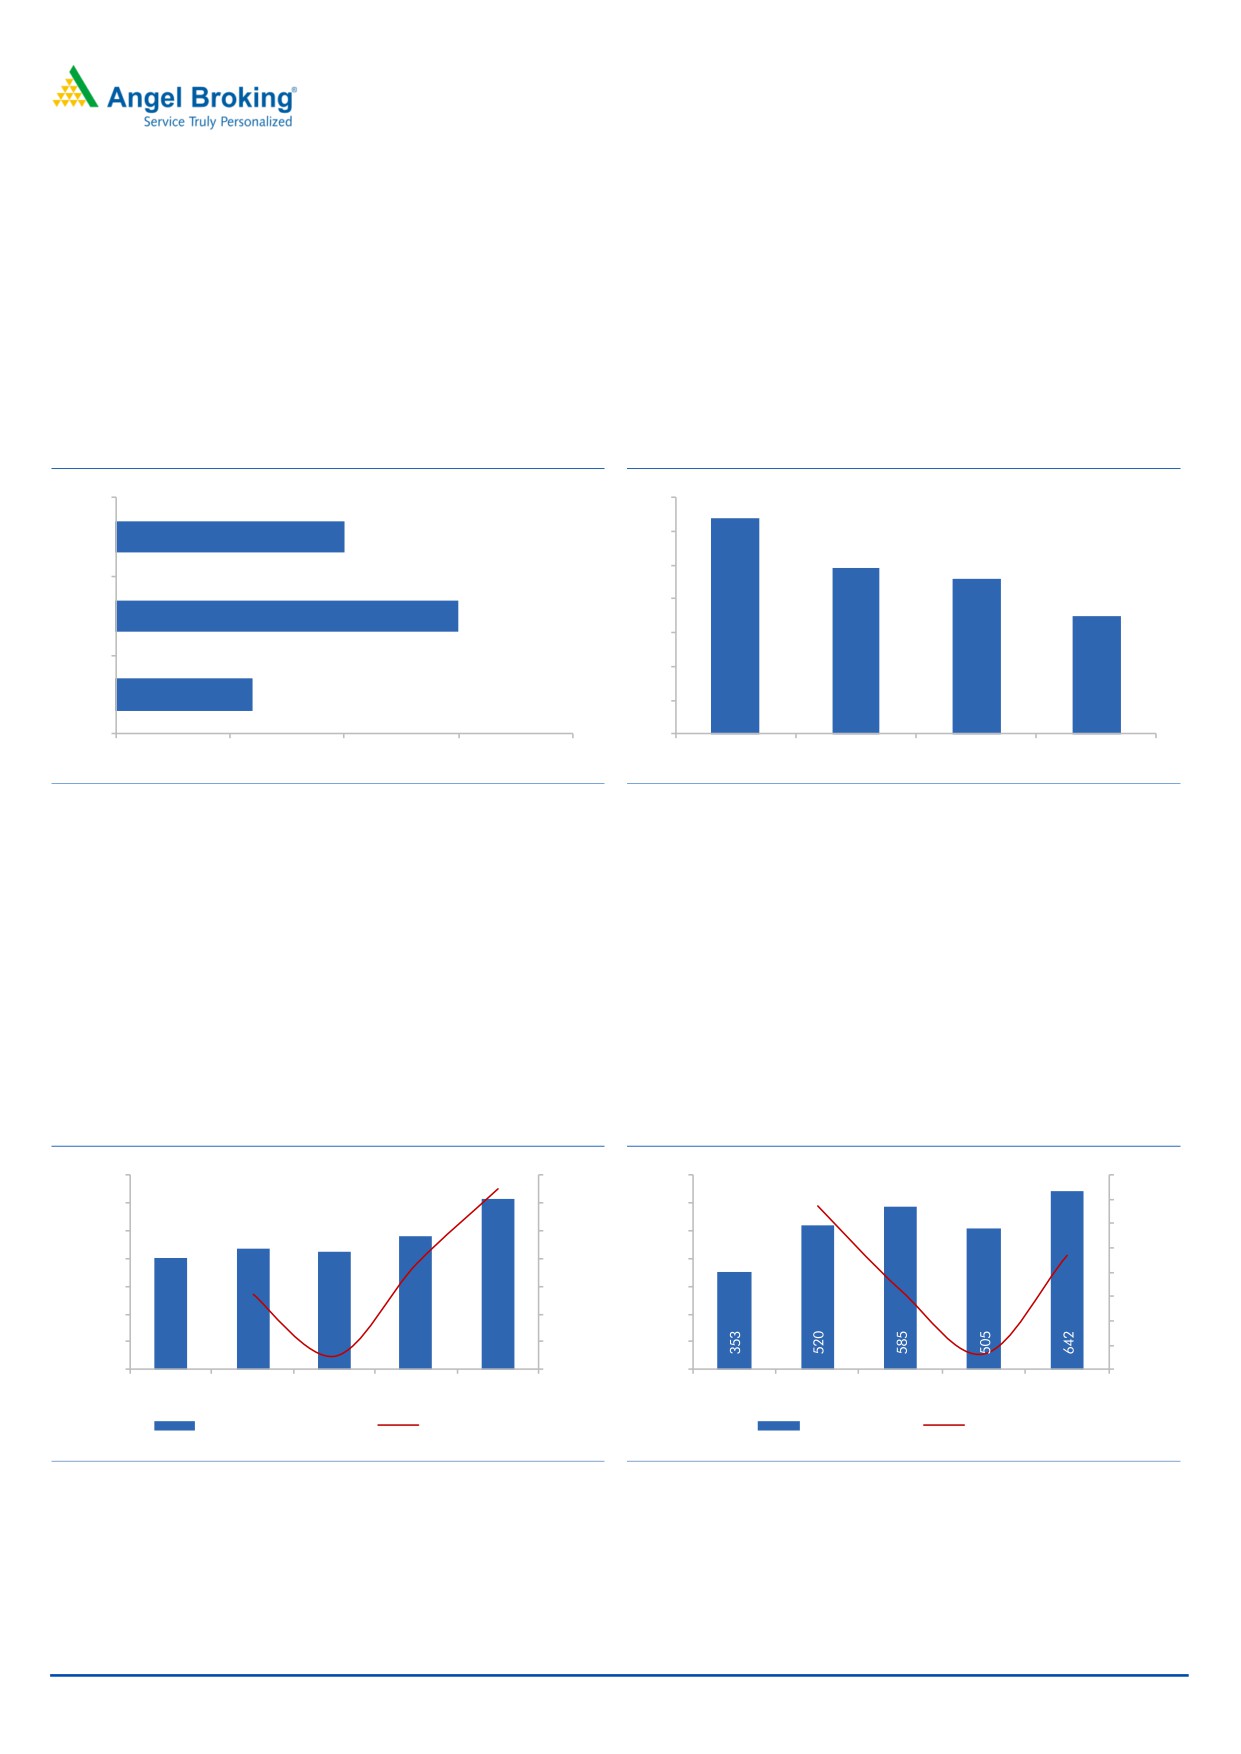
High solvency ratio leading to accelerated bottom-line growth with strong RoE: The
Company has a strong capital base with a solvency ratio of 2.1x (FY2017) as
compared to IRDA prescribed minimum of 1.5x. The company’s net premium
income has grown at a CAGR of 11.3% over FY2013-17, while its PAT has grown
by 16.1% over the same period, which is a testimony to its improving efficiency
and as a result its RoE has also improved to 17.2% from 15.6% in FY2015.
Exhibit 5: Premium Earned Net (` Cr )
Exhibit 6: PAT (` Cr )
7,000
30.0
700
60.0
6,158
47.4
6,000
25.0
600
50.0
27.6
4,826
40.0
5,000
4,352
4,234
20.0
500
27.0
4,012
14.0
30.0
4,000
15.0
400
12.5
20.0
8.5
3,000
10.0
300
10.0
2,000
5.0
200
-13.7
-
-2.7
1,000
-
100
-10.0
-
-5.0
-
-20.0
2,013
2,014
2,015
2,016
2,017
2,013
2,014
2,015
2,016
2,017
Premiums earned (net)
% Growth YoY
Profit after tax
% Growth YoY
Source: Company, Angel Research
Source: Company, Angel Research
Sept 14, 2017
4
ICICI Lombard | IPO Note
Increasing share of business from the low loss ratio segments: As shown in the
table below, Motor Insurance forms the largest part of the business for the
company followed by health and personal accident segments. However, over the
last two years the share of other segments like crop/ weather insurance has gone
up, which has a relatively lower loss ratio.
Exhibit 7: Gross Direct Premium Income (GDPI)
` Cr
FY15
FY16
FY17
` Cr
%
` Cr
%
` Cr
%
Motor
Own Damage
2,132
31.9
2,523
31.2
2,760
25.7
Third Party
1,284
19.2
1,627
20.1
1,782
16.6
Total Motor
3,416
51.1
4,150
51.3
4,542
42.3
Health & Personal Accident
Health
1,318
19.7
1,384
17.1
1,668
15.5
Personal Accident
233
3.5
279
3.4
358
3.3
Total Health & Personal Accident
1,551
23.2
1,663
20.5
2,026
18.8
Crop/ Weather
276
4.1
593
7.3
2,151
20.1
Fire
545
8.2
633
7.8
745
6.9
Marine
246
3.7
300
3.7
341
3.2
Engineering
171
2.6
198
2.5
225
2.1
Other
474
7.1
555
6.9
697
6.5
Total
1,712
25.7
2,279
28
4,159
38.8
Gross Total
6,679
100
8,092
100
10,727
100
Source: RHP, Angel Research
Strong parentage coupled with wide distribution network would continue to drive
the growth: ICICI Lombard operates through 51 corporate agents, including ICICI
Bank (its promoter), which gives it an access to their 4,850 branches. In addition to
this, it has a network of 20,775 individual agents. With large distribution network
in hand, we believe the company would continue to gain market share in the years
to come. Incrementally the company has been focusing a lot on electronic
platform for its sales and approximately 1.6 mn policies were sold via electronic
mode in FY17.
Sept 14, 2017
5
ICICI Lombard | IPO Note
Improving loss ratios across segments: The overall loss ratio of the company has
been improving over the last few years and it has come down to 80.6% during
FY2017 from a level of 83.5% in FY2013. Over FY2016-17 there has been a 100
bps improvement in the loss ratios. Similarly, the expenses ratio has also been
coming down gradually with a 350 bps improvement in the last one year.
Reducing loss and expenses ratios have been one of the primary drivers for
reducing the overall combined ratio, which has seen 80 bps improvement over
FY2016-17.
Exhibit 8: Motor Insurance
Own Damage Motor Insurance
FY15
FY16
FY17
GDPI (` Cr )
2,132
2,523
2,760
Pvt Market Share (%)
18.2
19.4
18.9
Industry Market Share (%)
11.0
11.8
11.6
Loss Ratio (%)
61.8
65.6
64.2
Combined Ratio (%)
84.6
97.3
97.2
Source: Company, Angel Research
Exhibit 9: Motor Insurance
Third Party Motor Insurance
FY15
FY16
FY17
GDPI (` Cr )
1,284
1,627
1,782
Pvt Market Share (%)
15.9
17.0
15.0
Industry Market Share (%)
7.2
7.7
6.7
Loss Ratio (%)
105.8
97.7
97.4
Combined Ratio (%)
138.8
131.2
130.4
Source: Company, Angel Research
Private cars, 2 wheelers and Commercial Vehicles contribute 49.6%, 32.3% and
18.1% respectively of Motor GDPI in FY2017. On an incremental basis, the
company is focusing more on the relatively higher profitable segment, which is
visible from the fact that proportion of 2 wheelers and private cars have increased
to 81.9% in FY2017 from 77% in FY2015. Further, the company is underwriting
select segments of commercial vehicles.
Sept 14, 2017
6
ICICI Lombard | IPO Note
In the health and personal accident segment, the company has been focusing
more on the retail segment and retail, corporate and mass health contributed
54.2%, 32.6% and 13.2% respectively of health GDPI in FY2017. In the crop
insurance sector, it has issued more than 2 mn policies in each of Kharif and Rabi
seasons across 10 states and 83 districts under PMFBY. The company does a
geographic specific risk assessment while selecting regions. In the fire insurance
segment, the company takes underwriting of small risks for diversification of
portfolio and for attractive pricing. In the engineering segment the focus is on long
term policies, including coverage for infrastructure and industrial erection projects.
Exhibit 10: Health & Personal Accident Insurance
Health & Personal Accident Insurance
FY15
FY16
FY17
GDPI (` Cr )
1,640
1,760
2,150
Pvt Market Share (%)
18.0
15.9
15.4
Industry Market Share (%)
7.3
6.4
6.3
Loss Ratio (%)
87.4
82.1
90.2
Combined Ratio (%)
103.1
91.4
99.1
Source: Company, Angel Research
Exhibit 11: Fire Insurance
Fire Insurance
FY15
FY16
FY17
GDPI (` Cr )
545
633
745
Pvt Market Share (%)
16.6
16.4
16.6
Industry Market Share (%)
6.8
7.2
7.8
Loss Ratio (%)
94
63.6
68.4
Combined Ratio (%)
104.8
38.3
58.4
Source: Company, Angel Research
Exhibit 12: Marine Insurance
Marine Insurance
FY15
FY16
FY17
GDPI (` Cr )
246
300
341
Pvt Market Share (%)
21.8
24.0
26.3
Industry Market Share (%)
8.2
10.0
11.8
Loss Ratio (%)
98.7
97.5
83.9
Combined Ratio (%)
134.2
129.6
118.2
Source: Company, Angel Research
Exhibit 13: Crop Insurance
Crop Insurance
FY16
FY17
GDPI (` Cr )
593
1,070
Pvt Market Share (%)
29.9
22.2
Industry Market Share (%)
10.7
10.4
Loss Ratio (%)
140
84.2
Combined Ratio (%)
120.2
72.1
Source: Company, Angel Research
Sept 14, 2017
7
ICICI Lombard | IPO Note
Industry Outlook:
Significant growth opportunity in India: The size of Indian non life insurance
sector was `1.28 trillion on a GDPI basis at end of FY2017. Indian non life
insurance sector grew by 17.4% between FY2001-17. According to Swiss Re, India
was the fifteenth largest market in the world and the fourth largest in Asia in 2016,
behind China, Japan and South Korea. India was also amongst fastest growing
non-life insurance markets over 2011-16, growing at 14.5% ( as per Swiss Re).
Exhibit 14: Non Life Insurance CAGR
25%
19.10%
20%
14.50%
15%
11.70% 10.80%
10%
8.40%
5.80%
4.00%
3.60%
5%
3.20%
0%
Source: RHP, Angel Research
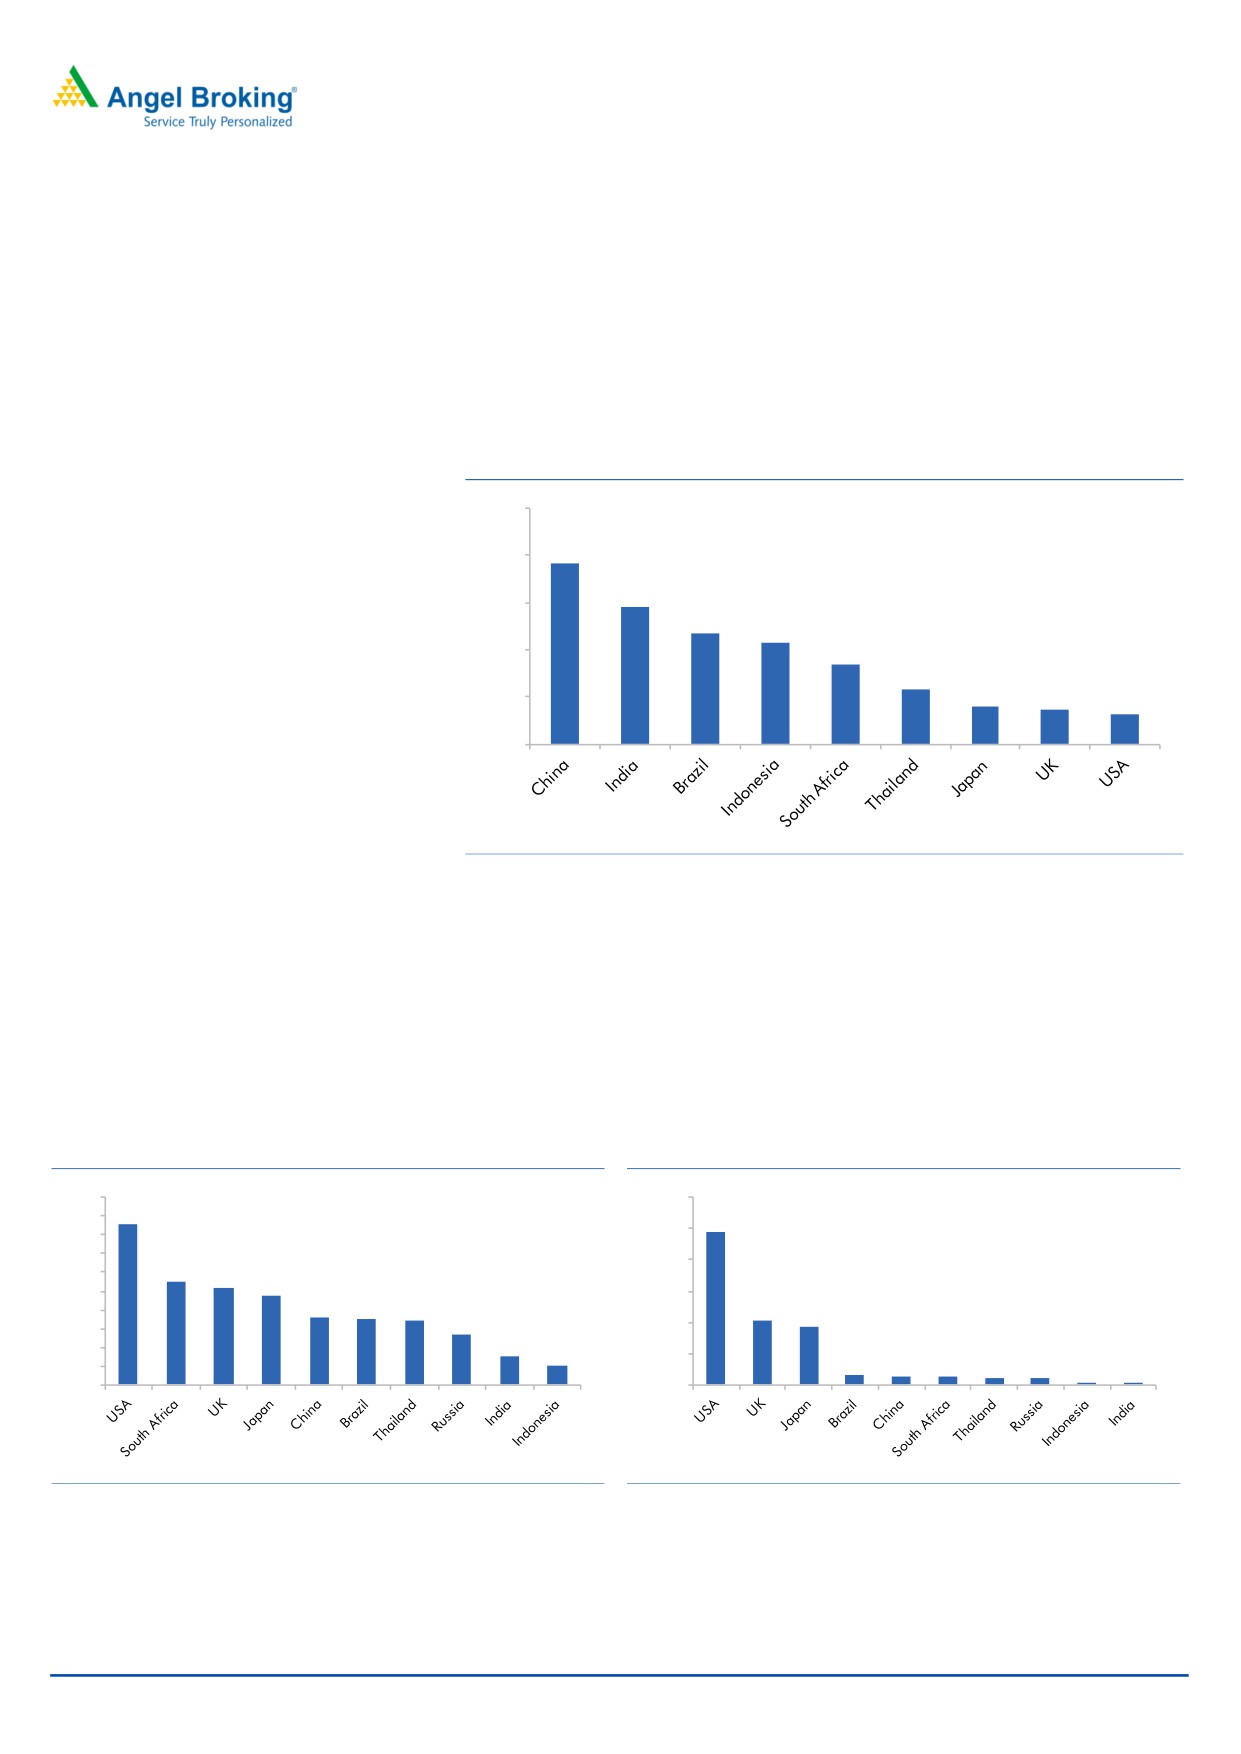
Despite its size and growth profile, India continues to be an underpenetrated
market with a non-life insurance penetration of 0.77% in 2016 as compared to
1.81% in China, 1.70% in Thailand, 1.67% in Singapore and 1.62% in Malaysia
and global average of 2.81% in 2016. At US $ 13.2 in 2016, insurance density
also remains significantly lower as compared to other developed and emerging
market economies.
Exhibit 15: Premium as a % of GDP (CY16)
Exhibit 16: Non Life Insurance Density ( US $)
5.0
3000
4.29
4.5
2449
2500
4.0
3.5
2.74
2000
3.0
2.58
2.37
2.5
1500
1.81
1.76
1.7
1031
2.0
928
1.36
1000
1.5
0.77
1.0
0.51
500
151
147
147
0.5
101
100
18
13
0.0
0
Source: RHP, Angel Research* Data for 2016
Source: RHP, Angel Research
Sept 14, 2017
8
ICICI Lombard | IPO Note
Outlook & Valuation
The Indian Non-Life Insurance Industry has been one of the fastest growing
markets across emerging markets with a 14.5% CAGR over CY2011-16. Despite
the high growth the premium density as % of GDP is still at 0.77% which leaves
scope for much scalability.
At the upper price band of `661 the issue is offered at 8x its FY2017 BV. While on
the reported numbers it might appear to be fairly valued, we believe with strong
potential to deliver high double digit growth for next multiple years, the issue
looks decently priced, and hence we have a SUBSCRIBE rating on the issue.
Sept 14, 2017
9
ICICI Lombard | IPO Note
Statement of Revenue
Y/E March (` cr)
2,013
2,014
2,015
2,016
2,017
Premiums earned (net)
4,012
4,352
4,234
4,826
6,158
% chg
8
-3
14
28
Profit on sale/ redemption of investments
77
175
202
280
329
Less : Loss on sale/ redemption of investments
(20)
(53)
(27)
(9)
(32)
Others
15
22
32
48
27
Interest, Dividend & Rent- Gross
403
533
604
659
699
Total (A)
4,487
5,028
5,045
5,804
7,180
Claims incurred (net)
3,350
3,629
3,446
3,939
4,966
Loss Ratio
83
83
81
82
81
Commission (net)
(183)
(229)
(346)
(328)
(434)
Operating expenses related to insurance business
1,019
1,216
1,387
1,711
1,982
Premium deficiency
(2)
-
-
-
-
Total (B)
4,185
4,616
4,486
5,322
6,513
Statement of P&L
Operating Profit /(Loss) C=(A - B)
303
413
558
482
667
Operating profit/(loss)
303
413
558
482
667
Income from investments
111
136
182
228
315
Other income
2
7
2
14
2
Total (A)
416
556
742
724
984
Provisions (Other than taxation)
56
13
22
1
5
Other expenses
-
-
-
-
-
(a) Expenses other than those business
3
5
13
18
96
(b) Bad debts written off
4
3
0
-
-
(c) Loss on sale/discard of
2
2
2
0
3
(d) Penalty
-
0
1
0
-
Total (B)
65
23
38
19
104
Profit before tax (C) = (A-B)
351
533
705
705
880
Provision for taxation
(1)
13
119
199
238
Profit after tax
353
520
585
505
642
EPS
8
11
13
11
14
% chg
47
13
(14)
27
Sept 14, 2017
10
ICICI Lombard | IPO Note
Balance Sheet
Y/E March (` cr)
FY13
FY14
FY15
FY16
FY17
Sources of funds
Share capital
437
445
447
448
451
Reserves and surplus
1,422
1,948
2,439
2,788
3,274
Share application money-pending allotment
100
0
0
-
1
Networth
1,959
2,394
2,885
3,235
3,726
Share Holder Fund
-
18
69
61
175
Policy Holder Fund
-
95
287
249
503
Fair value change account
70
113
356
309
677
Borrowings
485
Total
2,029
2,507
3,241
3,545
4,889
Application of funds
Investments
7,800
9,290
10,200
11,563
15,079
Fixed assets
400
389
390
383
383
Deferred tax asset
48
35
97
124
87
Current assets (A)
4,388
5,029
3,959
5,045
7,802
Cash and bank balances
270
162
142
195
194
Advances and other assets
4,118
4,867
3,818
4,850
7,608
Current liabilities and provisions (B)
10,697 12,237 11,404
13,570
18,462
Net current assets (C) = (A - B)
(6,309)
(7,207)
(7,445)
(8,525)
(10,660)
Debit balance in profit and loss account
89
-
-
-
-
Total
2,029
2,507
3,241
3,545
4,889
Key Ratio
FY13
FY14
FY15
FY16
FY17
ROE
18
22
20
16
17
BV
43
53
64
71
82
EPS
8
11
13
11
14
P/E
85
58
51
59
47
P/BV
15
13
10
9
8
Loss Ratio
83
83
81
82
81
Combined Ratio
104
105
105
107
104
Solvency Ratio
155
172
195
182
210
Investment Leverage Ratio
-
4
4
4
4
Ratio are calculated at Upper Band of IPO
Sept 14, 2017
11
ICICI Lombard | IPO Note
Research Team Tel: 022 - 39357800
DISCLAIMER
Angel Broking Private Limited (hereinafter referred to as “Angel”) is a registered Member of National Stock Exchange of India Limited,
Bombay Stock Exchange Limited and Metropolitan Stock Exchange Limited. It is also registered as a Depository Participant with CDSL
and Portfolio Manager with SEBI. It also has registration with AMFI as a Mutual Fund Distributor. Angel Broking Private Limited is a
registered entity with SEBI for Research Analyst in terms of SEBI (Research Analyst) Regulations, 2014 vide registration number
INH000000164. Angel or its associates has not been debarred/ suspended by SEBI or any other regulatory authority for accessing
/dealing in securities Market. Angel or its associates/analyst has not received any compensation / managed or co-managed public
offering of securities of the company covered by Analyst during the past twelve months.
This document is solely for the personal information of the recipient, and must not be singularly used as the basis of any investment
decision. Nothing in this document should be construed as investment or financial advice. Each recipient of this document should
make such investigations as they deem necessary to arrive at an independent evaluation of an investment in the securities of the
companies referred to in this document (including the merits and risks involved), and should consult their own advisors to determine
the merits and risks of such an investment.
Reports based on technical and derivative analysis center on studying charts of a stock's price movement, outstanding positions and
trading volume, as opposed to focusing on a company's fundamentals and, as such, may not match with a report on a company's
fundamentals. Investors are advised to refer the Fundamental and Technical Research Reports available on our website to evaluate the
contrary view, if any.
The information in this document has been printed on the basis of publicly available information, internal data and other reliable
sources believed to be true, but we do not represent that it is accurate or complete and it should not be relied on as such, as this
document is for general guidance only. Angel Broking Pvt. Limited or any of its affiliates/ group companies shall not be in any way
responsible for any loss or damage that may arise to any person from any inadvertent error in the information contained in this report.
Angel Broking Pvt. Limited has not independently verified all the information contained within this document. Accordingly, we cannot
testify, nor make any representation or warranty, express or implied, to the accuracy, contents or data contained within this document.
While Angel Broking Pvt. Limited endeavors to update on a reasonable basis the information discussed in this material, there may be
regulatory, compliance, or other reasons that prevent us from doing so.
This document is being supplied to you solely for your information, and its contents, information or data may not be reproduced,
redistributed or passed on, directly or indirectly.
Neither Angel Broking Pvt. Limited, nor its directors, employees or affiliates shall be liable for any loss or damage that may arise from
or in connection with the use of this information.
Sept 14, 2017
12