2QFY2017 Result Update | Banking
November 11, 2016
ICICI Bank
ACCUMULATE
CMP
`277
Performance Highlights
Target Price
`315
Particulars (` cr)
2QFY17 1QFY17
% chg (qoq)
2QFY16
% chg (yoy)
Investment Period
12 Months
NII
5,253
5,159
1.8
5,251
0.0
Pre-prov. profit
10,636
5,215
104
5,158
106
Stock Info
PAT
3,103
2,254
37.7
3,030
2.4
Source: Company, Angel Research
Sector
Banking
ICICI Bank’s 2QFY17 results have been encouraging. While slippages remained
Market Cap (` cr)
161,198
high, large part of that came from the watch list. The bank has utilized part of the
Beta
1.7
proceeds from stake sale in insurance business towards provisions. Management
52 Week High / Low
298 / 181
commentary also remained optimistic, as no addition is expected to the watch list;
Avg. Daily Volume
1,496,033
sharp deterioration of the accounts within the watch list is also unlikely.
Face Value (`)
2
Overall loan growth remained subdued due to run down in overseas operations:
Domestic loan growth remained decent, growing by
15.9%. However, the
BSE Sensex
26,819
overseas loan book came down by 4%, as a result the overall loan book remained
Nifty
8,296
muted, growing by only 10.9% YoY. Retail loans continued to grow at a healthy
Reuters Code
ICBK.NS
pace, up by 21.1% YoY and now accounted for 47.9 % (46.4% QoQ, 44% YoY) of
the total loan book. Within the domestic corporate side, the bank has been
Bloomberg Code
ICICIBC@IN
selectively lending to high rated corporate only; hence, the growth in that segment
was only 8%. Deposit growth remained strong, up by 16.8%. CASA ratio stood at
Shareholding Pattern (%)
45.7%. The curb on cash transaction by Govt is likely to have a positive impact on
banks, as they will be receiving substantially high deposits from account holders.
Promoters
0.0
MF / Banks / Indian Fls
29.9
Large part of the slippages from the watch list only: During the quarter, the bank
reported slippages worth `8,029cr vs. `8,249cr QoQ. Slippages from watch list
FII / NRIs / OCBs
63.7
was `4,555cr flat QoQ and from that of restructured loan book was `1,231cr vs.
Indian Public / Others
6.4
`1,321cr QoQ. While in absolute term, the slippages remained high, the only
comforting point is that 72% (83% including sales to ARC) of the slippages came
from the list of accounts, which has already been under watch by the bank. The
Abs. (%)
3 m
1 yr
3 yr
drill down list of accounts, which is prone to falling into NPA, has come down by
Sensex
(3.7)
3.7
30.9
`6,242cr during the quarter to `32,490cr vs. `38,732cr in 1QFY17.
ICICI Bank
14.3
4.9
33.5
Outlook and valuation: Earnings growth for ICICI Bank is likely to remain under
pressure for the next few quarters, due to elevated slippages and resultant credit
cost. However, the good part is that large part of the slippages has been coming
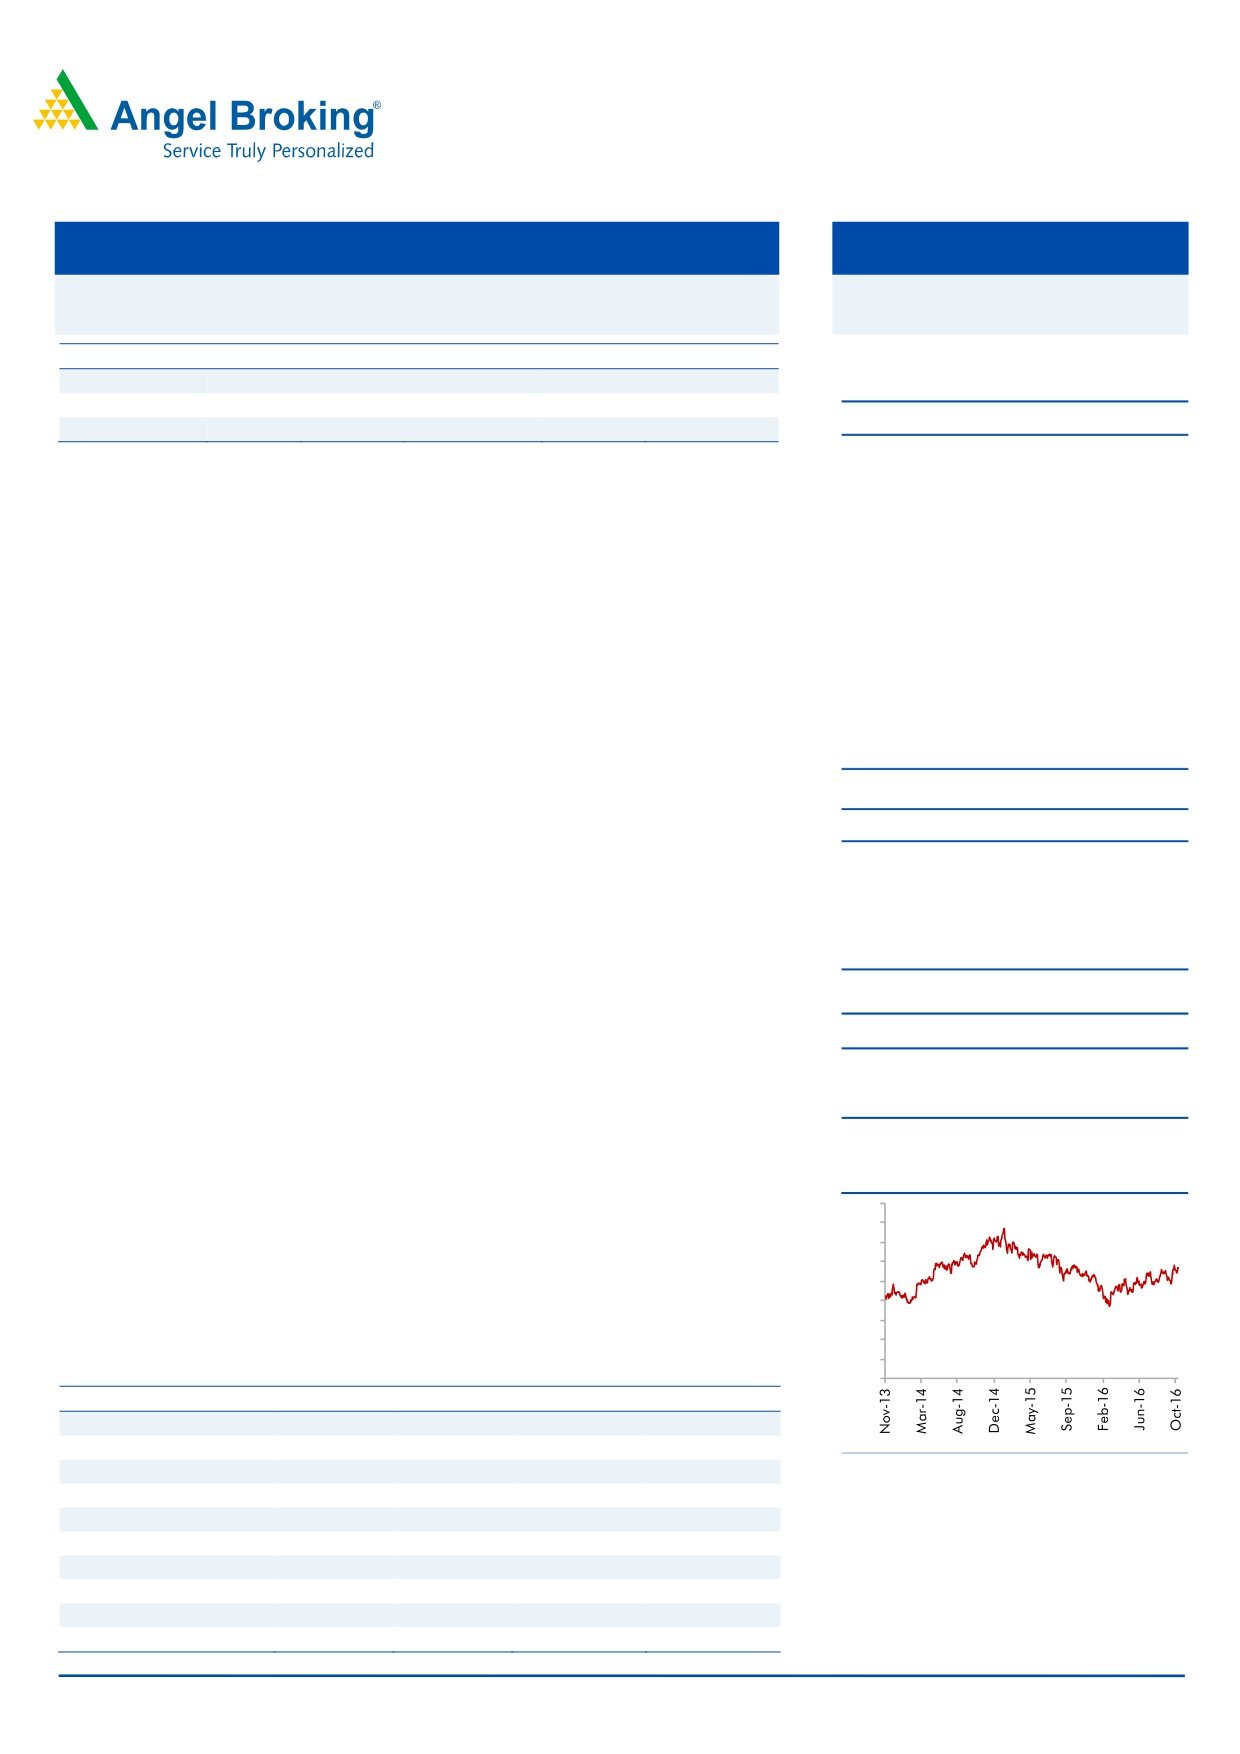
3-year price chart
from the known accounts and hence asset quality after few quarters should
450
stabilize, which will pave the ways for secular growth FY18 onwards. The stock has
400
seen quite a run up in the last few months, however we believe as more clarity
350
emerges on its book the valuation gap of ICICI vs other Pvt Sector banks should
300
250
narrow down. At the CMP the stock is trading at 1.4x its FY18E ABV (Excluding
200
`80 for all the subsidiaries).We recommend an Accumulate rating on the stock,
150
with a revised target price of `315.
100
50
Key financials (Standalone)
0
Y/E March (` cr)
FY2015
FY2016
FY2017E
FY2018E
NII
19,040
21,224
22,252
28,711
% chg
15.6
11.5
4.8
29.0
Source: Company, Angel Research
Net profit
11,176
9,726
10,498
12,734
% chg
13.9
(13.0)
7.9
21.3
NIM (%)
3.2
3.3
3.1
3.3
EPS (`)
19.3
16.7
18.0
21.9
P/E (x)
14.2
16.3
15.1
12.5
P/ABV (x)
2.1
2.1
2.1
1.9
Siddharth Purohit
RoA (%)
1.8
1.4
1.3
1.4
022 - 3935 7800 Ext: 6872
RoE (%)
14.5
11.4
11.1
12.3
Source: Company, Angel Research; Note: CMP as of November 11, 2016
Please refer to important disclosures at the end of this report
1
ICICI Bank | 2QFY2017 Result Update
Exhibit 1: 2QFY2017 performance (Standalone)
Particulars (` cr)
Q1FY16
Q2FY16
Q3FY16
Q4FY16
Q1FY17
Q2FY17
% YoY
% QoQ
Interest earned
12,813
13,099
13,346
13,482
13,330
13,639
4.1
2.3
- on Advances / Bills
9,375
9,665
9,863
10,041
9,837
9,905
2
0.7
- on investments
2,659
2,661
2,652
2,652
2,811
2,997
13
6.6
- on balance with RBI & others
32
31
36
59
50
38
21
(24.2)
- on others
747
741
795
730
632
699
(6)
10.6
Interest Expended
7,697
7,847
7,893
8,077
8,172
8,386
7
2.6
Net Interest Income
5,115
5,251
5,453
5,405
5,159
5,253
0.0
1.8
Other income
2,990
3,007
4,217
5,109
3,429
9,119
203
165.9
- Fee income
2,110
2,235
2,262
2,212
2,156
2,356
5
9.3
- Treasury income
673
550
513
707
505
5,682
933
1025.1
- Others
207
222
1,442
2,190
768
729
(228)
(5.1)
Operating income
8,105
8,259
9,670
10,513
8,588
14,372
74.0
67.4
Operating expenses
3,067
3,100
3,110
3,406
3,373
3,736
21
10.8
- Employee expenses
1,267
1,213
1,140
1,382
1,291
1,556
28
20.6
- Other Opex
1,800
1,888
1,970
2,024
2,082
2,180
15
4.7
Pre-provision Profit
5,038
5,158
6,560
7,108
5,215
10,636
106.2
104.0
Provisions & Contingencies
955
942
2,844
6,926
2,515
7,082
652
181.6
PBT
4,082
4,216
3,716
181
2,700
3,554
(15.7)
31.6
Provision for Tax
1,106
1,186
698
(521)
446
451
(62)
(1.1)
PAT
2,976
3,030
3,018
(2,898)
2,254
3,103
2.4
37.7
Effective Tax Rate (%)
27
28
19
(287)
28
28
-
-
Source: Company, Angel Research
Exhibit 2: 2QFY2017 Loan Book Composition (Standalone)
Particulars (` cr)
Q1FY16
Q2FY16
Q3FY16
Q4FY16
Q1FY17
Q2FY17
% YoY
% QoQ
Domestic Corporate
114,725
116,353
125,222
119,698
127,637
125,829
8.1
(1.4)
Overseas branches
96,737
95,458
99,134
94,017
95,278
91,305
(4)
(4.2
SME
17,189
17,617
20,001
18,716
17,977
19,533
10.9
8.7
Retail Total
171,088
180,265
190,442
202,833
208,534
217,588
21
4.3
-Home
93,927
99,326
104,553
109,530
113,234
118,150
19
4.3
-Vehicle loans
30,625
32,267
33,708
35,293
36,285
37,208
15
2.5
Rural
25,663
25,778
27,805
31,845
31,697
31,333
22
(1.1)
-Banking business
9,239
10,095
10,093
10,750
10,635
8,486
(16)
(20.2)
-Credit cards
4,106
4,507
5,142
5,476
5,839
6,092
35
(4.3)
-Personal loans
7,528
8,292
9,141
10,142
10,844
11,750
42
8.4
Others
-
-
-
-
-
4,569
-
-
Total advances
171,088
180,265
190,442
203,036
208,534
217,588
21
4.3
Source: Company, Angel Research
November 11, 2016
2
ICICI Bank | 2QFY2017 Result Update
Overall loan growth remained subdued due to run down in
overseas operations: Domestic loan growth remained decent, growing by
15.9%. However, the overseas loan book came down by 4%, as a result the overall
loan book remained muted, growing by only 10.9% YoY. Retail loans continued to
grow at a healthy pace, up by 21.1% YoY and now accounted for 47.9% (46.4%
QoQ, 44% YoY) of the total loan book. Within the retail loan portfolio, mortgages
grew by 19% and auto by 14%. Growth in business banking and rural segment
was even healthier, growing by 26% and 30% YoY, respectively.
Within the domestic corporate side, the bank has been selectively lending to high
rated corporate only; hence, the growth in that segment was only 8%. Share of
overseas loan book has come down to 20.1% compared to 23.3% YoY, which
seems a conscious call by the management.
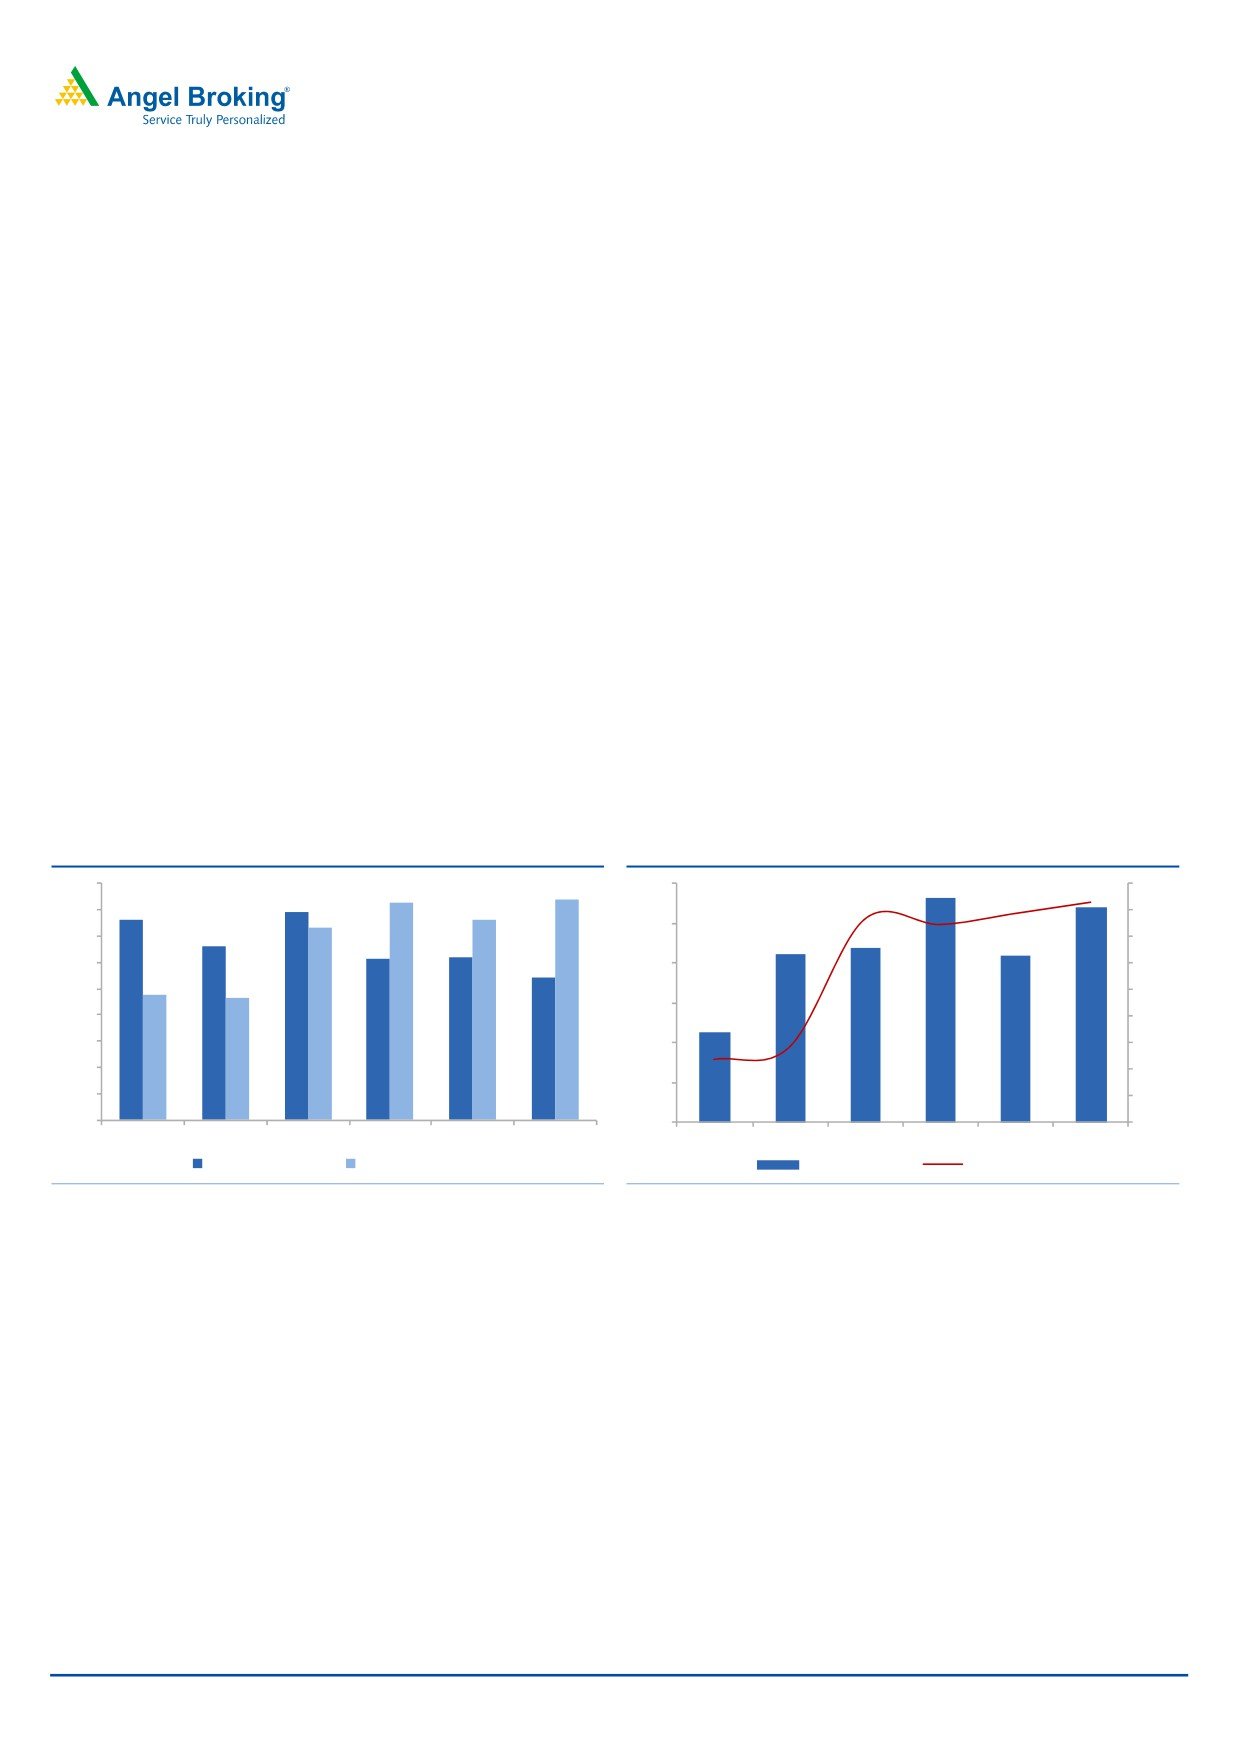
Deposits growth outpaced loan growth:
Deposit growth remained strong and outpaced loan growth, up by 16.8%. CASA
growth was also strong in line with deposit growth, up by 18% yoy and CASA ratio
stood at 45.7%. Within CASA, saving accounts deposit grew by 22%, while current
deposits grew by 11%. Despite subdued deposit growth in the industry, ICICI Bank
has been able to garner strong CASA deposit, which speaks for the strong
franchise it has developed over the years.
Exhibit 3: Loan & Deposit Growth
Exhibit 4: CASA growth & CASA ratio
18.0
16.6
16.8
46.0
19.0
15.8
15.2
15.3
16.0
14.6
18.0
45.5
13.3
14.0
17.0
12.3
12.4
12.0
10.9
45.0
16.0
9.6
9.2
10.0
15.0
44.5
8.0
14.0
6.0
44.0
13.0
4.0
12.0
43.5
2.0
11.0
44.1
45.1
45.2
45.8
45.1
45.7
0.0
43.0
10.0
Q1FY16
Q2FY16
Q3FY16
Q4FY16
Q1FY17
Q2FY17
Q1FY16
Q2FY16
Q3FY16
Q4FY16
Q1FY17
Q2FY17
Loan Growth YoY (%) Deposit Growth YoY (%)
CASA Ratio (%)
YoY Growth (%)
Source: Company, Angel Research
Source: Company, Angel Research
November 11, 2016
3
ICICI Bank | 2QFY2017 Result Update
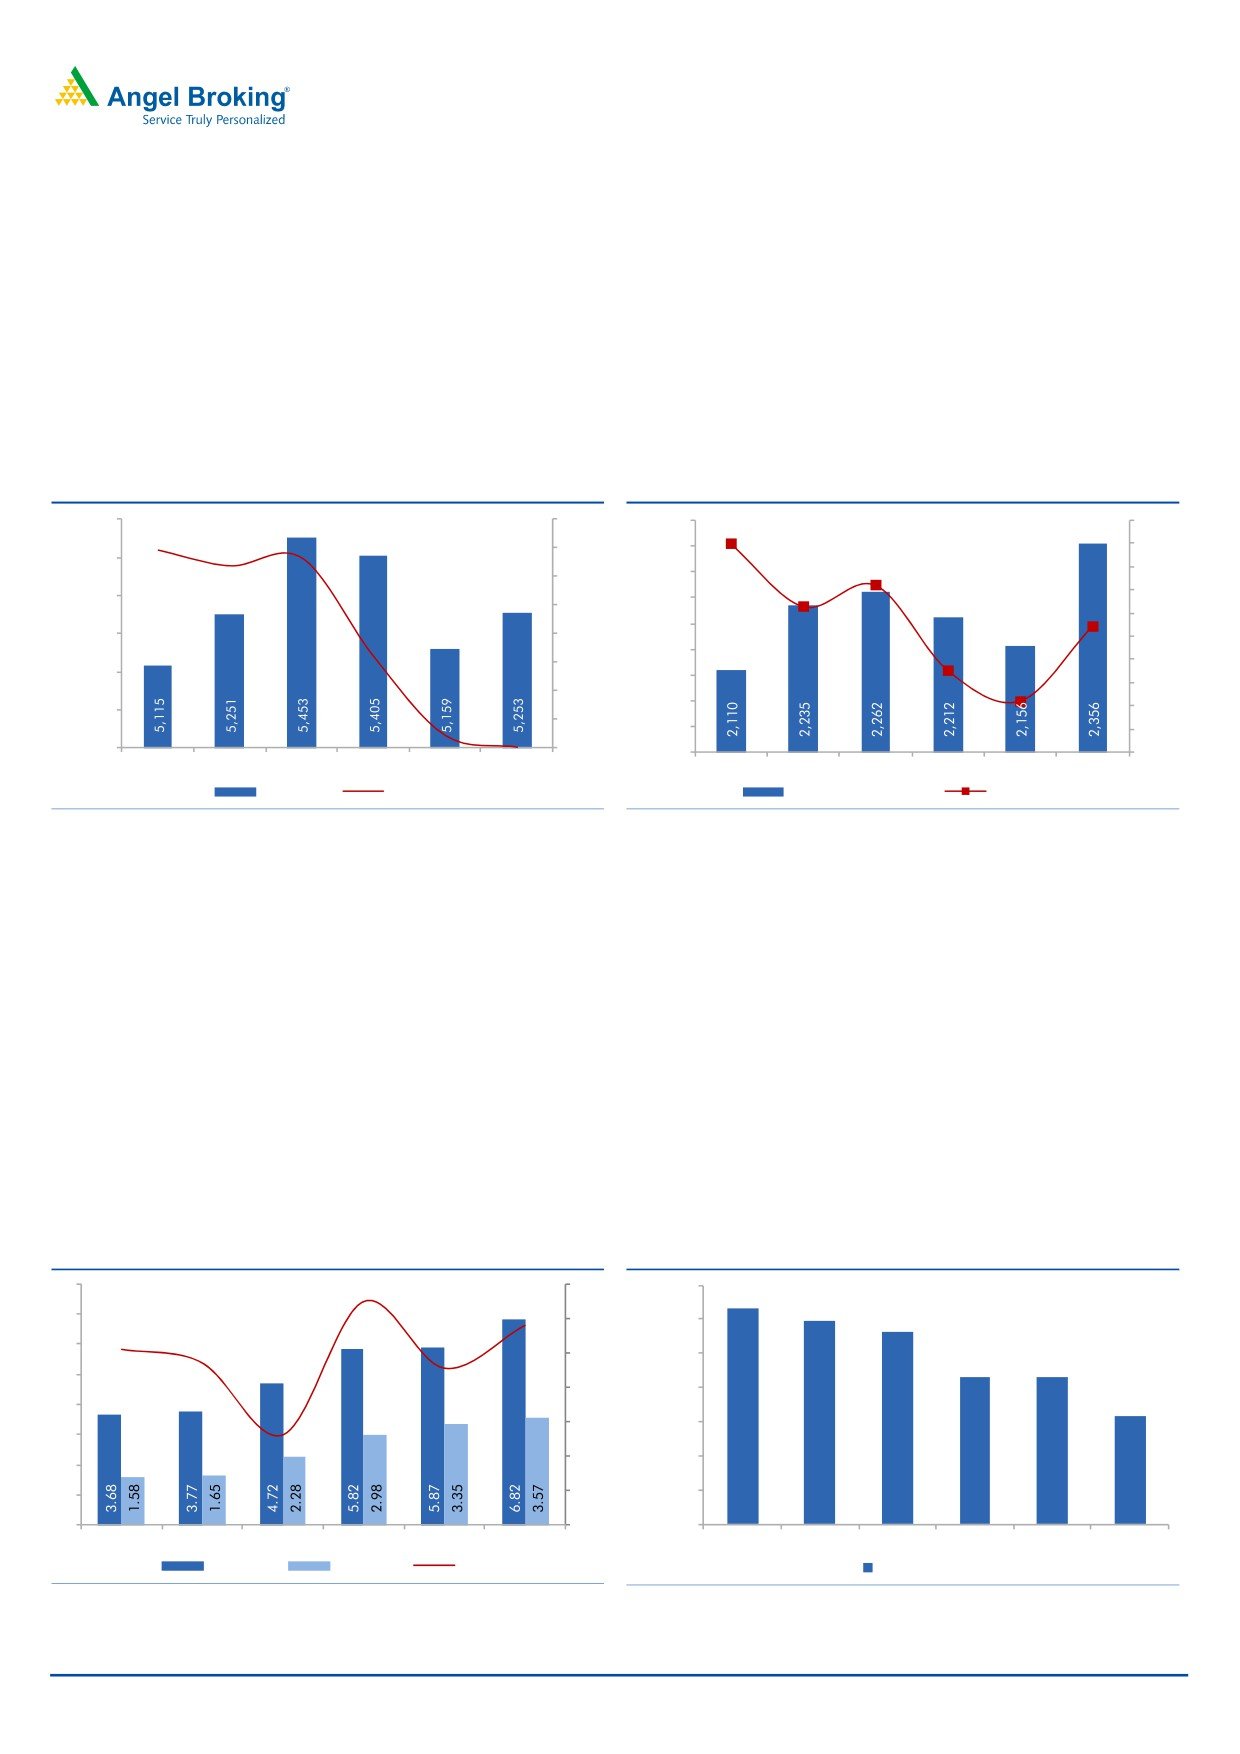
One time gain on stake sale in ICICI-Prudential helped in
taking higher provisions:
Core fee income remained subdued during the quarter growing by only 5.4% YoY.
However, during the queerer the bank booked ` 5,682 cr on account of its stake
sale in the Life Insurance business. The management has judiciously utilized the
onetime gain in taking higher provisions, which has further strengthened its
balance sheet. The bank utilized `680cr from the earlier contingency provisions
created.
Exhibit 5: NII remained flat amid slippages
Exhibit 6: Fee Income also remained subdued
5,500
16.0
2,400
10.0
2,350
9.0
9.0
13.9
14.0
5,400
13.3
12.8
8.0
12.0
2,300
6.3
7.2
7.0
5,300
2,250
10.0
6.0
2,200
5.4
5,200
8.0
5.0
2,150
6.4
6.0
4.0
5,100
2,100
3.5
3.0
4.0
2,050
2.2
5,000
2.0
2.0
2,000
1.0
0.8
4,900
0.0
0.0
1,950
0.0
Q1FY16
Q2FY16
Q3FY16
Q4FY16
Q1FY17
Q2FY17
Q1FY16
Q2FY16
Q3FY16
Q4FY16
Q1FY17
Q2FY17
NII (` Cr)
% YoY Growth
Fee Income (` Cr)
YoY Growth (%)
Source: Company, Angel Research
Source: Company, Angel Research
Large part of the slippages from the watch list only; during the
quarter, the bank reported slippages worth `8,029cr vs. `8,249cr QoQ. Slippages
from watch list was `4,555cr flat QoQ and from that of restructured loan book
was `1,231cr vs. `1,321cr QoQ. While in absolute term, the slippages numbers
remained high, the only comforting point is that 72 % (83% including sales to ARC)
of the slippages came from the list accounts, which has already been under watch
by the bank. The drill down list of accounts, which is prone to falling into NPA, has
come down by `6,242cr during the quarter.
In 2QFY17, the bank sold NPAs worth `1,787cr. Loans outstanding on which SDR
has been implemented stood at `2,900cr. Outstanding 5:25 loans were at
`2,700cr.
Exhibit 7: GNPA% remained high, PCR improved
Exhibit 8: Restructured Loan Book has been declining.
8
62
14,000
12,604
61.0
11,868
7
60
12,000
11,294
59.
6
58.2
6
58
10,000
57.4
8,573
8,573
5
57.1
56
8,000
4
6,336
54
6,000
3
53.2
52
4,000
2
50
2,000
1
0
48
-
Q1FY16
Q2FY16
Q3FY16
Q4FY16
Q1FY17
Q2FY17
Q1FY16
Q2FY16
Q3FY16
Q4FY16
Q1FY17
Q2FY17
GNPAs %
NNPAs %
PCR %
O/S Restrctured Book
Source: Company, Angel Research
Source: Company, Angel Research
November 11, 2016
4
ICICI Bank | 2QFY2017 Result Update
Outlook and Valuation
Earnings growth for ICICI Bank is likely to remain under pressure for the next few
quarters, due to elevated slippages and resultant credit cost. However, the good
part is that large part of the slippages has been coming from the known accounts
and hence asset quality after few quarters should stabilize, which will pave the
ways for secular growth FY18 onwards. The stock has seen quite a run up in the
last few months, however we believe as more clarity emerges on its book the
valuation gap of ICICI vs other Pvt Sector banks should narrow down. At the CMP
the stock is trading at
1.4x its FY18E ABV (Excluding
`80 for all the
subsidiaries).We recommend an Accumulate rating on the stock, with a revised
target price of `315.
Exhibit 9: SOTP valuation summary
Particulars
Target multiple
Value/share (`)
ICICI Bank
1.4x FY2018E ABV
229
Life Insurance
Based on Market Price
40
General Insurance
Based On Deal Value
21
Others (Home Fin, AMC, VC, Securities
25
PD and Overseas subsidiaries)
SOTP value
315
Source: Angel Research
Company Background
ICICI Bank is India's largest private sector bank, with more than 5% market share
in credit. The bank has a pan-India extensive network of 4,450 branches and
around 13,776 ATMs. The bank has a large overseas presence (overseas loans
comprise ~20% of total loans). The bank also has market-leading subsidiaries in
life insurance, general insurance and asset management segments.
November 11, 2016
5
ICICI Bank | 2QFY2017 Result Update
Income statement (Standalone)
Y/E March (` cr)
FY13
FY14
FY15
FY16
FY17E
FY18E
Net Interest Income
13,866
16,476
19,040
21,224
22,252
28,711
- YoY Growth (%)
29.2
18.8
15.6
11.5
4.8
29.0
Other Income
8,346
10,428
12,176
15,323
20,548
15,975
- YoY Growth (%)
11.2
24.9
16.8
25.8
34.1
-22.3
Operating Income
22,212
26,903
31,216
36,547
42,800
44,686
- YoY Growth (%)
21.8
21.1
16.0
17.1
17.1
4.4
Operating Expenses
9,013
10,309
11,496
12,684
14,784
17,510
- YoY Growth (%)
14.8
14.4
11.5
10.3
16.6
18.4
Pre - Provision Profit
13,199
16,595
19,720
23,863
28,016
27,176
- YoY Growth (%)
27.1
25.7
18.8
21.0
17.4
-3.0
Prov. & Cont.
1,810
2,626
3,900
11,668
14,622
8,311
- YoY Growth (%)
13.9
45.7
48.5
199.2
25.3
-43.2
Profit Before Tax
11,390
13,968
15,820
12,196
13,394
18,865
- YoY Growth (%)
29.5
22.6
13.3
(22.9)
9.8
40.8
Prov. for Taxation
3,064
4,158
4,644
2,469
2,896
6,131
- as a % of PBT
26.9
29.8%
29.4%
20.2%
21.6
32.5
PAT
8,325
9,810
11,176
9,726
10,498
12,734
- YoY Growth (%)
28.8
17.8
13.9
(130.)
7.9
21.3
Balance sheet (Standalone)
Y/E March (` cr)
FY13
FY14
FY15
FY16
FY17E
FY18E
Share Capital
1,154
1,161
1,167
1,163
1,165
1,165
Reserve & Surplus
65,552
72,052
79,262
88,566
98,128
1,07,042
Deposits
2,92,614
3,31,914
3,61,563
4,21,426
4,85,715
5,60,049
- Growth (%)
14.5
13.4
8.9
16.6
15.3
15.3
Borrowings
1,45,341
1,54,759
1,72,417
1,74,807
2,04,000
2,74,424
Other Liab. & Prov.
32,134
34,757
31,720
34,726
53,429
61,605
Total Liabilities
5,36,795
5,94,642
6,46,129
7,20,688
8,42,437
10,04,285
Cash in Hand & with
19,053
21,822
25,653
27,106
29,143
33,603
RBI
Bal.with banks & money
22,365
19,708
16,652
32,763
20,643
23,802
at call
Investments
1,71,394
1,77,022
1,86,580
1,60,412
2,58,643
3,12,927
Advances
2,90,249
3,38,703
3,87,522
4,35,264
4,91,311
5,69,238
- Growth (%)
16.7
14.4
12.3
12.9
15.9
Fixed Assets
4,647
4,678
4,726
7,577
7,043
8,121
Other Assets
29,087
32,709
24,997
57,567
35,654
56,594
Total Assets
5,36,795
5,94,642
6,46,129
7,20,688
8,42,437
10,04,285
- Growth (%)
11.4
10.8
8.7
11.5
16.9
19.2
November 11, 2016
6
ICICI Bank | 2QFY2017 Result Update
Ratio analysis (Standalone)
Y/E March
FY13
FY14
FY15
FY16
FY17E
FY18E
Profitability ratios (%)
NIMs
2.9
3.1
3.2
3.3
3.1
3.3
Cost to Income Ratio
40.6
38.3
36.8
34.7
34.5
39.2
RoA
1.6
1.7
1.8
1.4
1.3
1.4
RoE
13.1
14.0
14.5
11.4
11.1
12.3
B/S ratios (%)
CASA Ratio
41.9
42.9
45.5
45.8
46.0
46.1
Credit/Deposit Ratio
99.2
102.0
107.2
103.3
101.2
101.6
CAR
18.7%
17.7%
17.0%
16.6%
15.7%
14.5%
- Tier I
5.9%
4.9%
4.2%
3.5%
3.2%
2.8%
Asset Quality (%)
Gross NPAs
3.2
3.0
3.8
5.8
7.1
6.5
Net NPAs
0.6
1.0
1.6
3.0
4.5
4.4
Slippages
1.4
1.7
2.4
4.4
3.7
2.6
Loan Loss Prov. /Avg. Assets
0.6
0.8
1.0
2.7
3.0
1.5
Provision Coverage
76.8
70.4
59.1
50.3
52.0
52.1
Per Share Data (`)
EPS
14.4
17.0
19.3
16.7
18.0
21.9
ABVPS
111.8
121.1
127.9
129.5
132.9
143.1
DPS
4.0
4.4
4.8
5.0
5.0
6.0
Valuation Ratios
PER (x)
18.9
16.1
14.2
16.3
15.1
12.5
P/ABVPS (x)
2.4
2.3
2.1
2.1
2.1
1.9
Dividend Yield
1.4
1.5
1.6
1.7
1.7
2.1
DuPont Analysis
NII
2.7
2.9
3.1
3.1
2.8
3.1
Non Interest Income
1.6
1.8
2.0
2.2
2.6
1.7
Total Revenues
4.3
4.8
5.0
5.3
5.5
4.8
Operating Cost
1.8
1.8
1.9
1.9
1.9
1.9
PPP
2.6
2.9
3.2
3.5
3.6
2.9
Total Provisions
0.4
0.5
0.6
1.7
1.9
0.9
PreTax Profit
2.2
2.5
2.6
1.8
1.7
2.0
Tax
0.6
0.7
0.7
0.4
0.4
0.7
ROA
1.6
1.7
1.8
1.4
1.3
1.4
Leverage
8.1
8.1
8.1
8.0
8.3
8.9
RoE (%)
13.1
14.0
14.5
11.4
11.1
12.3
November 11, 2016
7
ICICI Bank | 2QFY2017 Result Update
Research Team Tel: 022 - 39357800
DISCLAIMER
Angel Broking Private Limited (hereinafter referred to as “Angel”) is a registered Member of National Stock Exchange of India Limited,
Bombay Stock Exchange Limited and Metropolitan Stock Exchange Limited. It is also registered as a Depository Participant with CDSL
and Portfolio Manager with SEBI. It also has registration with AMFI as a Mutual Fund Distributor. Angel Broking Private Limited is a
registered entity with SEBI for Research Analyst in terms of SEBI (Research Analyst) Regulations, 2014 vide registration number
INH000000164. Angel or its associates has not been debarred/ suspended by SEBI or any other regulatory authority for accessing
/dealing in securities Market. Angel or its associates/analyst has not received any compensation / managed or co-managed public
offering of securities of the company covered by Analyst during the past twelve months.
This document is solely for the personal information of the recipient, and must not be singularly used as the basis of any investment
decision. Nothing in this document should be construed as investment or financial advice. Each recipient of this document should
make such investigations as they deem necessary to arrive at an independent evaluation of an investment in the securities of the
companies referred to in this document (including the merits and risks involved), and should consult their own advisors to determine
the merits and risks of such an investment.
Reports based on technical and derivative analysis center on studying charts of a stock's price movement, outstanding positions and
trading volume, as opposed to focusing on a company's fundamentals and, as such, may not match with a report on a company's
fundamentals. Investors are advised to refer the Fundamental and Technical Research Reports available on our website to evaluate the
contrary view, if any.
The information in this document has been printed on the basis of publicly available information, internal data and other reliable
sources believed to be true, but we do not represent that it is accurate or complete and it should not be relied on as such, as this
document is for general guidance only. Angel Broking Pvt. Limited or any of its affiliates/ group companies shall not be in any way
responsible for any loss or damage that may arise to any person from any inadvertent error in the information contained in this report.
Angel Broking Pvt. Limited has not independently verified all the information contained within this document. Accordingly, we cannot
testify, nor make any representation or warranty, express or implied, to the accuracy, contents or data contained within this document.
While Angel Broking Pvt. Limited endeavors to update on a reasonable basis the information discussed in this material, there may be
regulatory, compliance, or other reasons that prevent us from doing so.
This document is being supplied to you solely for your information, and its contents, information or data may not be reproduced,
redistributed or passed on, directly or indirectly.
Neither Angel Broking Pvt. Limited, nor its directors, employees or affiliates shall be liable for any loss or damage that may arise from
or in connection with the use of this information.
Disclosure of Interest Statement
ICICI Bank
1. Financial interest of research analyst or Angel or his Associate or his relative
No
2. Ownership of 1% or more of the stock by research analyst or Angel or associates or relatives
No
3. Served as an officer, director or employee of the company covered under Research
No
4. Broking relationship with company covered under Research
No
Ratings (Based on expected returns
Buy (> 15%)
Accumulate (5% to 15%)
Neutral (-5 to 5%)
over 12 months investment period):
Reduce (-5% to -15%)
Sell (< -15)
November 11, 2016
8