3QFY2016 Result Update | Metals
January 27, 2016
Hindustan Zinc
ACCUMULATE
CMP
`151
Volume growth drives outperformance
Target Price
`170
Investment Period
12 Months
Standalone (` cr)
3QFY16
3QFY15
yoy (%)
2QFY16
qoq%
Revenue
3,431
3,853
(11.0)
4,033
(14.9)
Stock Info
EBITDA
1,478
2,089
(29.2)
2,164
(31.7)
Sector
Metals/Mining
Margin (%)
43.1
54.2
(11pp)
53.7
(11pp)
Market Cap (` cr)
63,844
Reported PAT
1,811
2,379
(23.9)
2,285
(20.7)
Net Cash (` cr)
32,639
Source: Company, Angel Research
Beta
1.0
52 Week High / Low
190/117
For 3QFY2016, Hindustan Zinc (HZL) reported a 11% yoy decline in revenue to
Avg. Daily Volume
4,26,554
`3,385cr, in line with estimates, led by a 17% decline in zinc revenues as higher
Face Value (`)
2
volumes and rupee depreciation benefits were offset by lower realizations on
BSE Sensex
24,486
account of a decline in LME prices and zinc premiums. Mined metal production
Nifty
7,436
declined 13% yoy to 2,40,000MT. EBITDA for the quarter was also in line with
Reuters Code
HZNC.BO
expectation at `1,478cr, declining 29% yoy, led by lower LME prices and `84cr
Bloomberg Code
HZ IN
contribution towards the District Mineral Foundation (DMF). While depreciation
and finance expenses came in line with our expectations, lower tax rate resulted in
Shareholding Pattern (%)
the net profit coming in 9% ahead of expectations at `1,811cr.
Promoters
64.9
Management has maintained its guidance of a ~16% increase in refined metal
MF / Banks / Indian Fls
1.8
production volume for FY2016, despite a weaker mine plan in 4QFY2016.
FII / NRIs / OCBs
1.7
Management also indicated that the expansion projects remain on track, which
Indian Public / Govt / Others
31.6
should help drive volumes.
Outlook and valuation: We expect zinc prices to continue to decline going
Abs. (%)
3m 1yr
3yr
forward led by global headwinds. We have however retained our volume
Sensex
(10.5)
(15.8)
22.3
estimates, led by the healthy growth during the quarter. We reduce our FY2016
HZL
(10.4)
(12.0)
10.6
and FY2017 estimates in view of the higher than expected fall in realizations and
fall in zinc premiums. The stock is currently trading at 4.2x FY2017E EV/EBITDA.
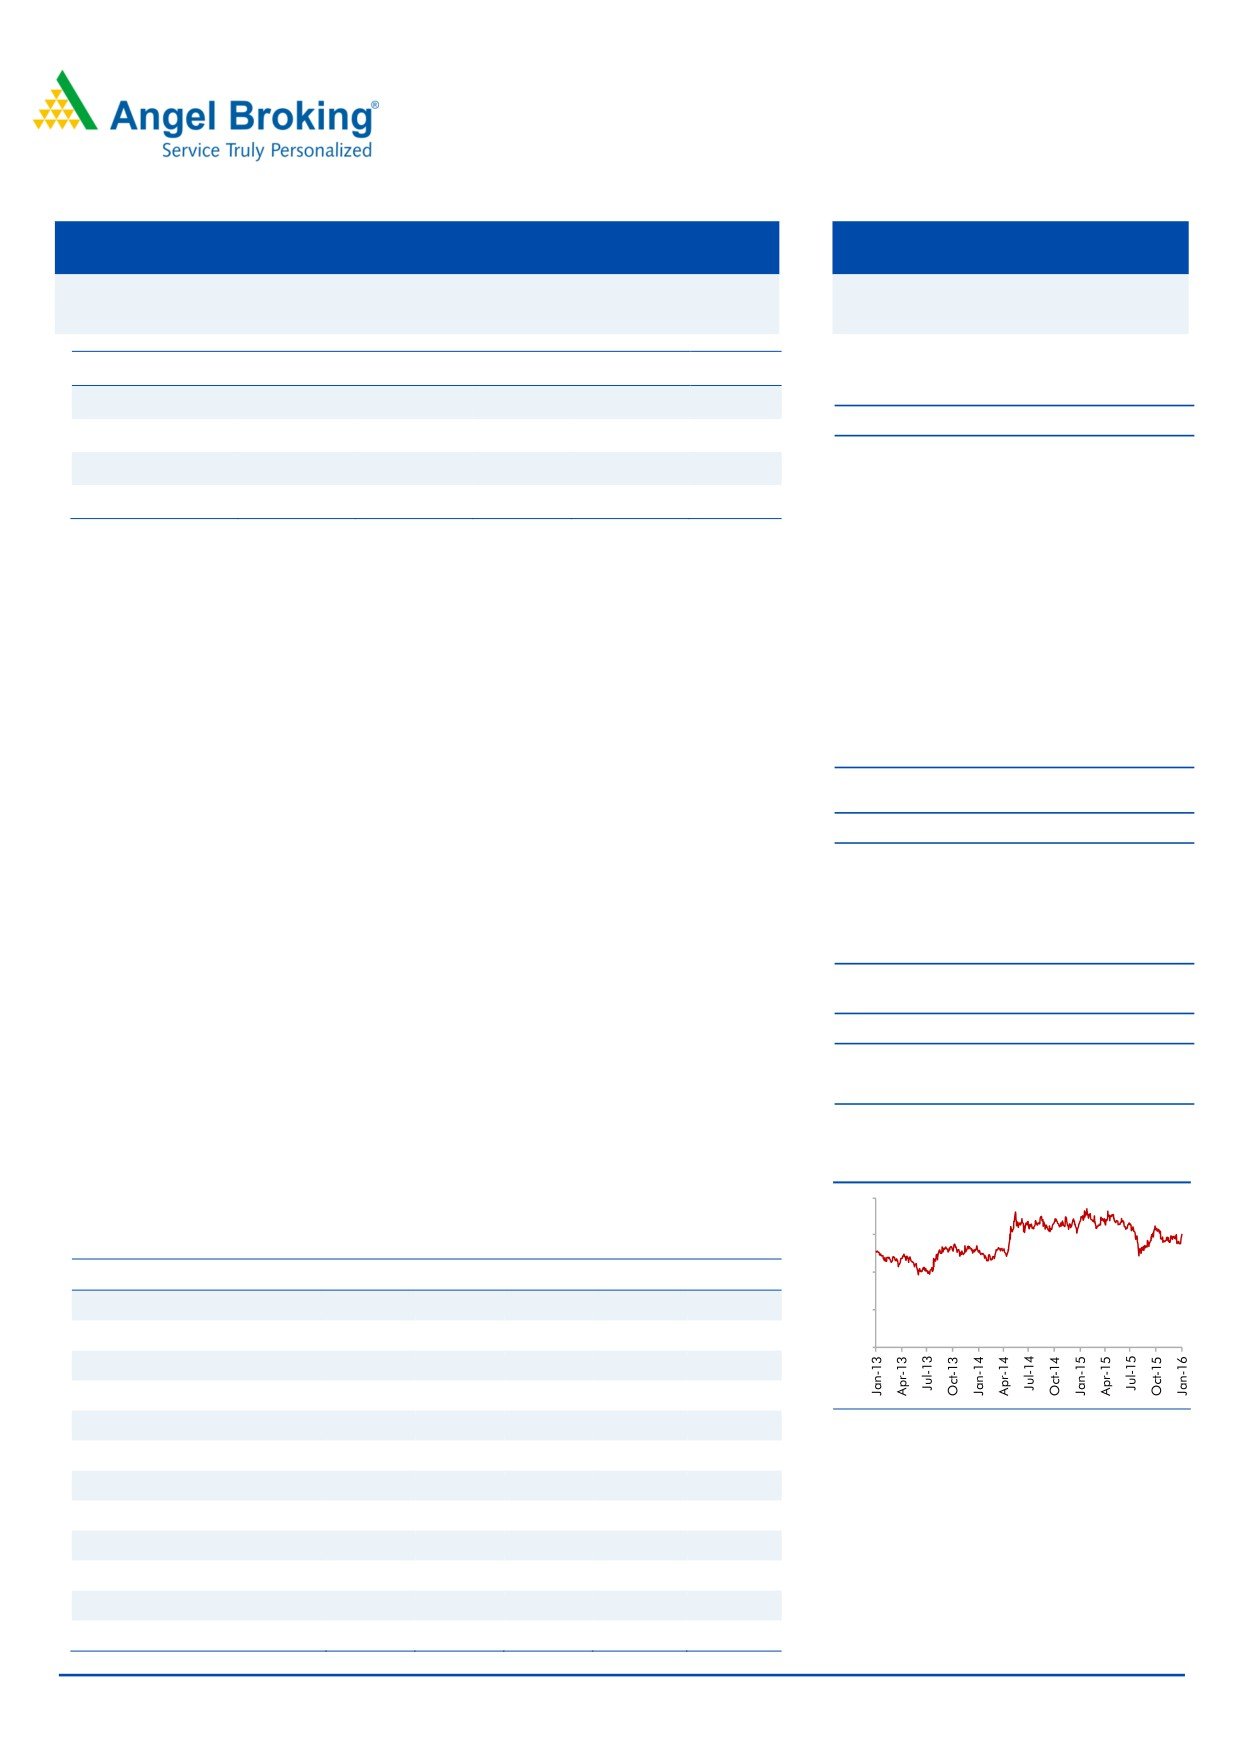
3-year price chart
We value the stock at 6x FY2017E EV/EBITDA and arrive at a target price of
200
`170. We retain our Accumulate rating on the stock.
150
Key financials (Standalone)
Y/E March (` cr)
FY2013
FY2014
FY2015
FY2016E FY2017E
100
Revenue
12,700
13,636
14,788
14,105
12,977
50
% chg
11.4
7.4
8.5
(4.6)
(8.0)
0
Adj. net profit
6,064
6,059
6,448
7,512
6,015
% chg
19.8
(0.1)
6.4
16.5
(19.9)
Source: Company, Angel Research
Adj. EPS (`)
14.4
14.3
15.3
17.8
14.2
OPM (%)
51.1
50.6
50.2
46.6
44.3
P/E (x)
9.2
9.2
7.8
8.5
10.6
P/BV (x)
2.0
1.7
1.5
1.3
1.2
RoE (%)
23.3
19.8
20.2
16.3
11.8
RoCE (%)
19.8
17.5
16.8
12.7
9.8
Rahul Dholam
EV/Sales (x)
3.3
2.8
2.2
2.1
2.1
Tel: 022- 3935 7800 Ext: 6847
EV/EBIDTA
6.5
5.5
4.5
4.5
4.6
Source: Company, Angel Research: Note CMP as of January 25, 2016
Please refer to important disclosures at the end of this report
1
Hindustan Zinc | 3QFY2016 Result Update
Exhibit 1: 3QFY2016 performance (Standalone)
(` cr)
3QFY16
3QFY15
yoy%
2QFY16
qoq%
9MFY16
9MFY15
yoy%
Net sales
3,385
3,804
(11.0)
3,908
(13.4)
10,889
10,516
3.6
Other operating income
45
49
(8.1)
125
(63.7)
205
147
39.2
Revenue
3,431
3,853
(11.0)
4,033
(14.9)
11,094
10,663
4.0
Manufacturing exp.
715
478
49.6
675
5.9
1,888
1,744
8.2
% of net sales
21.1
12.6
17.3
17.3
16.6
Selling & admin exp.
363
370
(1.7)
306
18.6
1,299
871
49.1
% of net sales
10.7
9.7
7.8
11.9
8.3
Other expenditure
874
917
(4.6)
888
(1.5)
2,604
2,609
(0.2)
% of net sales
25.8
24.1
22.7
23.9
24.8
Total expenditure
1,952
1,764
10.7
1,869
4.4
5,791
5,224
10.9
% of net sales
57.7
46.4
47.8
53.2
49.7
EBITDA
1,478
2,089
(29.2)
2,164
(31.7)
5,303
5,438
(2.5)
Margin (%)
43.1
54.2
(11pp)
53.7
(11pp)
47.8
51.0
(791bp)
Interest
5
1
546.8
1
322.3
8
10
(18.2)
Depreciation
172
209
(17.9)
175
(1.9)
520
617
(15.8)
Other income
555
812
(31.7)
869
(36.2)
1,987
2,226
(10.7)
Profit before tax
1,856
2,692
(31.0)
2,857
(35.0)
6,763
7,037
(3.9)
% of net sales
54.8
70.8
73.1
62.1
66.9
Tax
45
312
572
745
857
(13.0)
% of PBT
2.4
11.6
20.0
11.0
12.2
Reported net profit
1,811
2,379
(23.9)
2,285
(20.7)
6,017
6,181
(2.6)
Adjusted Net Profit
1,811
2,379
(23.9)
2,285
(20.7)
6,017
6,183
(2.7)
Source: Company, Angel Research
Exhibit 2: 3QFY2016 Actual vs. estimates
(` cr)
Actual
Estimates
Variation (%)
Net sales
3,385
3,384
-
EBITDA
1,478
1,471
0.5
EBITDA margin (%)
43.7
43.5
20bp
Net Profit
1,811
1,656
9.4
Source: Company, Angel Research
Result highlights
Better than expected volumes drive revenue
HZL reported a 11% yoy decline in revenue for the quarter at `3,385cr, in line with
estimates, led by a 17% decline in zinc revenues as higher volumes and rupee
depreciation benefits were offset by lower realizations on account of a decline in
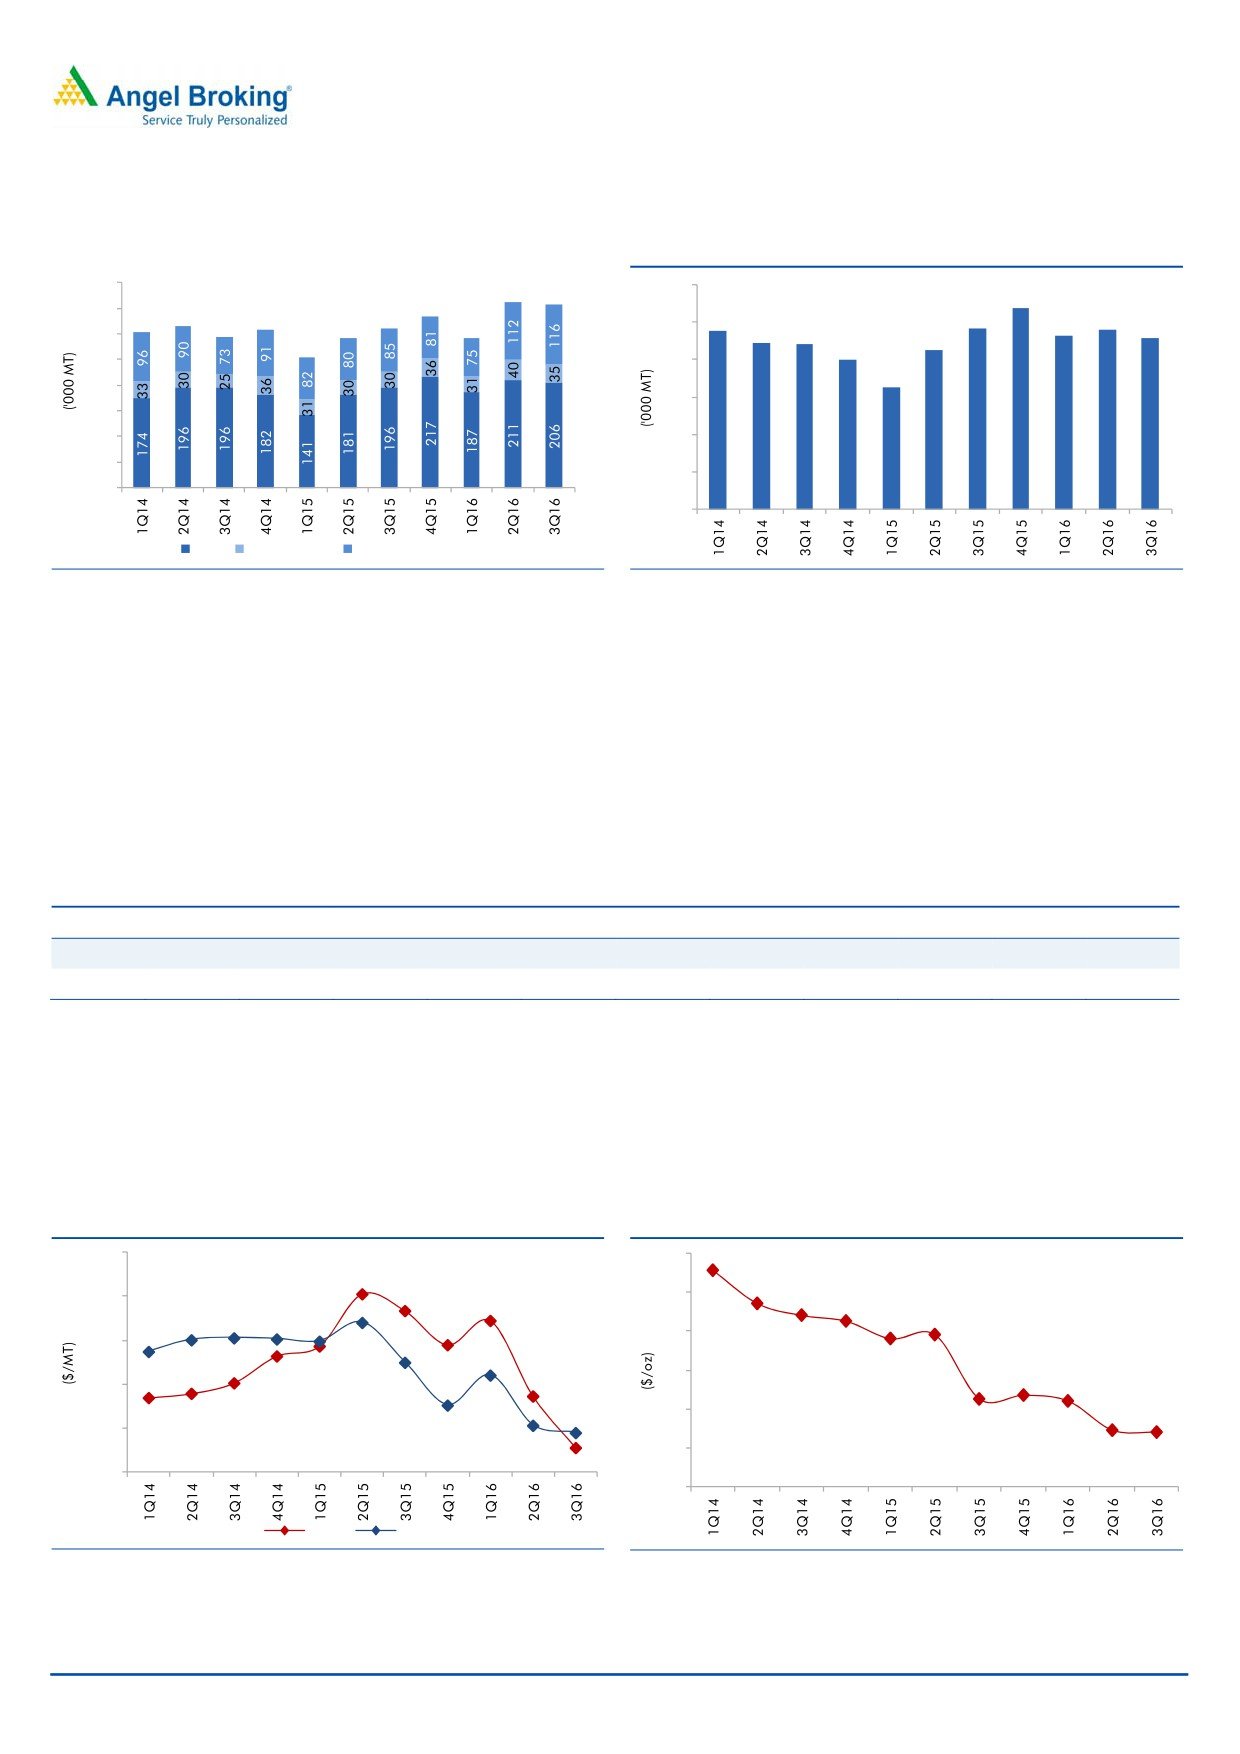
LME prices and zinc premiums. Mined metal production declined 13% yoy to
2,40,000MT led by increased contributions from Sindesar Khurd and Kayad
mines, resulting in lower average grades. Volume growth however continued to
remain strong with refined zinc production increasing 5% yoy at 2,06,000MT while
refined lead and silver production came in ahead of estimates. Refined lead
production increased 17% yoy to 35,000MT, while refined silver production
jumped 37% yoy to 116,000MT.
January 27, 2016
2
Hindustan Zinc | 3QFY2016 Result Update
Exhibit 3: Strong volume growth drives revenue growth
Exhibit 4: Mined metal production
300
400
269
350
242
240
250
238
232
228
222
220
300
213
200
250
200
163
200
150
150
100
100
50
50
0
0
Zinc
Refined Lead
Refined Saleable Silver
Source: Company, Angel Research
Source: Company, Angel Research
The EBITDA for the quarter was also in line with our expectation at `1,478cr,
declining 29% yoy, led by lower LME prices and `84cr contribution towards the
District Mineral Foundation (DMF). Depreciation and finance expenses came in line
with our expectation. Tax rate for 9MFY2016 stands at 11% on account of higher
proportion of tax efficient investment income and change in methodology of
accounting for long-term capital gain, with significant investments now becoming
long-term. The lower tax rate resulted in net profit coming in 9% ahead of our
expectation at `1,811cr.
Exhibit 5: EBITDA Margin jumps 212bp yoy
(` cr)
1Q14
2Q14
3Q14
4Q14
1Q15
2Q15
3Q15
4Q15
1Q16
2Q16
3Q16
EBITDA
1,498
1,822
1,824
1,755
1,352
1,997
2,089
1,978
1,660
2,164
1,478
Margin (%)
50.2
51.2
52.9
48.2
45.0
52.5
54.2
48.0
45.7
53.7
43.1
Source: Company, Angel Research
The Management has maintained its guidance for FY2016, despite a weaker mine
plan in 4QFY2016. The ongoing expansion projects also remain on track with
16km of mine development during the quarter, 55% higher than the 3QFY2015
and an all time record for the company.
Exhibit 6: Zinc & Lead Prices continue to decline
Exhibit 7: Silver prices down 10% yoy
2500
24
2300
22
20
2100
18
1900
16
1700
14
1500
12
Zinc
Lead
Source: Company, Angel Research
Source: Company, Angel Research
January 27, 2016
3
Hindustan Zinc | 3QFY2016 Result Update
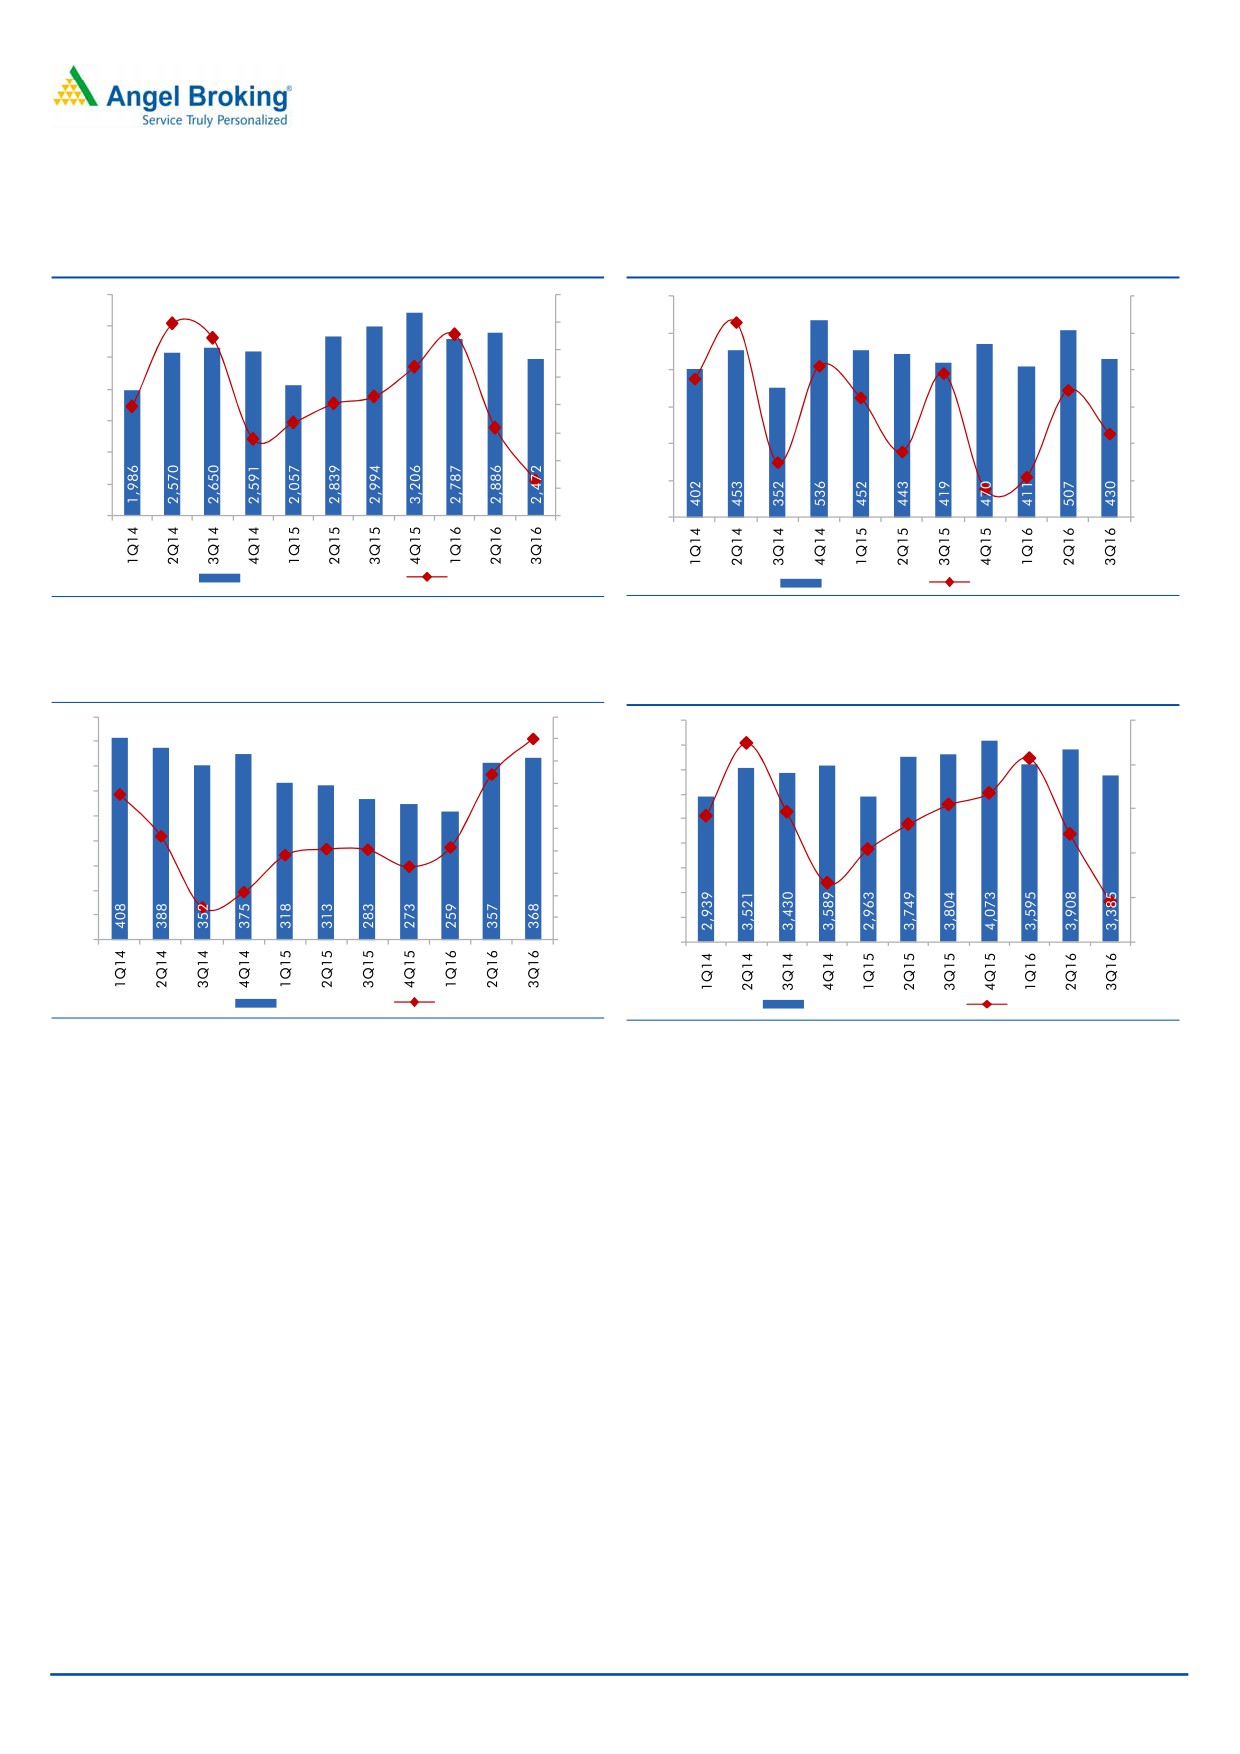
Exhibit 8: Zinc revenue declines 17% yoy
Exhibit 9: Lead revenue remains flat yoy
3,500
50%
600
40%
3,000
40%
500
30%
30%
2,500
400
20%
20%
2,000
10%
300
10%
1,500
0%
200
0%
1,000
-10%
500
100
-10%
-20%
0
-30%
0
-20%
Zinc Revenue (` Cr)
yoy (%)
Lead (` Cr)
yoy (%)
Source: Company, Angel Research
Source: Company, Angel Research
Exhibit 10: Silver volumes jump 37% yoy
Exhibit 11: Lower zinc premiums drag revenue
450
40%
4,500
30%
400
30%
4,000
20%
20%
350
3,500
10%
300
3,000
0%
10%
250
2,500
-10%
200
2,000
-20%
0%
150
1,500
-30%
100
1,000
-40%
-10%
50
-50%
500
0
-60%
0
-20%
Silver (` Cr)
yoy (%)
Total Sales (` Cr)
yoy (%)
Source: Company, Angel Research
Source: Company, Angel Research
Production growth at Sindesar Khurd mine crossed the 3MTPA run rate during the
quarter, well ahead of schedule. The mill debottlenecking project has also been
completed in-line with the mine production and the company has commenced a
new mill project with a capacity of 1.5 MTPA during the quarter and is expected to
be commissioned in 4QFY2017. The shaft sinking project continues to be ahead of
plan. Despite a slowdown due to much higher rock support and safety precautions
at Rampura Agucha, the main shaft sinking project crossed 860 meters during the
quarter of the ultimate depth of 950 meters. The ramp-up of Kayad mine also
remains on track and is expected to achieve 1 MTPA production capacity run rate
by this year-end, making it one of the fastest underground mine ramp-ups. In light
of the challenging environment for metals, the company is reviewing the Zawar
and Rajpura Dariba Mine expansion projects.
The Management expects zinc demand to grow at a compounded average annual
run rate of 2% per annum with the fundamentals of zinc continuing to remain
strong on the back of planned mine closures and medium-term supply shortages.
However, the weak sentiment and nervousness related to the slowdown in China
are dragging prices down contrary to the emerging demand supply imbalances in
zinc.
January 27, 2016
4
Hindustan Zinc | 3QFY2016 Result Update
Investment arguments
Volume growth to remain strong
HZL’s Management has guided for a ~16% increase in refined metal production
volumes in FY2016, led by the strong performance in 2QFY2016. The
Management expects total integrated silver production to be 375,000MT in
FY2016. The Management also indicated that the expansion projects remain on
track, which should help the company drive volumes. The Management had kept
the capex guidance unchanged at ~$200-$225mn, including sustenance capex.
We expect these capacity expansions to help the company offset the pressure from
falling realizations.
Zinc prices may continue to remain under pressure
We believe with the slowdown in China and in overall steel demand, it will be
difficult for zinc prices to firm up over the coming years. Our outlook for zinc prices
continues to remain negative and we are not factoring any improvement in prices
over FY2015-17, leading to a 5%/8% decline in revenue in FY2016 and FY2017,
respectively. Led by the decline in revenue, we expect the EBITDA to decline by
~11-12% in FY2016 and FY2017, respectively.
January 27, 2016
5
Hindustan Zinc | 3QFY2016 Result Update
Outlook and valuation
We expect zinc prices to continue to decline going forward led by global
headwinds. We have however retained our volume estimates, led by the healthy
growth during the quarter. We reduce our FY2016 and FY2017 estimates in view
of the higher than expected fall in realizations and fall in zinc premiums. The stock
is currently trading at 4.2x FY2017E EV/EBITDA. We value the stock at 6x FY2017E
EV/EBITDA and arrive at a target price of `170. We retain our Accumulate rating
on the stock.
Exhibit 12: Valuation (FY2017E)
(` cr)
Adj. EBITDA
5,750
Multiple (x)
6
Total EV
34,492
Net Cash
37,112
Equity Value
71,604
Target price (`)
170
Source: Angel Research
Company background
Hindustan Zinc is one of the world's largest integrated producers of zinc and is
among the leading global lead and silver producers. With reserves and resources
of 375.1mn tonne, the company is one of the lowest cost producers in the world
and is well placed to serve the growing demand in Asia. Hindustan Zinc is a
subsidiary of the London listed diversified metals and mining major, Vedanta
Resources plc.
January 27, 2016
6
Hindustan Zinc | 3QFY2016 Result Update
Profit & Loss Statement (Standalone)
Y/E March (` cr)
FY2013
FY2014
FY2015
FY2016E FY2017E
Net Sales
12,700
13,636
14,788
14,105
12,977
Other operating income
0
0
0
0
0
Total operating income
12,700
13,636
14,788
14,105
12,977
% chg
11.4
7.4
8.5
(4.6)
(8.0)
Total Expenditure
6,209
6,736
7,372
7,538
7,228
Manufacturing Expenses
4,753
5,134
5,375
5,866
5,658
Selling & General Expenses
1,338
1,557
1,919
1,672
1,570
Other Expenses
118
45
78
0
0
EBITDA
6,491
6,900
7,417
6,567
5,749
% chg
7.7
6.3
7.5
(11.5)
(12.5)
(% of Net Sales)
51.1
50.6
50.2
46.6
44.3
Depreciation& Amortisation
647
785
644
691
766
EBIT
5,844
6,115
6,773
5,875
4,982
% chg
7.9
4.6
10.7
(13.2)
(15.2)
(% of Net Sales)
46.0
44.8
45.8
41.7
38.4
Interest & other Charges
27
45
24
13
16
Other Income
2,003
1,899
2,821
2,633
2,370
Profit before tax
7,820
7,970
9,570
8,495
7,336
% chg
12.6
1.9
20.1
(11.2)
(13.6)
Tax Expense
921
1,065
1,392
983
1,320
(% of PBT)
11.8
13.4
14.5
11.6
18.0
Recurring PAT
6,899
6,905
8,178
7,512
6,015
Adjusted PAT
6,064
6,059
6,448
7,512
6,015
% chg
19.8
(0.1)
6.4
16.5
(19.9)
(% of Net Sales)
47.7
44.4
43.6
53.3
46.4
January 27, 2016
7
Hindustan Zinc | 3QFY2016 Result Update
Balance Sheet (Standalone)
Y/E March (` cr)
FY2013
FY2014
FY2015
FY2016E FY2017E
SOURCES OF FUNDS
Equity Share Capital
845
845
845
845
845
Reserves & Surplus
31,431
36,573
42,508
48,034
51,937
Shareholders Funds
32,276
37,418
43,353
48,879
52,782
Total Loans
0
0
0
0
0
Deferred Tax Liability
1,280
1,658
2,519
2,997
3,314
Other Long term liabilities
28
56
132
152
182
Total Liabilities
33,584
39,132
46,004
52,027
56,278
APPLICATION OF FUNDS
Gross Block
12,281
13,600
14,551
16,051
17,551
Less: Acc. Depreciation
3,797
4,453
5,104
5,796
6,562
Net Block
8,484
9,147
9,446
10,255
10,989
Capital Work-in-Progress
1,082
1,541
2,005
2,105
2,210
Investments
14,540
22,506
27,254
31,342
35,103
Current Assets
9,222
5,543
5,950
5,948
4,631
Cash
6,942
3,031
3,532
3,197
2,009
Inventories
1,111
1,198
1,212
1,411
1,298
Debtor
403
400
659
705
649
Other
766
914
548
635
675
Current liabilities
1,882
2,545
2,988
2,609
2,141
Net Current Assets
7,341
2,998
2,962
3,338
2,490
Other Assets
2,137.5
2,939.4
4,337.3
4,987.9
5,486.7
Total Assets
33,584
39,132
46,004
52,027
56,278
January 27, 2016
8
Hindustan Zinc | 3QFY2016 Result Update
Cash flow statement (Standalone)
Y/E March (` cr)
FY2013
FY2014
FY2015
FY2016E FY2017E
Profit before tax
7,820
7,970
9,570
8,495
7,336
Depreciation
647
785
645
691
766
Change in Working Capital
(984)
(505)
(187)
(711)
(339)
Others
(1,087)
(1,133)
(2,463)
(631)
(468)
Direct taxes paid
(1,611)
(1,645)
(2,033)
(505)
(1,003)
Cash Flow from Operations
4,785
5,471
5,531
7,340
6,291
(Inc.)/ Dec. in Fixed Assets
(1,753)
(1,709)
(1,611)
(1,600)
(1,605)
(Inc.)/ Dec. in Investments
(629)
(6,825)
(2,285)
(4,088)
(3,761)
Others
(888)
4,578
89
-
-
Cash Flow from Investing
(3,269)
(3,955)
(3,807)
(5,688)
(5,366)
Issue of Equity
-
-
-
-
-
Inc./(Dec.) in loans
-
-
-
-
-
Dividend Paid (Incl. Tax)
(1,228)
(1,532)
(1,879)
(1,986)
(2,113)
Others
(27)
(45)
(24)
-
-
Cash Flow from Financing
(1,255)
(1,577)
(1,902)
(1,986)
(2,113)
Inc./(Dec.) in Cash
261
(62)
(178)
(334)
(1,188)
Opening Cash balances
29
290
228
3,532
3,197
Closing Cash balances
290
228
50
3,197
2,009
January 27, 2016
9
Hindustan Zinc | 3QFY2016 Result Update
Key ratios
Y/E March
FY2013
FY2014
FY2015
FY2016E FY2017E
Per Share Data (`)
Reported EPS
16.3
16.3
19.4
17.8
14.2
Adjusted EPS
14.4
14.3
15.3
17.8
14.2
Cash EPS
17.9
18.2
20.9
19.4
16.1
DPS
3.1
3.5
4.4
4.7
5.0
Book Value
76.4
88.6
102.6
115.7
124.9
Valuation Ratio (x)
P/E (on FDEPS)
9.2
9.2
7.8
8.5
10.6
P/CEPS
8.5
8.3
7.2
7.8
9.4
P/BV
2.0
1.7
1.5
1.3
1.2
Dividend yield (%)
2.1
2.3
2.9
3.1
3.3
EV/Sales
3.3
2.8
2.2
2.1
2.1
EV/EBITDA
6.5
5.5
4.5
4.5
4.6
EV/Total Assets
1.3
1.0
0.7
0.6
0.5
Returns (%)
ROCE
19.8
17.5
16.8
12.7
9.8
ROE
23.3
19.8
20.2
16.3
11.8
Turnover ratios (x)
Asset Turnover (Gross Block)
1.1
1.1
1.1
0.9
0.8
Inventory (days)
27.4
30.9
29.7
33.9
38.1
Receivables (days)
10.6
10.7
13.1
17.6
19.0
Payables (days)
48.3
59.2
68.3
72.4
66.8
WC cycle (ex-cash) (days)
8.7
4.9
(7.4)
(5.5)
8.7
January 27, 2016
10
Hindustan Zinc | 3QFY2016 Result Update
Research Team Tel: 022 - 39357800
DISCLAIMER
Angel Broking Private Limited (hereinafter referred to as “Angel”) is a registered Member of National Stock Exchange of India Limited,
Bombay Stock Exchange Limited and Metropolitan Stock Exchange of India Limited. It is also registered as a Depository Participant with
CDSL and Portfolio Manager with SEBI. It also has registration with AMFI as a Mutual Fund Distributor. Angel Broking Private Limited is
a registered entity with SEBI for Research Analyst in terms of SEBI (Research Analyst) Regulations, 2014 vide registration number
INH000000164. Angel or its associates has not been debarred/ suspended by SEBI or any other regulatory authority for accessing
/dealing in securities Market. Angel or its associates including its relatives/analyst do not hold any financial interest/beneficial
ownership of more than 1% in the company covered by Analyst. Angel or its associates/analyst has not received any compensation /
managed or co-managed public offering of securities of the company covered by Analyst during the past twelve months. Angel/analyst
has not served as an officer, director or employee of company covered by Analyst and has not been engaged in market making activity
of the company covered by Analyst.
This document is solely for the personal information of the recipient, and must not be singularly used as the basis of any investment
decision. Nothing in this document should be construed as investment or financial advice. Each recipient of this document should
make such investigations as they deem necessary to arrive at an independent evaluation of an investment in the securities of the
companies referred to in this document (including the merits and risks involved), and should consult their own advisors to determine
the merits and risks of such an investment.
Reports based on technical and derivative analysis center on studying charts of a stock's price movement, outstanding positions and
trading volume, as opposed to focusing on a company's fundamentals and, as such, may not match with a report on a company's
fundamentals.
The information in this document has been printed on the basis of publicly available information, internal data and other reliable
sources believed to be true, but we do not represent that it is accurate or complete and it should not be relied on as such, as this
document is for general guidance only. Angel Broking Pvt. Limited or any of its affiliates/ group companies shall not be in any way
responsible for any loss or damage that may arise to any person from any inadvertent error in the information contained in this report.
Angel Broking Pvt. Limited has not independently verified all the information contained within this document. Accordingly, we cannot
testify, nor make any representation or warranty, express or implied, to the accuracy, contents or data contained within this document.
While Angel Broking Pvt. Limited endeavors to update on a reasonable basis the information discussed in this material, there may be
regulatory, compliance, or other reasons that prevent us from doing so.
This document is being supplied to you solely for your information, and its contents, information or data may not be reproduced,
redistributed or passed on, directly or indirectly.
Neither Angel Broking Pvt. Limited, nor its directors, employees or affiliates shall be liable for any loss or damage that may arise from
or in connection with the use of this information.
Note: Please refer to the important ‘Stock Holding Disclosure' report on the Angel website (Research Section). Also, please refer to the
latest update on respective stocks for the disclosure status in respect of those stocks. Angel Broking Pvt. Limited and its affiliates may
have investment positions in the stocks recommended in this report.
Disclosure of Interest Statement
Hindustan Zinc
1. Analyst ownership of the stock
No
2. Angel and its Group companies ownership of the stock
No
3. Angel and its Group companies' Directors ownership of the stock
No
4. Broking relationship with company covered
No
Note: We have not considered any Exposure below ` 1 lakh for Angel, its Group companies and Directors
Ratings (Based on expected returns
Buy (> 15%)
Accumulate (5% to 15%)
Neutral (-5 to 5%)
over 12 months investment period):
Reduce (-5% to -15%)
Sell (< -15)
January 27, 2016
11