2QFY2016 Result Update | Media
October 27, 2015
Hindustan Media Ventures
NEUTRAL
CMP
`275
Performance Highlights
Target Price
-
Quarterly Data
Investment Period
-
(` cr)
2QFY16
2QFY15
% yoy
1QFY15
% qoq
Revenue
227
200
13.7
224
1.4
Stock Info
EBITDA
52
39
33.1
55
(4.5)
Sector
Media
Margin (%)
22.9
19.6
334bp
24.4
(142bp)
Market Cap (` cr)
2,048
Reported PAT
45
31
43.1
42
8.0
Net Debt (` cr)
576
Source: Company, Angel Research
Beta
0.8
52 Week High / Low
289 / 168
For 2QFY2016, Hindustan Media Ventures Ltd (HMVL) reported earnings above
Avg. Daily Volume
20,623
our estimates. The top-line growth was healthy with strong growth in advertising
Face Value (`)
10
and circulation revenue. Advertising revenue growth for the quarter was strong due to
BSE Sensex
27,253
pick-up in ad spends by industries. On the operating front, the company’s performance
Nifty
8,233
was strong, which led to a higher PAT growth.
Reuters Code
HINS.BO
Strong growth in ad and circulation revenue: HMVL registered a growth of ~18%
Bloomberg Code
HMVL@IN
yoy in advertising revenue to ~`168cr, on back of increase in advertising yields
and volumes. Further, the company reported a ~8% yoy growth in circulation revenue
Shareholding Pattern (%)
to `53cr on back of higher circulation as well as realization per copy.
Promoters
74.9
Higher PAT on back of strong operating performance: The company reported a
MF / Banks / Indian Fls
13.1
strong PAT growth of ~43% yoy due to strong operating performance. The
FII / NRIs / OCBs
5.4
operating performance was strong on account of lower cost of news print which is
Indian Public / Others
6.6
a key raw material for HMVL.
Outlook and valuation: Going forward, we believe that the company would
Abs. (%)
3m 1yr
3yr
perform well, both on the top-line and bottom-line fronts, on back of strong
Sensex
0.6
1.9
46.3
recovery in the Indian economy. Further, we expect strong growth in both
HMVL
13.1
13.1
127.3
advertising and circulation revenue due to the company’s strong presence in the
states of Uttar Pradesh, Uttarakhand, Bihar and Jharkhand. Further, HT Media is
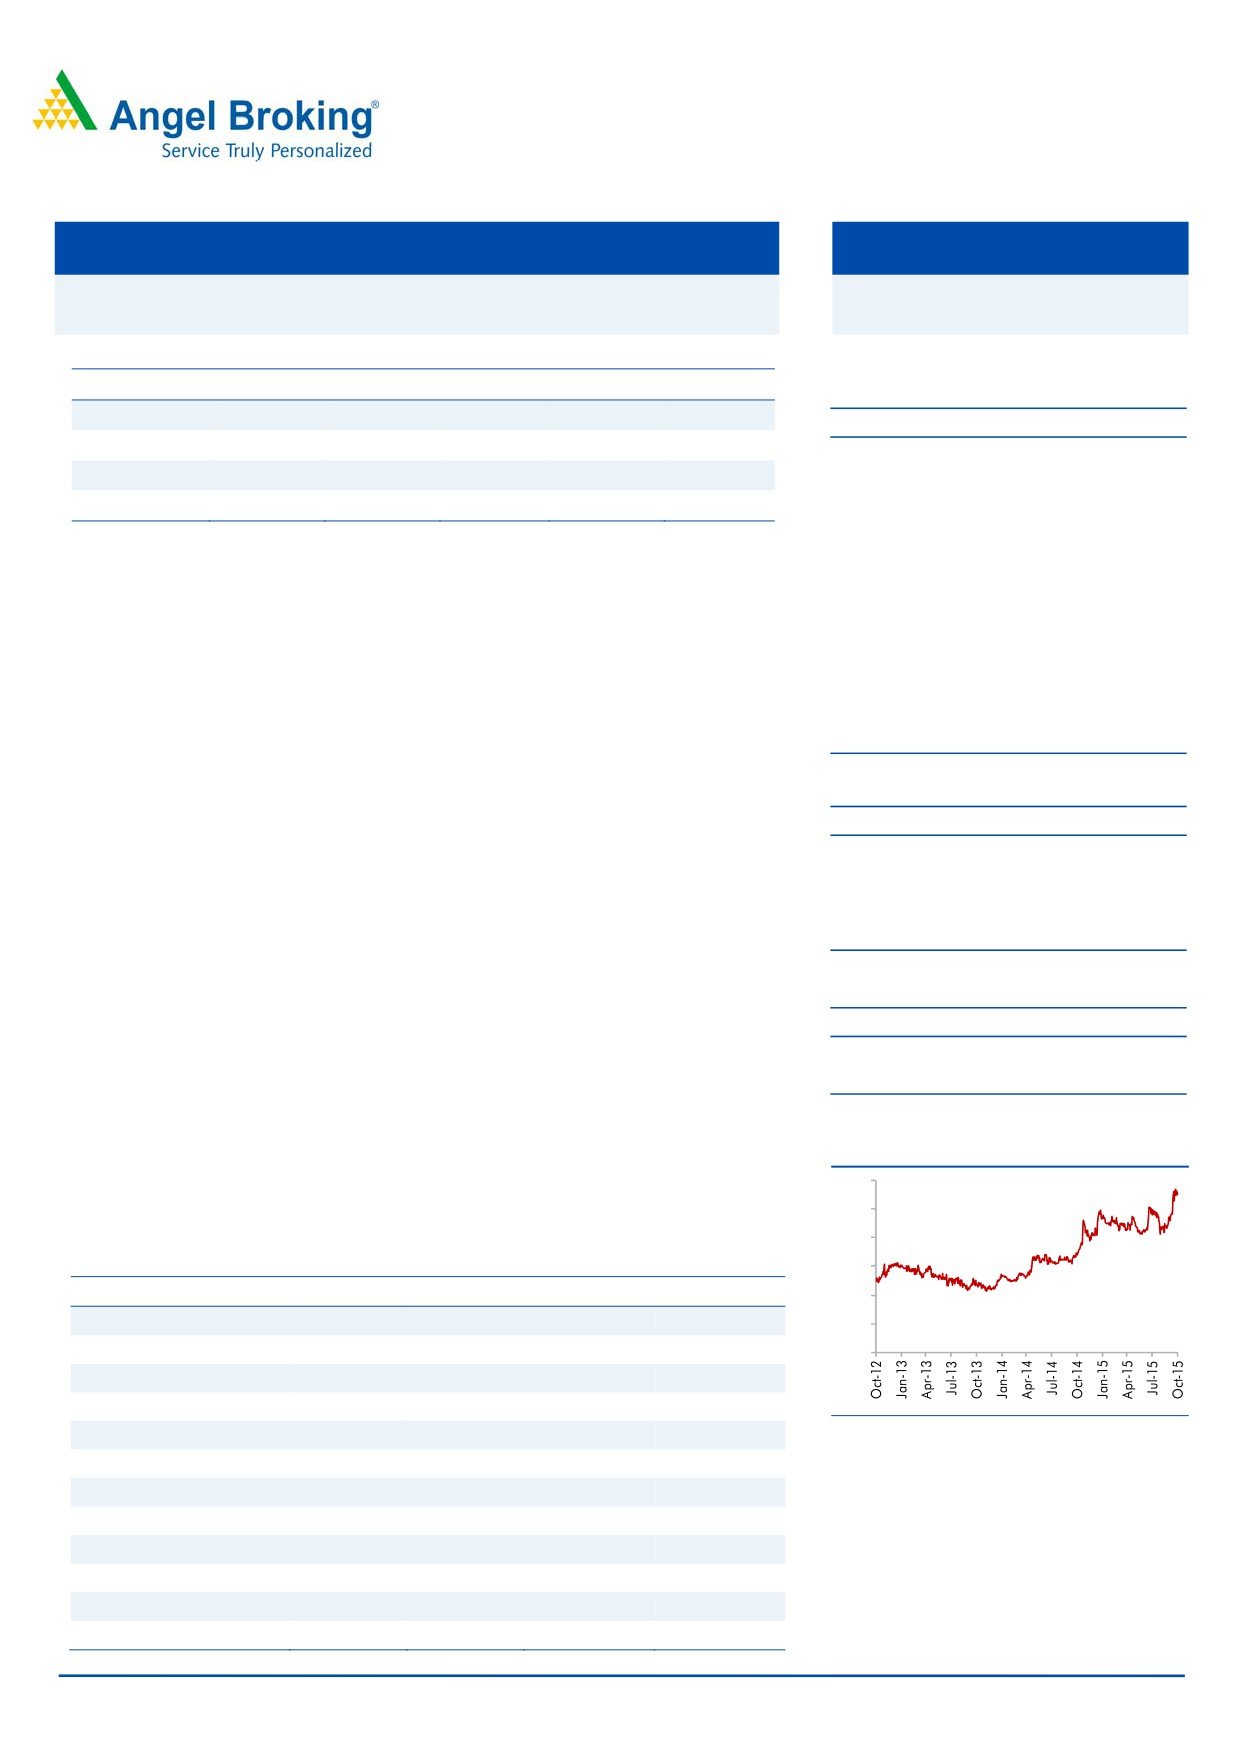
3-year price chart
hiving off its online content business to Hindustan Media Ventures. We are awaiting
300
further clarifications on the deal from the Management in order to assess its financial
250
implications. Until then, we retain our Neutral rating on the stock.
200
Key financials (Consolidated)
150
Y/E March (` cr)
FY2014
FY2015
FY2016E
FY2017E
100
Net Sales
730
819
907
1,008
50
% chg
14.7
12.2
10.8
11.2
0
Net Profit (Adj.)
111
141
145
155
% chg
31.6
26.7
3.2
6.3
Source: Company, Angel Research
EBITDA margin (%)
20.7
20.3
20.2
20.2
EPS (`)
15.2
19.2
19.8
21.1
P/E (x)
16.7
13.2
12.8
12.0
P/BV (x)
3.0
2.5
2.1
1.8
RoE (%)
18.3
19.0
16.6
15.1
RoCE (%)
20.6
16.9
15.9
15.3
Amarjeet S Maurya
EV/Sales (x)
2.0
1.7
1.5
1.2
022-39357800 Ext: 6831
EV/EBITDA (x)
9.8
8.2
7.3
6.2
Source: Company, Angel Research; Note: CMP as of October 27, 2015
Please refer to important disclosures at the end of this report
1
Hindustan Media Ventures | 2QFY2016 Result Update
Exhibit 1: Quarterly performance
Y/E March (` cr)
2QFY16
2QFY15
% yoy
1QFY16
% qoq
FY2015
FY2014
% chg
Net Sales
226.92
199.54
13.7
223.72
1.4
819
730
12.2
Consumption of RM
86
85
1.6
84
2.3
338
301
12.3
(% of Sales)
38.0
42.5
37.6
41.2
41.2
Staff Costs
30
26
15.9
29
4.0
107
87
23.4
(% of Sales)
13.2
12.9
12.8
13.0
11.9
Other Expense
59
50
17.9
56
4.5
208
191
8.5
(% of Sales)
25.9
25.0
25.2
25.4
26.2
Total Expenditure
175
160
9.0
169
3.3
652
578
12.7
Operating Profit
52
39
33.1
55
(4.5)
166
151
10.1
OPM (%)
22.9
19.6
24.4
20.3
20.7
Interest
3
3
5.2
3
5.9
11
6
Depreciation
5
6
(17.4)
6
(3.1)
24
22
12.8
Other Income
19
12
57.7
12
63.0
56
31
84.6
PBT
63
42
49.9
58
8.5
188
155
21.7
(% of Sales)
27.6
21.0
25.8
23.0
21.2
Provision for Taxation
18
10
70.5
16
9.9
47
43
8.9
(% of PBT)
28.2
24.8
27.8
25.1
28.0
Minority Interest
0
0
Recurring PAT
45
31
43.1
42
8.0
141
111
26.7
PATM
19.8
15.8
18.6
17.2
15.2
Exceptional items
0
0
Reported PAT
45
31
43.1
42
8.0
141
111
26.7
Equity shares (cr)
7.3
7.3
7.3
7.3
7.3
FDEPS (`)
6.1
4.3
43.1
5.7
8.0
19.2
15.2
26.7
Source: Company, Angel Research
October 27, 2015
2
Hindustan Media Ventures | 2QFY2016 Result Update
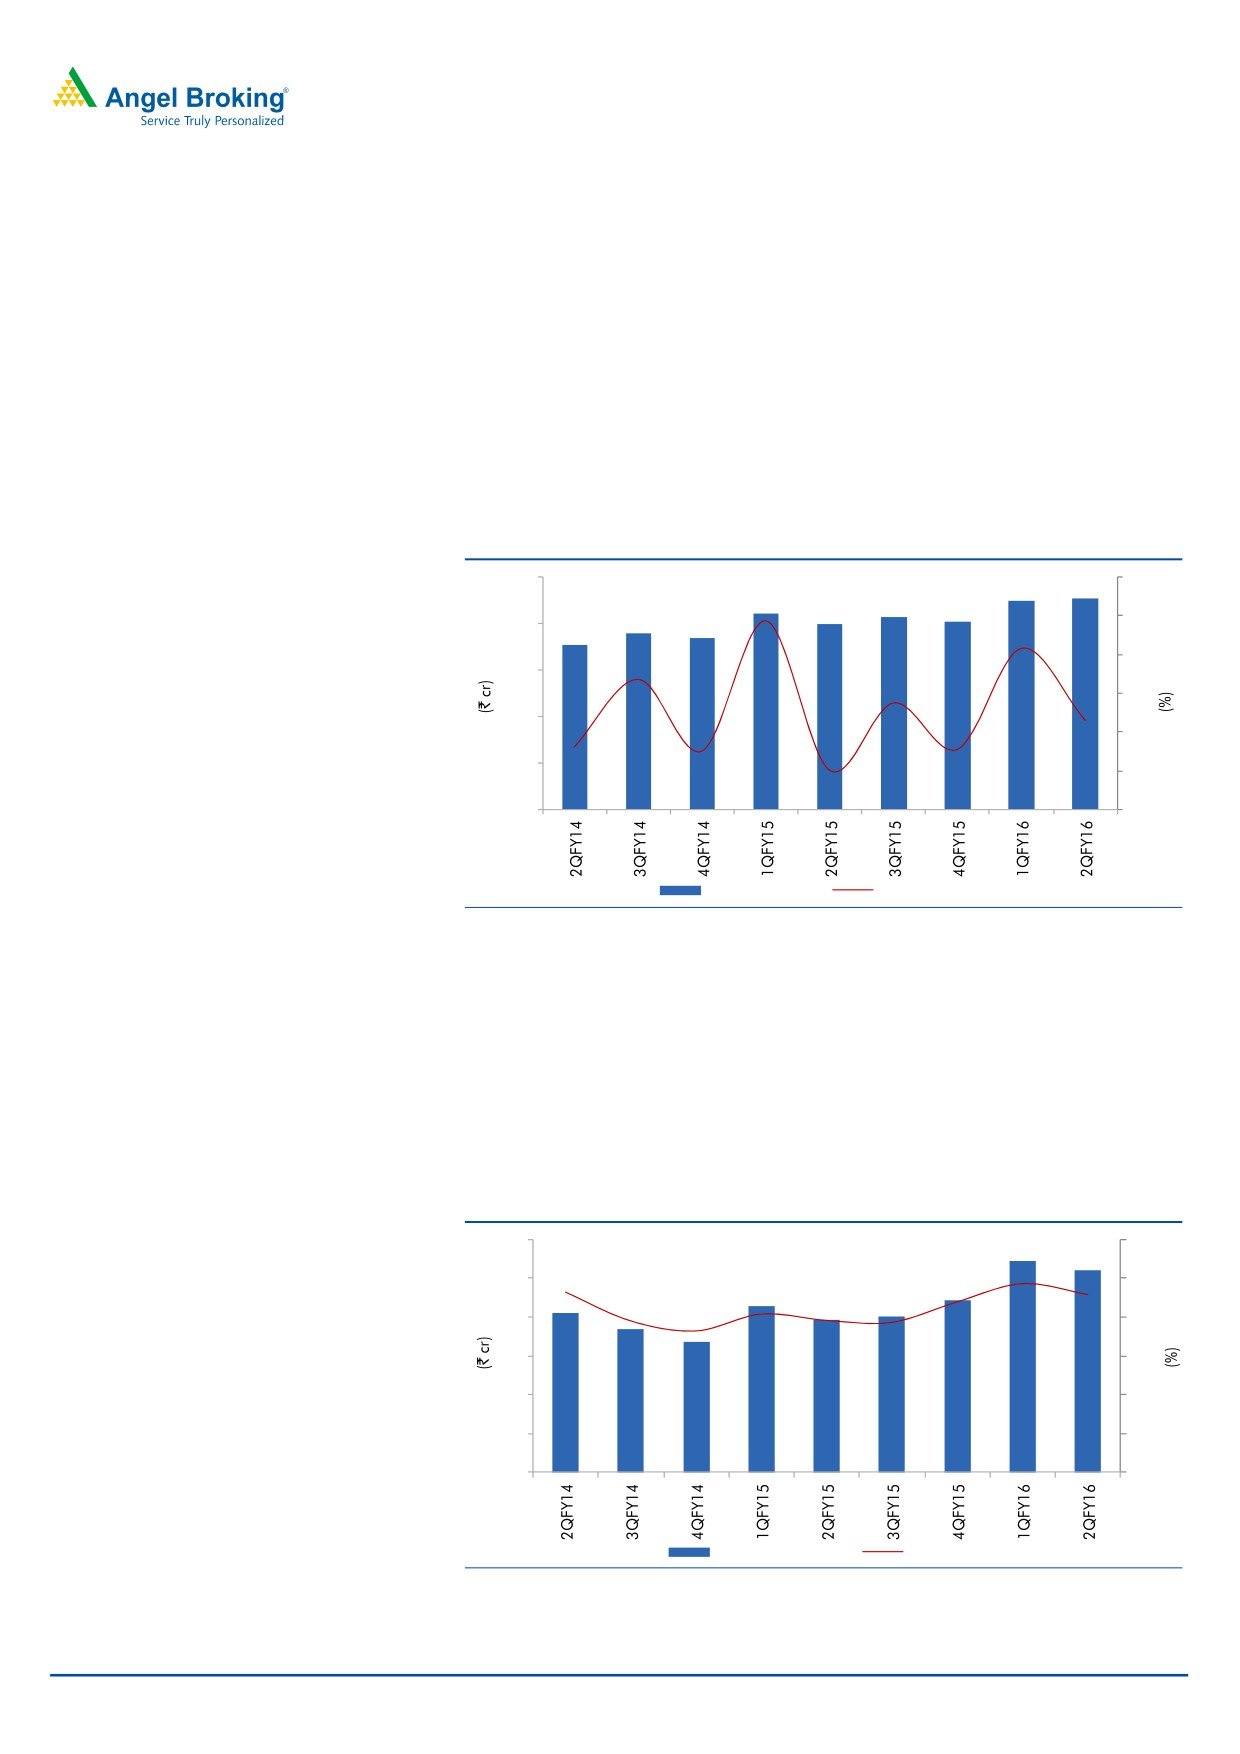
Strong top-line growth
For 2QFY2016, HMVL reported a healthy top-line growth of ~14% yoy to
~`227cr (excluding other income), owing to growth in advertising and circulation
revenue. Overall, the company registered a ~18% yoy growth in advertising
revenue to ~`168cr, primarily due to increase in advertising yields and volumes.
Further, the company reported a ~8% yoy growth in circulation revenue to ~`53cr
on back of higher circulation and realization per copy. During the quarter, there
was an increase in ad spend by companies in several sectors (barring education
and real estate sectors). Moreover, the company expects an improvement in
circulation revenue owing to its strong presence in the states of Uttar Pradesh and
Uttarakhand, and continuing dominance in Bihar and Jharkhand.
Exhibit 2: Top-line growth trend
250
20
15
200
10
150
5
100
0
50
(5)
0
(10)
Net Sales
QoQ growth (%)
Source: Company, Angel Research
Strong operating performance due to lower material costs
For the quarter, the company reported an operating profit of
~`52cr, up
~33% yoy. The operating margin expanded by a significant 334bp yoy on account of
lower raw material costs as a percentage of sales which were down 452bp yoy due to
decline in cost of news print which is a key raw material for HMVL. Going forward, the
Management expects margins to be better due to lower news print costs and with it
following an effective cost management strategy.
Exhibit 3: Operating profit and margin trend
60
30
50
25
40
20
30
15
20
10
10
5
0
0
Operating Profit
Margin (%)
Source: Company, Angel Research
October 27, 2015
3
Hindustan Media Ventures | 2QFY2016 Result Update
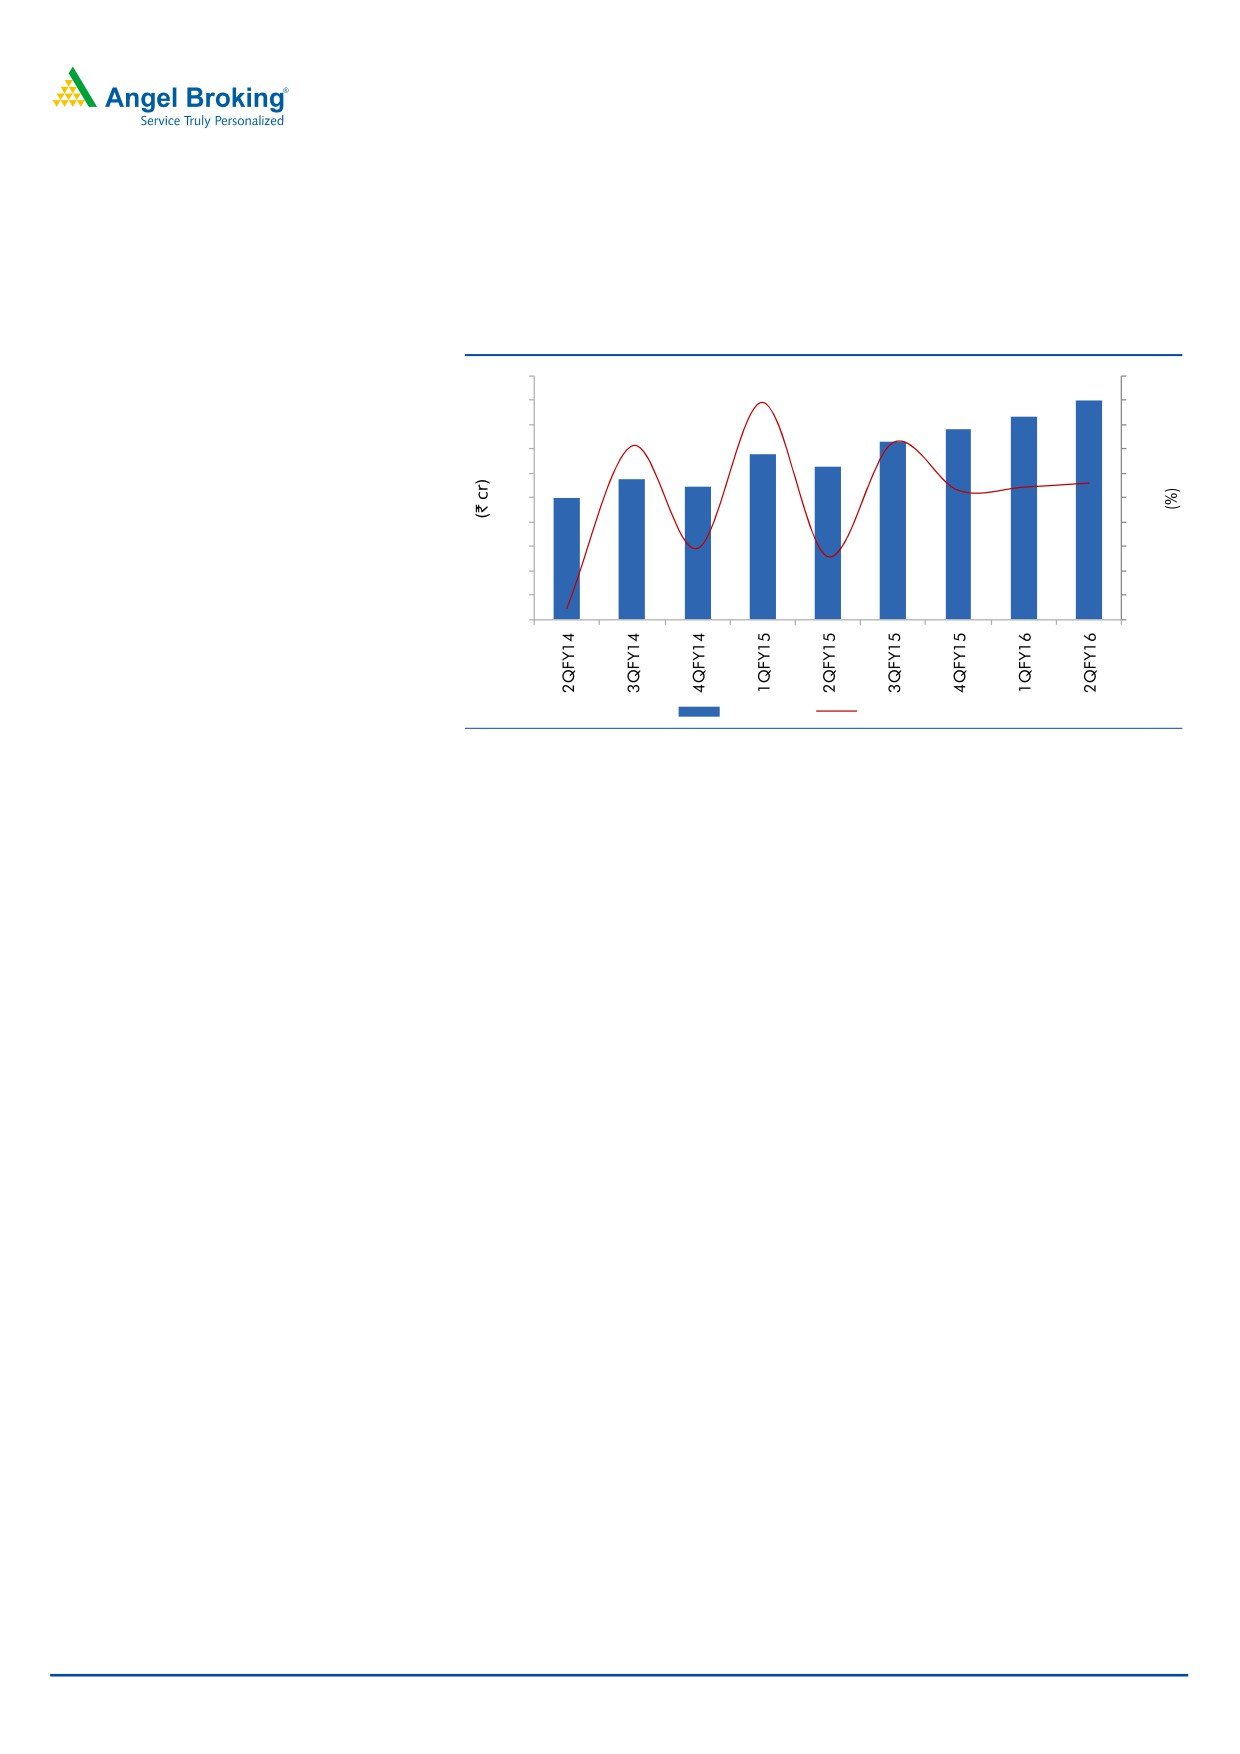
Higher PAT growth on back of strong operating performance
The company has reported strong PAT growth for the quarter of ~43% yoy to
`45cr due to strong operating performance and higher other income.
Exhibit 4: Net Profit and growth trend
50
30
45
25
40
20
35
15
30
10
25
5
20
0
15
(5)
10
(10)
5
(15)
0
(20)
Net Profit
QOQ growth (%)
Source: Company, Angel Research
October 27, 2015
4
Hindustan Media Ventures | 2QFY2016 Result Update
Investment rationale
Robust advertising revenue growth expected to continue
The combination of increase in advertising volume as well as yield has resulted in
a healthy double-digit advertising revenue growth for the company in the last few
quarters. The company reported a double-digit advertising revenue growth in Bihar
and Jharkhand and strong growth in advertising revenue in Uttar Pradesh, which
resulted in a healthy top-line growth for FY2015.
According to the Management, double-digit advertising revenue growth is likely to
continue, considering good gains in readership share, especially in Uttar Pradesh
and on expectations of an improvement in the Indian economy.
Consistent double-digit growth in circulation revenue
The company continues to consistently report double-digit growth in circulation
revenue aided by increase in circulation volume and higher realization per copy.
For FY2015, HMVL reported a growth of 12.4% yoy in circulation revenue. During
the year, HMVL has retained its market leadership in Uttarakhand, Bihar and
Jharkhand by a wide margin and also retained its number two position in Uttar
Pradesh and Delhi. Going forward, the Management expects growth momentum
in circulation revenue to continue owing to the company’s strong brand and
leadership position.
Outlook and valuation
Going forward, we believe that the company would perform well, both on the
top-line and bottom-line fronts, on back of strong recovery in the Indian economy.
Further, we expect strong growth in both advertising and circulation revenue due to
the company’s strong presence in the states of Uttar Pradesh, Uttarakhand, Bihar
and Jharkhand. Further, HT Media is hiving off its online content business to
Hindustan Media Ventures. We are awaiting further clarifications on the deal from the
Management in order to assess its financial implications. Until then, we retain our
Neutral rating on the stock.
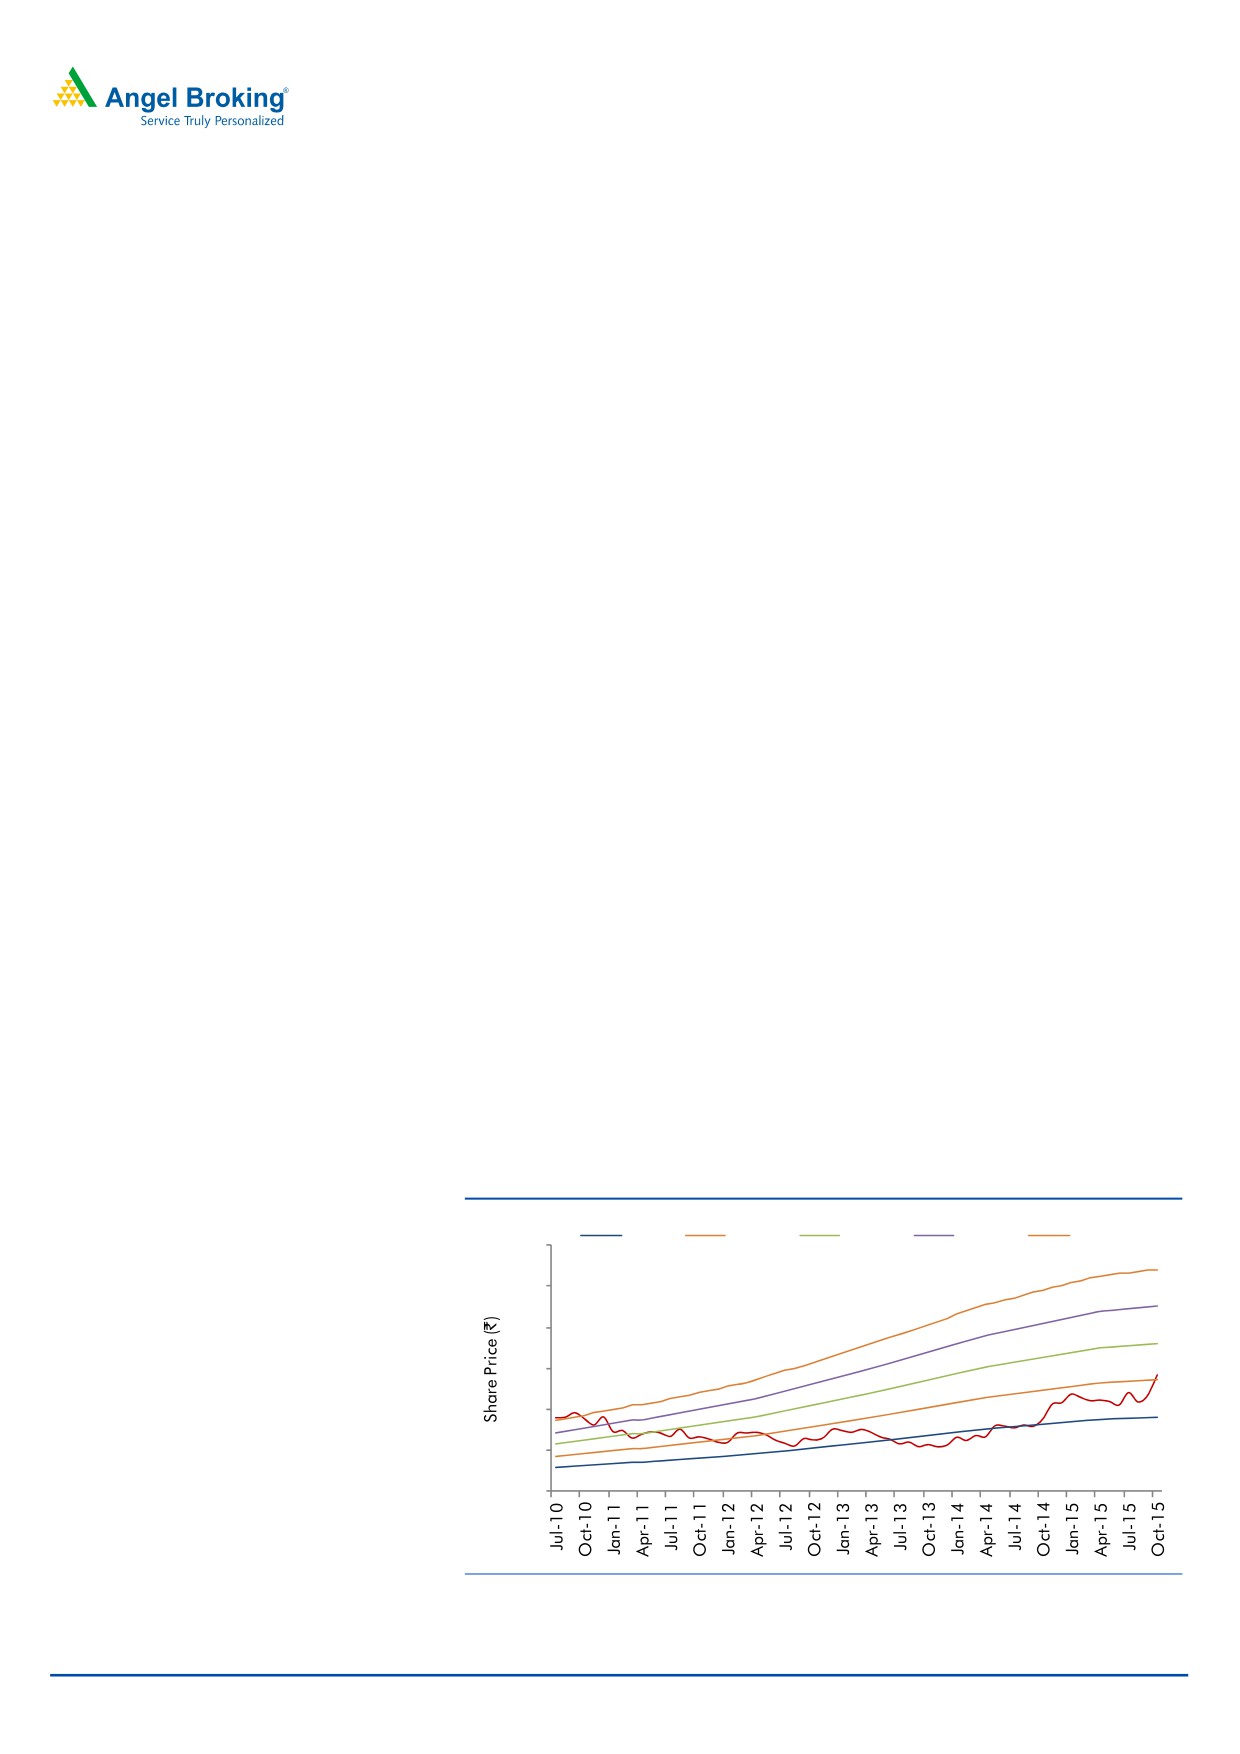
Exhibit 5: One-year forward P/E band
8.0 X
12.0 X
16.0 X
20.0 X
24.0 X
600
500
400
300
200
100
0
Source: Company, Angel Research
October 27, 2015
5
Hindustan Media Ventures | 2QFY2016 Result Update
Company Background
Hindustan Media Ventures Ltd is one of the leading print media companies in
India in terms of readership. The company publishes and prints 'Hindustan', the
third largest daily newspaper in India in terms of readership (9.9mn readers).
'Hindustan' has the largest readership in key Hindi-speaking markets of Bihar and
Jharkhand, with a strong and growing presence in Delhi NCR and the states of
Uttar Pradesh and Uttarakhand. 'Hindustan' is one of the fastest growing Hindi
daily newspapers in India.
October 27, 2015
6
Hindustan Media Ventures | 2QFY2016 Result Update
Profit and Loss Statement
Y/E March (` cr)
FY12
FY13
FY14
FY15
FY16E
FY17E
Total operating income
597
636
730
819
914
1,016
% chg
15.6
6.6
14.7
12.2
11.7
11.1
Total Expenditure
501
524
578
652
716
797
Cost of Materials
257
265
300
338
370
411
Personnel
73
80
87
107
126
144
Others
171
179
191
208
219
242
EBITDA
95
113
151
166
198
218
% chg
9.1
18.1
34.4
10.1
19.2
10.1
(% of Net Sales)
16.0
17.7
20.7
20.3
21.7
21.5
Depreciation& Amortisation
19
22
22
24
27
32
EBIT
76
91
130
142
171
187
% chg
7.0
19.7
42.7
9.6
20.3
9.2
(% of Net Sales)
12.7
14.3
17.8
17.4
18.7
18.4
Interest & other Charges
3
5
6
11
13
14
Other Income
19
28
31
56
62
64
(% of PBT)
20.8
25.0
19.8
30.0
28.2
27.0
Share in profit of Associates
-
-
-
-
-
-
Recurring PBT
92
114
155
188
220
237
% chg
20.4
24.3
35.5
21.7
17.1
7.6
Prior Period & Extra. Exp./(Inc.)
-
-
-
-
-
-
PBT (reported)
92
114
155
188
220
237
Tax
26
30
43
47
59
66
(% of PBT)
28.8
25.9
28.0
25.1
27.0
28.0
PAT (reported)
65
85
111
141
161
171
Add: Share of earnings of asso.
-
-
-
-
-
-
Less: Minority interest (MI)
-
-
-
-
-
-
PAT after MI (reported)
65
85
111
141
161
171
ADJ. PAT
65
85
111
141
161
171
% chg
21.9
29.3
31.6
26.7
14.1
6.1
(% of Net Sales)
11.0
13.3
15.2
17.2
17.6
16.8
Basic EPS (`)
8.9
11.5
15.2
19.2
21.9
23.2
Fully Diluted EPS (`)
8.9
11.5
15.2
19.2
21.9
23.2
% chg
21.9
29.3
31.6
26.7
14.1
6.1
October 27, 2015
7
Hindustan Media Ventures | 2QFY2016 Result Update
Balance sheet
Y/E March (` cr)
FY12
FY13
FY14
FY15
FY16E
FY17E
SOURCES OF FUNDS
Equity Share Capital
73
73
73
73
73
73
Reserves& Surplus
361
435
536
668
820
982
Shareholders Funds
434
508
609
741
893
1,055
Minority Interest
-
-
-
-
-
-
Total Loans
26
3
20
99
99
99
Deferred Tax Liability
12
13
13
13
13
13
Total Liabilities
472
525
643
853
1,005
1,167
APPLICATION OF FUNDS
Gross Block
229
242
254
292
322
372
Less: Acc. Depreciation
43
64
85
109
137
168
Net Block
186
178
169
183
186
204
Capital Work-in-Progress
7
1
11
11
11
11
Investments
213
278
369
547
577
597
Current Assets
175
172
225
282
366
492
Inventories
32
32
33
45
58
72
Sundry Debtors
78
79
93
107
128
148
Cash
44
28
26
40
62
109
Loans & Advances
22
27
65
74
91
132
Other Assets
0
5
8
16
27
30
Current liabilities
116
110
138
177
141
144
Net Current Assets
59
61
87
105
224
348
Deferred Tax Asset
7
7
7
7
7
7
Mis. Exp. not written off
-
-
-
-
-
-
Total Assets
472
525
643
853
1,005
1,167
October 27, 2015
8
Hindustan Media Ventures | 2QFY2016 Result Update
Cashflow
Y/E March (` cr)
FY12
FY13
FY14
FY15
FY16E
FY17E
Profit before tax
92
114
155
188
220
237
Depreciation
19
22
22
24
27
32
Change in Working Capital
(13)
(12)
1
(4)
(97)
(76)
Interest / Dividend (Net)
(14)
5
(23)
11
13
14
Direct taxes paid
(24)
(28)
(43)
(47)
(59)
(66)
Others
13
(20)
1
-
-
-
Cash Flow from Operations
72
81
113
171
104
140
(Inc.)/ Dec. in Fixed Assets
(35)
8
(27)
(38)
(30)
(50)
(Inc.)/ Dec. in Investments
(24)
(65)
(91)
(179)
(30)
(20)
Cash Flow from Investing
(59)
(58)
(117)
(217)
(60)
(70)
Issue of Equity
-
-
-
-
-
-
Inc./(Dec.) in loans
6
(23)
17
78
-
-
Dividend Paid (Incl. Tax)
(7)
(9)
(9)
(9)
(9)
(9)
Interest / Dividend (Net)
(4)
(6)
(7)
(11)
(13)
(14)
Cash Flow from Financing
(5)
(38)
2
59
(22)
(23)
Inc./(Dec.) in Cash
8
(15)
(2)
14
22
48
Opening Cash balances
36
44
28
26
40
62
Closing Cash balances
44
28
26
40
62
109
October 27, 2015
9
Hindustan Media Ventures | 2QFY2016 Result Update
Key ratios
Y/E March
FY12
FY13
FY14
FY15
FY16E
FY17E
Valuation Ratio (x)
P/E (on FDEPS)
31.3
24.2
18.4
14.5
12.7
12.0
P/CEPS
24.2
19.3
15.4
12.4
10.9
10.1
P/BV
4.7
4.0
3.4
2.8
2.3
1.9
Dividend yield (%)
0.4
0.4
0.4
0.4
0.4
0.4
EV/Sales
3.0
2.7
2.3
1.9
1.6
1.4
EV/EBITDA
19.1
15.5
11.1
9.4
7.6
6.6
EV / Total Assets
3.1
2.7
2.1
1.5
1.3
1.1
Per Share Data (`)
EPS (Basic)
8.9
11.5
15.2
19.2
21.9
23.2
EPS (fully diluted)
8.9
11.5
15.2
19.2
21.9
23.2
Cash EPS
11.6
14.5
18.1
22.5
25.6
27.6
DPS
1.2
1.2
1.2
1.2
1.2
1.2
Book Value
59.1
69.3
83.0
101.0
121.7
143.8
Returns (%)
RoCE
16.5
17.8
20.6
16.9
17.2
16.2
Angel RoIC (Pre-tax)
37.2
44.3
55.2
56.2
48.5
41.8
RoE
15.1
16.6
18.3
19.0
18.0
16.2
Turnover ratios (x)
Asset Turnover
3.2
3.6
4.3
4.5
4.9
5.0
Inventory / Sales (days)
19
19
16
20
23
26
Receivables (days)
48
45
47
48
51
53
Payables (days)
40
35
38
38
33
30
Net WC (days)
27
29
25
30
41
49
October 27, 2015
10
Hindustan Media Ventures | 2QFY2016 Result Update
Research Team Tel: 022 - 39357800
DISCLAIMER
Angel Broking Private Limited (hereinafter referred to as “Angel”) is a registered Member of National Stock Exchange of India Limited,
Bombay Stock Exchange Limited and Metropolitan Stock Exchange of India Limited. It is also registered as a Depository Participant with
CDSL and Portfolio Manager with SEBI. It also has registration with AMFI as a Mutual Fund Distributor. Angel Broking Private Limited is
a registered entity with SEBI for Research Analyst in terms of SEBI (Research Analyst) Regulations, 2014 vide registration number
INH000000164. Angel or its associates has not been debarred/ suspended by SEBI or any other regulatory authority for accessing
/dealing in securities Market. Angel or its associates including its relatives/analyst do not hold any financial interest/beneficial
ownership of more than 1% in the company covered by Analyst. Angel or its associates/analyst has not received any compensation /
managed or co-managed public offering of securities of the company covered by Analyst during the past twelve months. Angel/analyst
has not served as an officer, director or employee of company covered by Analyst and has not been engaged in market making activity
of the company covered by Analyst.
This document is solely for the personal information of the recipient, and must not be singularly used as the basis of any investment
decision. Nothing in this document should be construed as investment or financial advice. Each recipient of this document should
make such investigations as they deem necessary to arrive at an independent evaluation of an investment in the securities of the
companies referred to in this document (including the merits and risks involved), and should consult their own advisors to determine
the merits and risks of such an investment.
Reports based on technical and derivative analysis center on studying charts of a stock's price movement, outstanding positions and
trading volume, as opposed to focusing on a company's fundamentals and, as such, may not match with a report on a company's
fundamentals.
The information in this document has been printed on the basis of publicly available information, internal data and other reliable
sources believed to be true, but we do not represent that it is accurate or complete and it should not be relied on as such, as this
document is for general guidance only. Angel Broking Pvt. Limited or any of its affiliates/ group companies shall not be in any way
responsible for any loss or damage that may arise to any person from any inadvertent error in the information contained in this report.
Angel Broking Pvt. Limited has not independently verified all the information contained within this document. Accordingly, we cannot
testify, nor make any representation or warranty, express or implied, to the accuracy, contents or data contained within this document.
While Angel Broking Pvt. Limited endeavors to update on a reasonable basis the information discussed in this material, there may be
regulatory, compliance, or other reasons that prevent us from doing so.
This document is being supplied to you solely for your information, and its contents, information or data may not be reproduced,
redistributed or passed on, directly or indirectly.
Neither Angel Broking Pvt. Limited, nor its directors, employees or affiliates shall be liable for any loss or damage that may arise from
or in connection with the use of this information.
Note: Please refer to the important ‘Stock Holding Disclosure' report on the Angel website (Research Section). Also, please refer to the
latest update on respective stocks for the disclosure status in respect of those stocks. Angel Broking Pvt. Limited and its affiliates may
have investment positions in the stocks recommended in this report.
Disclosure of Interest Statement
HMVL
1. Analyst ownership of the stock
No
2. Angel and its Group companies ownership of the stock
No
3. Angel and its Group companies' Directors ownership of the stock
No
4. Broking relationship with company covered
No
Note: We have not considered any Exposure below ` 1 lakh for Angel, its Group companies and Directors
Ratings (Based on expected returns
Buy (> 15%)
Accumulate (5% to 15%)
Neutral (-5 to 5%)
over 12 months investment period):
Reduce (-5% to -15%)
Sell (< -15%)
October 27, 2015
11