2QFY2016 Result Update | Metals/Mining
November 20, 2015
Hindalco
NEUTRAL
CMP
`78
Performance Highlights
Target Price
-
Investment Period
-
Standalone (` cr)
2QFY16
2QFY15
yoy%
1QFY16
qoq%
Revenue
8,925
8,554
4.3
8,575
4.1
Stock Info
EBITDA
603
466
29.4
877
(31.3)
Sector
Metals/Mining
Margin (%)
6.8
5.4
131bp
10.2
(348)bp
Market Cap (` cr)
16,210
Reported PAT
103
79
31.1
107
(3.7)
Net Debt (` cr)
21,959
Source: Company, Angel Research
Beta
1.3
For 2QFY2016, Hindalco Industries (Hindalco)’ standalone revenues came in 3%
52 Week High / Low
176/68
ahead of our expectations, but the EBITDA disappointed, coming in 16% below
Avg. Daily Volume
96,20,715
our estimate. Net sales increased 4.3% yoy to `8,841cr, vs our expectation of a
Face Value (`)
1
2.5% yoy decline, led by strong increase in aluminium volumes and higher credits
BSE Sensex
25,842
from by-products in the copper division. The strong growth in volumes was diluted
Nifty
7,843
substantially by the sharp slide in commodity prices. Aluminum segment revenue
Reuters Code
HALC.BO
increased 26% yoy whereas copper segment revenue declined 10% yoy. Copper
Bloomberg Code
HNDL IN
volume growth also partially offset the decline in realizations.
Sharp jump in employee and other expenses resulted in the EBITDA margin
Shareholding Pattern (%)
coming in 180bp below our expectations at 6.8%. The EBITDA however increased
Promoters
37.0
29% yoy to `603cr, led by lower than expected material costs. Depreciation and
MF / Banks / Indian Fls
18.0
finance costs jumped sharply yoy and came in marginally ahead of our
FII / NRIs / OCBs
21.5
expectation. However, a sharp jump in other income on account of dividend
Indian Public / Others
23.6
received from subsidiaries and a one-off of `119cr, led the net profit to increase
by 31% yoy to `103cr, well ahead of our expectation of `57cr.
Abs. (%)
3m 1yr
3yr
Outlook and valuation: We expect aluminium prices to remain under pressure led
Sensex
(7.5)
(7.8)
40.9
by the huge oversupply situation and the Chinese slowdown. Pressure on
Hindalco
(9.0)
(49.3)
(27.2)
realizations would continue to offset benefits from volume growth in the
aluminium business. The stock is currently trading at EV/EBITDA of 8x on an
3-year price chart
FY2017E basis and the valuations are currently looking expensive. We remain
250
Neutral on the stock.
200
Key financials (Consolidated)
150
Y/E March (` cr)
FY2013
FY2014
FY2015
FY2016E
FY2017E
100
Revenue
80,193
87,695
1,04,281
1,08,125
1,15,206
50
% chg
(0.8)
9.4
18.9
3.7
6.5
0
Adj. net profit
2,751
2,202
(1,905)
1,132
1,827
% chg
(19.4)
(20.0)
(186.5)
(159.4)
61.4
Adj. EPS (`)
14.4
10.7
(9.2)
5.5
8.8
Source: Company, Angel Research
OPM (%)
9.8
9.4
8.6
8.2
8.8
P/E (x)
5.0
7.4
19.0
14.3
8.9
P/BV (x)
0.4
0.4
0.4
0.4
0.4
RoE (%)
9.0
5.7
2.2
2.9
4.6
RoCE (%)
6.0
4.8
5.0
4.4
5.4
Rahul Dholam
EV/Sales (x)
0.9
0.9
0.8
0.8
0.7
Tel: 022- 3935 7800 Ext: 6847
EV/EBIDTA
8.7
9.2
8.9
9.3
8.0
Source: Company, Angel Research; Note: CMP as of November 19, 2015
Please refer to important disclosures at the end of this report
1
Hindalco | 2QFY2016 Result Update
Exhibit 1: 2QFY2016 performance (Standalone)
(` cr)
2QFY16
2QFY15
yoy%
1QFY16
qoq%
1HFY15
1HFY14
yoy%
Net Sales
8,841
8,473
4.3
8,517
3.8
17,358
16,403
5.8
Other operating income
84
81
2.9
58
44.4
142
147
(3.6)
Revenue
8,925
8,554
4.3
8,575
4.1
17,500
16,550
5.7
Raw material
5,301
5,309
(0.2)
4,889
8.4
10,190
10,456
(2.5)
% of net sales
59.4
62.1
57
58.2
63.2
Employee Cost
446
397
12.4
380
17.3
827
745
10.9
% of net sales
5.0
4.6
4
4.7
4.5
Other expenditure
2,574
2,382
8.1
2,428
6.0
5,003
4,135
21.0
% of net sales
28.8
27.8
28
28.6
25.0
Total expenditure
8,322
8,089
2.9
7,698
8.1
16,020
15,336
4.5
% of net sales
93.2
94.6
90
91.5
92.7
EBITDA
603
466
29.4
877
(31.3)
1,480
1,214
21.9
Margin (%)
6.8
5.4
10
8.5
7.3
112bp
Interest
616
386
59.7
602
2.4
1,218
723
68.3
Depreciation
296
196
50.9
332
(10.9)
628
383
63.9
Other income
418
223
86.9
194
114.8
612
440
39.2
Exceptional items
0
0
0
0
0
Profit before tax
109
107
1.1
138
(21.4)
247
547
14.7
% of net sales
1.2
1.3
2
1.4
3.3
Tax
5
29
(81.4)
31
(82.8)
36
141
(74.4)
% of PBT
4.9
26.6
22
14.7
25.8
Adj. PAT
103
79
31.1
107
(3.7)
210
406
(48.2)
Source: Company, Angel Research
Exhibit 2: 2QFY2016 Actual vs. estimates
(` cr)
Actual
Estimates
Variation (%)
Revenue
8,841
8,336
3.1
EBITDA
603
720
(16.3)
EBITDA margin (%)
6.8
8.6
(180bp)
Net profit
103
57
82.4
Source: Company, Angel Research
Result highlights
Revenue and EBITDA below our estimate
For 2QFY2016, Hindalco Industries (Hindalco)’ standalone revenues came in 3%
ahead of our expectations, but the EBITDA disappointed, coming in 16% below our
estimate. Net sales increased 4.3% yoy to `8,841cr, vs our expectation of a 2.5%
yoy decline, led by strong increase in aluminium volumes and higher credits from
by-products in the copper division. The strong growth in volumes was diluted
substantially by the sharp slide in commodity prices. Aluminum segment revenue
increased 26% yoy whereas copper segment revenue declined 10% yoy. Copper
volume growth also partially offset the decline in realizations.
November 20, 2015
2
Hindalco | 2QFY2016 Result Update
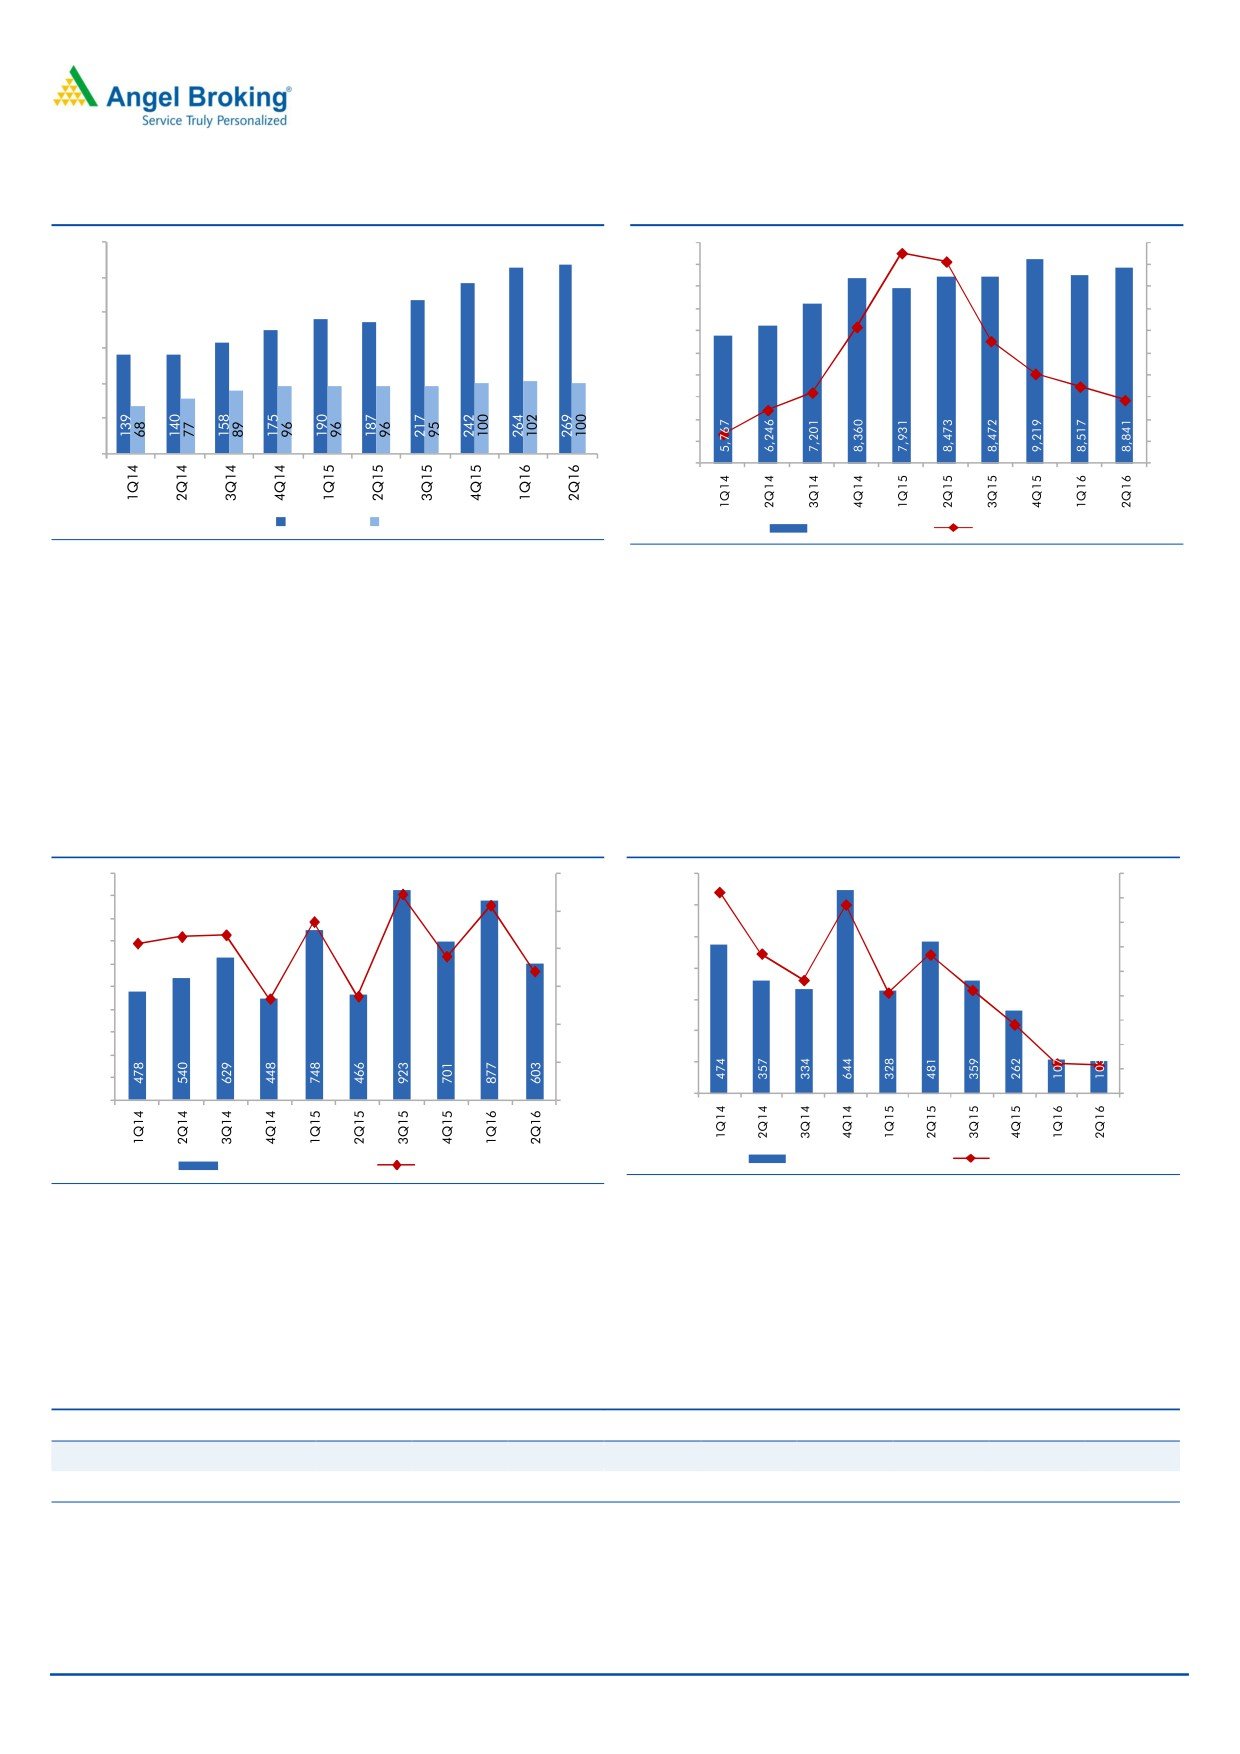
Exhibit 3: Production volumes (kt)
Exhibit 4: Sales growth continues to decline
300
10,000
40
9,000
35
250
8,000
30
200
7,000
25
6,000
20
150
5,000
15
4,000
10
100
3,000
5
50
2,000
0
1,000
(5)
-
0
(10)
Aluminium
Copper
Revenue (` cr)
yoy change (%)
Source: Company, Angel Research
Source: Company, Angel Research
Sharp jump in employee and other expenses resulted in the EBITDA margin
coming in 180bp below our expectations at 6.8%. The EBITDA however increased
29% yoy to `603cr, led by lower than expected material costs. Depreciation and
finance costs jumped sharply yoy and came in marginally ahead of our
expectation. However, a sharp jump in other income on account of dividend
received from subsidiaries and a one-off of `119cr, led the net profit to increase
by 31% yoy to `103cr, well ahead of our expectation of `57cr.
Exhibit 5: EBITDA margin dips sequentially
Exhibit 6: Net profit margin near its recent lows
1,000
10.9
12.0
700
8.2
9.0
10.3
7.7
900
9.4
8.0
600
8.6
8.7
10.0
800
8.3
7.0
7.6
500
5.7
5.7
700
8.0
6.0
6.8
4.6
600
400
4.1
4.2
5.0
5.4
5.5
500
6.0
300
2.8
4.0
400
4.0
3.0
300
200
1.3
1.2
2.0
200
2.0
100
1.0
100
-
0.0
-
0.0
Net Profit (` cr)
Margin (%)
EBITDA (` cr)
Margin (%)
Source: Company, Angel Research
Source: Company, Angel Research
Novelis recorded a strong growth in rolled shipments in 2QFY2016 to 788kt led
by a ramp-up in auto sheets. The Management indicated that demand continues to
remain strong. EBITDA/tonne increased sharply to $302, an increase of 3% yoy
and 9% qoq.
Exhibit 7: Quarterly Performance Trend - Novelis
2QFY14
3QFY14
4QFY14
1QFY15
2QFY15
3QFY15
4QFY15
1QFY16
2QFY16
Rolled Shipments (kt)
713
721
753
770
765
757
758
768
788
EBITDA/Tonne ($)
315
290
305
308
293
304
283
276
302
Source: Company, Angel Research
November 20, 2015
3
Hindalco | 2QFY2016 Result Update
Investment arguments
Aluminium prices to remain under pressure
Aluminium and Copper prices have continued to slide over the last year led by a
meltdown in overall commodity prices. As per the Management, while the
aluminium market continues to increase at 4-5%, over-supply issues led by
slowdown in Chinese demand continue to affect prices. With strong supply growth
in China, global aluminum market is likely to be in a large surplus of over a
million ton in the coming quarters. The Management believes that ~25% of global
capacity is incurring cash losses at current realizations and the supply side has not
adjusted to the global turmoil. Led by the oversupply and slow closure of smelters,
we expect aluminium prices to continue to remain weak.
Novelis business remains stable
Novelis continues to see a steady ramp-up in shipments, led by its focus on the
auto segment. The strategy of focusing on reducing weights of automobiles/cars
has paid strong dividends to Novelis. The auto segment end user demand
witnessed a 59% yoy growth for the quarter. We expect Novelis’ volumes to
continue to remain stable led by this focus. The recent expansion at Novelis is also
progressing well, which is resulting in higher volumes. The company is also
focusing on inventory rationalization which should help reduce working capital
significantly and drive free cash flows for the company.
November 20, 2015
4
Hindalco | 2QFY2016 Result Update
Outlook and valuation
We expect aluminium prices to remain under pressure led by the huge oversupply
situation and the Chinese slowdown. Pressure on realizations would continue to
offset benefits from volume growth in the aluminium business. The stock is
currently trading at EV/EBITDA of 8x on an FY2017E basis and the valuations
currently look expensive. We remain Neutral on the stock.
Company background
Hindalco Industries is an integrated player in the non-ferrous space with
operations comprising bauxite mining, alumina refining and aluminum smelting to
downstream rolling, extrusions, foils, along with captive power plants and coal
mines. The company operates in two segments: Aluminium and Copper. The
Aluminium segment consists of hydrate and alumina, aluminium and aluminium
products. The Copper segment consists of continuous cast copper rods, copper
cathode, sulphuric acid, DAP and complexes, gold, and silver. The company’s
projects include Greenfield as well as Brownfield projects. Its Greenfield expansion
projects include Mahan Aluminum Project, Aditya Alumina and Aluminum Project,
Utkal Alumina Project and Jharkhand Aluminum Project. Its Brownfield projects
include primary metal and Alumina capacity.
November 20, 2015
5
Hindalco | 2QFY2016 Result Update
Profit & Loss Statement (Consolidated)
Y/E March (` cr)
FY2013
FY2014
FY2015
FY2016E
FY2017E
Net Sales
80,193
87,695
1,04,281
1,08,125
1,15,206
% chg
(0.8)
9.4
18.9
3.7
6.5
Total Expenditure
72,356
79,409
95,336
99,292
1,05,019
Raw Materials
48,545
53,388
64,932
67,325
71,734
Power & Fuel Cost
5,251
6,725
8,464
8,776
9,351
Employee Cost
6,526
6,745
7,906
8,197
8,734
Other Expenses
12,034
12,552
14,035
14,994
15,200
EBITDA
7,837
8,286
8,945
8,832
10,187
% chg
(4.3)
5.7
7.9
(1.3)
15.3
(% of Net Sales)
9.8
9.4
8.6
8.2
8.8
Depreciation& Amortisation
2,861
3,553
3,591
4,021
4,142
EBIT
4,976
4,733
5,354
4,811
6,045
% chg
(6.5)
(4.9)
13.1
(10.1)
25.7
(% of Net Sales)
6.2
5.4
5.1
4.4
5.2
Interest & other Charges
2,079
2,702
4,178
4,387
4,563
Other Income
1,012
1,017
1,105
1,050
1,060
Exceptional items
0
(396)
(1,940)
0
0
Profit before tax
3,909
2,653
340
1,473
2,542
% chg
(10.0)
(32.1)
(87.2)
333.0
72.6
Tax Expense
886
525
256
516
890
(% of PBT)
22.7
19.8
75.4
35.0
35.0
Recurring PAT
3,023
2,128
84
958
1,652
Minority Interest
(20)
20
(596)
0
0
Share of associates
15.8
(66.8)
(174.7)
(174.7)
(174.7)
Reported PAT
3,027
2,175
854
1,132
1,827
Adjusted PAT
2,751
2,202
(1,905)
1,132
1,827
% chg
(19.4)
(20.0)
(186.5)
(159.4)
61.4
(% of Net Sales)
3.4
2.5
(1.8)
1.0
1.6
November 20, 2015
6
Hindalco | 2QFY2016 Result Update
Balance Sheet (Consolidated)
Y/E March (` cr)
FY2013
FY2014
FY2015
FY2016E FY2017E
SOURCES OF FUNDS
Equity Share Capital
191
206
207
207
207
Reserves & Surplus
35,139
40,398
38,122
38,831
40,234
Shareholders Funds
35,330
40,605
38,329
39,037
40,441
Minority Interest
1,759
1,781
956
956
956
Total Loans
56,951
64,756
68,468
71,468
71,468
Deferred Tax Liability
3,468
3,175
2,555
2,761
3,117
Other Long term liabilities
7,024
6,972
7,377
7,746
8,133
Total Liabilities
1,04,533
1,17,288
1,17,685
1,21,969
1,24,115
APPLICATION OF FUNDS
Gross Block
60,054
87,914
1,01,940
1,07,037
1,09,178
Less: Acc. Depreciation
22,126
26,750
29,982
34,003
38,145
Net Block
37,929
61,163
71,959
73,034
71,033
Capital Work-in-Progress
33,834
23,059
14,111
14,817
14,965
Goodwill
0
0
0
0
0
Investments
12,601
12,961
12,346
12,768
13,198
Current Assets
32,307
37,575
40,632
43,748
47,003
Cash
3,775
5,021
5,309
5,522
5,752
Inventories
14,332
16,694
18,451
19,190
20,968
Debtor
8,952
9,235
9,186
10,927
11,642
Other
5,247
6,625
7,685
8,109
8,640
Current liabilities
16,057
20,694
24,061
25,231
25,057
Net Current Assets
16,250
16,881
16,571
18,517
21,945
Other Assets
3,919.5
3,223.2
2,697.7
2,832.6
2,974.2
Total Assets
1,04,533
1,17,288
1,17,685
1,21,969
1,24,115
November 20, 2015
7
Hindalco | 2QFY2016 Result Update
Cash flow statement (Consolidated)
Y/E March (` cr)
FY2013
FY2014
FY2015
FY2016E FY2017E
Profit before tax
3,909
2,653
340
1,473
2,542
Depreciation
2,813
3,322
3,459
4,021
4,142
Change in Working Capital
(3,874)
962
(86)
(1,733)
(3,199)
Others
1,477
1,977
4,558
409
420
Direct taxes paid
(1,348)
(959)
(1,128)
(309)
(534)
Cash Flow from Operations
2,977
7,956
7,143
3,861
3,372
(Inc.)/ Dec. in Fixed Assets
(11,871)
(9,424)
(5,978)
(5,803)
(2,289)
(Inc.)/ Dec. in Investments
(1,562)
532
1,051
(596)
(605)
Others
657
689
508
Cash Flow from Investing
(12,776)
(8,202)
(4,418)
(6,399)
(2,894)
Issue of Equity
8
1,630
5
-
-
Inc./(Dec.) in loans
14,336
4,869
2,832
3,000
-
Dividend Paid (Incl. Tax)
(398)
(315)
(249)
(249)
(249)
Others
(3,668)
(4,691)
(5,025)
Cash Flow from Financing
10,278
1,493
(2,437)
2,751
(249)
Inc./(Dec.) in Cash
479
1,246
288
213
229
Opening Cash balances
3,296
3,775
5,021
5,309
5,522
Closing Cash balances
3,775
5,021
5,309
5,522
5,752
November 20, 2015
8
Hindalco | 2QFY2016 Result Update
Key ratios
Y/E March
FY2013
FY2014
FY2015
FY2016E
FY2017E
Per Share Data (`)
Reported EPS
15.8
10.5
4.1
5.5
8.8
Adjusted EPS
14.4
10.7
(9.2)
5.5
8.8
Cash EPS
30.7
27.7
21.5
25.0
28.9
DPS
1.6
1.0
1.0
1.0
1.0
Book Value
184.5
196.7
185.6
189.0
195.8
Valuation Ratio (x)
P/E (on FDEPS)
5.0
7.4
19.0
14.3
8.9
P/CEPS
2.5
2.8
3.6
3.1
2.7
P/BV
0.4
0.4
0.4
0.4
0.4
Dividend yield (%)
2.0
1.3
1.3
1.3
1.3
EV/Sales
0.9
0.9
0.8
0.8
0.7
EV/EBITDA
8.7
9.2
8.9
9.3
8.0
EV/Total Assets
0.7
0.6
0.7
0.7
0.7
Returns (%)
ROCE
6.0
4.8
5.0
4.4
5.4
ROE
9.0
5.7
2.2
2.9
4.6
Turnover ratios (x)
Asset Turnover (Gross Block)
1.4
1.2
1.1
1.0
1.1
Inventory (days)
62.8
64.6
61.5
63.5
63.6
Receivables (days)
38.6
37.8
32.2
33.9
35.8
Payables (days)
73.9
76.5
78.3
83.2
79.7
WC cycle (ex-cash) (days)
47.6
50.6
40.5
40.9
46.2
Solvency ratios (x)
Net debt to equity
1.5
1.5
1.6
1.7
1.6
Net debt to EBITDA
0.9
0.9
0.9
0.9
0.9
Interest Coverage (EBIT / Interest)
2.4
1.8
1.3
1.1
1.3
November 20, 2015
9
Hindalco | 2QFY2016 Result Update
Research Team Tel: 022 - 39357800
DISCLAIMER
Angel Broking Private Limited (hereinafter referred to as “Angel”) is a registered Member of National Stock Exchange of India Limited,
Bombay Stock Exchange Limited and Metropolitan Stock Exchange of India Limited. It is also registered as a Depository Participant with
CDSL and Portfolio Manager with SEBI. It also has registration with AMFI as a Mutual Fund Distributor. Angel Broking Private Limited is
a registered entity with SEBI for Research Analyst in terms of SEBI (Research Analyst) Regulations, 2014 vide registration number
INH000000164. Angel or its associates has not been debarred/ suspended by SEBI or any other regulatory authority for accessing
/dealing in securities Market. Angel or its associates including its relatives/analyst do not hold any financial interest/beneficial
ownership of more than 1% in the company covered by Analyst. Angel or its associates/analyst has not received any compensation /
managed or co-managed public offering of securities of the company covered by Analyst during the past twelve months. Angel/analyst
has not served as an officer, director or employee of company covered by Analyst and has not been engaged in market making activity
of the company covered by Analyst.
This document is solely for the personal information of the recipient, and must not be singularly used as the basis of any investment
decision. Nothing in this document should be construed as investment or financial advice. Each recipient of this document should
make such investigations as they deem necessary to arrive at an independent evaluation of an investment in the securities of the
companies referred to in this document (including the merits and risks involved), and should consult their own advisors to determine
the merits and risks of such an investment.
Reports based on technical and derivative analysis center on studying charts of a stock's price movement, outstanding positions and
trading volume, as opposed to focusing on a company's fundamentals and, as such, may not match with a report on a company's
fundamentals.
The information in this document has been printed on the basis of publicly available information, internal data and other reliable
sources believed to be true, but we do not represent that it is accurate or complete and it should not be relied on as such, as this
document is for general guidance only. Angel Broking Pvt. Limited or any of its affiliates/ group companies shall not be in any way
responsible for any loss or damage that may arise to any person from any inadvertent error in the information contained in this report.
Angel Broking Pvt. Limited has not independently verified all the information contained within this document. Accordingly, we cannot
testify, nor make any representation or warranty, express or implied, to the accuracy, contents or data contained within this document.
While Angel Broking Pvt. Limited endeavors to update on a reasonable basis the information discussed in this material, there may be
regulatory, compliance, or other reasons that prevent us from doing so.
This document is being supplied to you solely for your information, and its contents, information or data may not be reproduced,
redistributed or passed on, directly or indirectly.
Neither Angel Broking Pvt. Limited, nor its directors, employees or affiliates shall be liable for any loss or damage that may arise from
or in connection with the use of this information.
Note: Please refer to the important ‘Stock Holding Disclosure' report on the Angel website (Research Section). Also, please refer to the
latest update on respective stocks for the disclosure status in respect of those stocks. Angel Broking Pvt. Limited and its affiliates may
have investment positions in the stocks recommended in this report.
Disclosure of Interest Statement
Hindalco
1. Analyst ownership of the stock
No
2. Angel and its Group companies ownership of the stock
No
3. Angel and its Group companies' Directors ownership of the stock
No
4. Broking relationship with company covered
No
Note: We have not considered any Exposure below ` 1 lakh for Angel, its Group companies and Directors
Ratings (Based on expected returns
Buy (> 15%)
Accumulate (5% to 15%)
Neutral (-5 to 5%)
over 12 months investment period):
Reduce (-5% to -15%)
Sell (< -15)
November 20, 2015
10