3QFY2017 Result Update | Automobile
February 14, 2017
Hero MotoCorp
ACCUMULATE
CMP
`3,226
Performance Highlights
Target Price
`3,466
Y/E March (` cr)
2QFY17
2QFY16
% chg (yoy) 1QFY17
% chg (qoq)
Investment Period
12 Months
Net Sales
6,365
7,295
(12.8)
7,796
(18.4)
EBITDA
1,080
1,140
(5.3)
1,369
(21.1)
Stock Info
EBITDA margin (%)
17.0
15.6
(134 bps)
17.6
(59 bps)
Sector
Automobile
Adj PAT
772
796
(3.0)
1,004
(23.1)
Market Cap (` cr)
64,428
Source: Company, Angel Research
Net Debt (` cr)
-103
Beta
0.9
Result indicates demonetisation pain: Total volumes were at 14.73 lakh vehicles
52 Week High / Low
3,739/2,440
showing a yoy decline of 13%. On sequential basis, volumes declined by 19%.
Avg. Daily Volume
28,199
Net realization stood at `42,387 per vehicle vs. `42,059 in 2QFY17 and
Face Value (`)
2
`42,442 in 3QFY16. The company has maintained the upward trajectory in
BSE Sensex
28,352
contribution per vehicle which stood at `14,373 per vehicle against `13,552 in
Nifty
8,805
3QFY16. EBITDA came in at `1080cr vs. 1,140cr in 3QFY16. EBITDA margins
improved by ~140bps on yoy basis and declined by ~60bps on qoq basis. Gross
Reuters Code
HROM.BO
margins improved to 35.1% in 3QFY17 vs. 33.5% in 3QFY16. This is mainly due
Bloomberg Code
HMCL@IN
to the 6 month lag in the raw material prices. Net profit declined by 3% yoy from
`796cr in 3QFY16 to `772cr in 3QFY17.
Shareholding Pattern (%)
Outlook and valuation: The demonetisation has impacted HMCL’s volumes
Promoters
34.6
sharply with decline in all parameters. Company expects the volumes growth to
MF / Banks / Indian Fls
13.4
remain challenging in 4QFY17E and expects high single digit volume growth in
FII / NRIs / OCBs
42.9
FY18E. As automobile industry recovers, HMCL looks to be better positioned due
Indian Public / Others
9.1
to its higher market share in the motorcycle segment. The company also has rural
exposure and as budget sets tone for higher rural spending, HMCL is likely to
benefit. Company has lost ~50bps market share in the scooter segment. We
Abs. (%)
3m 1yr 3yr
forecast 6.8% and 9.5% volume growth in FY18E and FY19E. We also forecast
Sensex
2.9
19.3
39.3
top line and bottom line CAGR of 8.5% and 8.9% over FY17E-FY19E. Company
Hero MotoCorp
3.9
28.2
63.5
has indicated of ~50-60bps margin expansion in FY18E which is likely to take the
operating margins at 17% post which we don’t see any lever for expansion. The
3-year price chart
stock, at CMP, trades at 17.3x and 15.8x of FY18E and FY19E EPS respectively.
4,000
We value the stock at 17x of FY19E earrings to arrive at a price target of `3,466.
3,000
Key financials (Standalone)
Y/E March (` cr)
FY2015
FY2016
FY2017E
FY2018E
FY2019E
2,000
Net Sales
27,351
28,160
28,083
30,096
33,071
1,000
% chg
8.9
3.0
(0.3)
7.2
9.9
Net Profit
2,541
3,132
3,432
3,734
4,072
0
% chg
13.1
31.3
9.6
8.8
9.0
OPM (%)
12.8
15.5
16.7
17.0
17.0
EPS (`)
119.5
156.9
171.8
187.0
203.9
Source: Company, Angel Research
P/E (x)
27.0
20.6
18.8
17.3
15.8
P/BV (x)
9.8
8.1
6.6
5.5
4.7
RoE (%)
35.3
33.9
30.1
27.9
25.8
RoCE (%)
42.3
44.9
38.8
35.8
33.3
Shrikant Akolkar
EV/Sales (x)
2.2
2.1
2.1
1.9
1.7
022-3935 7800 Ext: 6846
EV/EBITDA (x)
18.5
15.0
13.8
12.2
10.9
Source: Company, Angel Research; Note: CMP as of February 13, 2017
Please refer to important disclosures at the end of this report
1
Hero MotoCorp | 3QFY2017 Result Update
Exhibit 1: Quarterly financial performance (Standalone)
Y/E March (` cr)
3QFY17
3QFY16
% chg (yoy)
2QFY17
% chg (qoq)
9MFY17
9MFY16
% chg (yoy)
Total units sold
1,473,548
1,690,354
(12.8)
1,823,498
(19.2)
5,042,435
4,911,082
2.7
Net sales
6,365
7,295
(12.8)
7,796
(18.4)
21,560
21,009
2.6
Consumption of RM
4,128
4,883
(15.5)
5,183
(20.4)
14,277
14,360
(0.6)
(% of Sales)
64.9
66.9
66.5
66.2
68.4
Staff costs
374
345
8.6
357
4.7
1,068
966
10.6
(% of Sales)
5.9
4.7
4.6
5.0
4.6
Other expenses
783
927
(15.6)
887
(11.7)
2,537
2,405
5.5
(% of Sales)
12.3
12.7
11.4
11.8
11.4
Total Expenditure
5,285
6,155
(14.1)
6,427
(17.8)
17,881
17,731
0.8
Operating Profit
1,080
1,140
(5.3)
1,369
(21.1)
3,679
3,278
12.2
OPM
17.0
15.6
17.6
17.1
15.6
Depreciation
125
114
9.6
119
4.7
359
326
10.2
Other income
132
84
56.7
152
(13.4)
405
300
34.9
Finance cost
2
1
176.4
2
(1.9)
5
3
52.8
PBT (excl. Extr. Items)
1,085
1,110
(2.2)
1,400
(22.5)
3,719
3,249
14.5
Extr. Income/(Expense)
0.00
0.00
0.00
0.00
0.00
PBT (incl. Extr. Items)
1,085
1,110
(2.2)
1,400
(22.5)
3,719
3,249
14.5
(% of Sales)
17.1
15.2
18.0
17.3
15.5
Tax
313
314
(0.2)
396
(20.9)
1,060
919
15.3
(% of PBT)
28.9
28.3
28.3
28.5
28.3
Reported PAT
772
796
(3.0)
1,004
(23.1)
2,659
2,329
14.2
Adj PAT
772
796
(3.0)
1,004
(23.1)
2,659
2,329
14.2
Adj. PATM
12.1
10.9
12.9
12.3
11.1
Equity capital (cr)
40
40
40
40
40
Adjusted EPS (`)
38.7
39.9
(3.0)
50.3
(23.1)
133.2
116.6
14.2
Source: Company, Angel Research
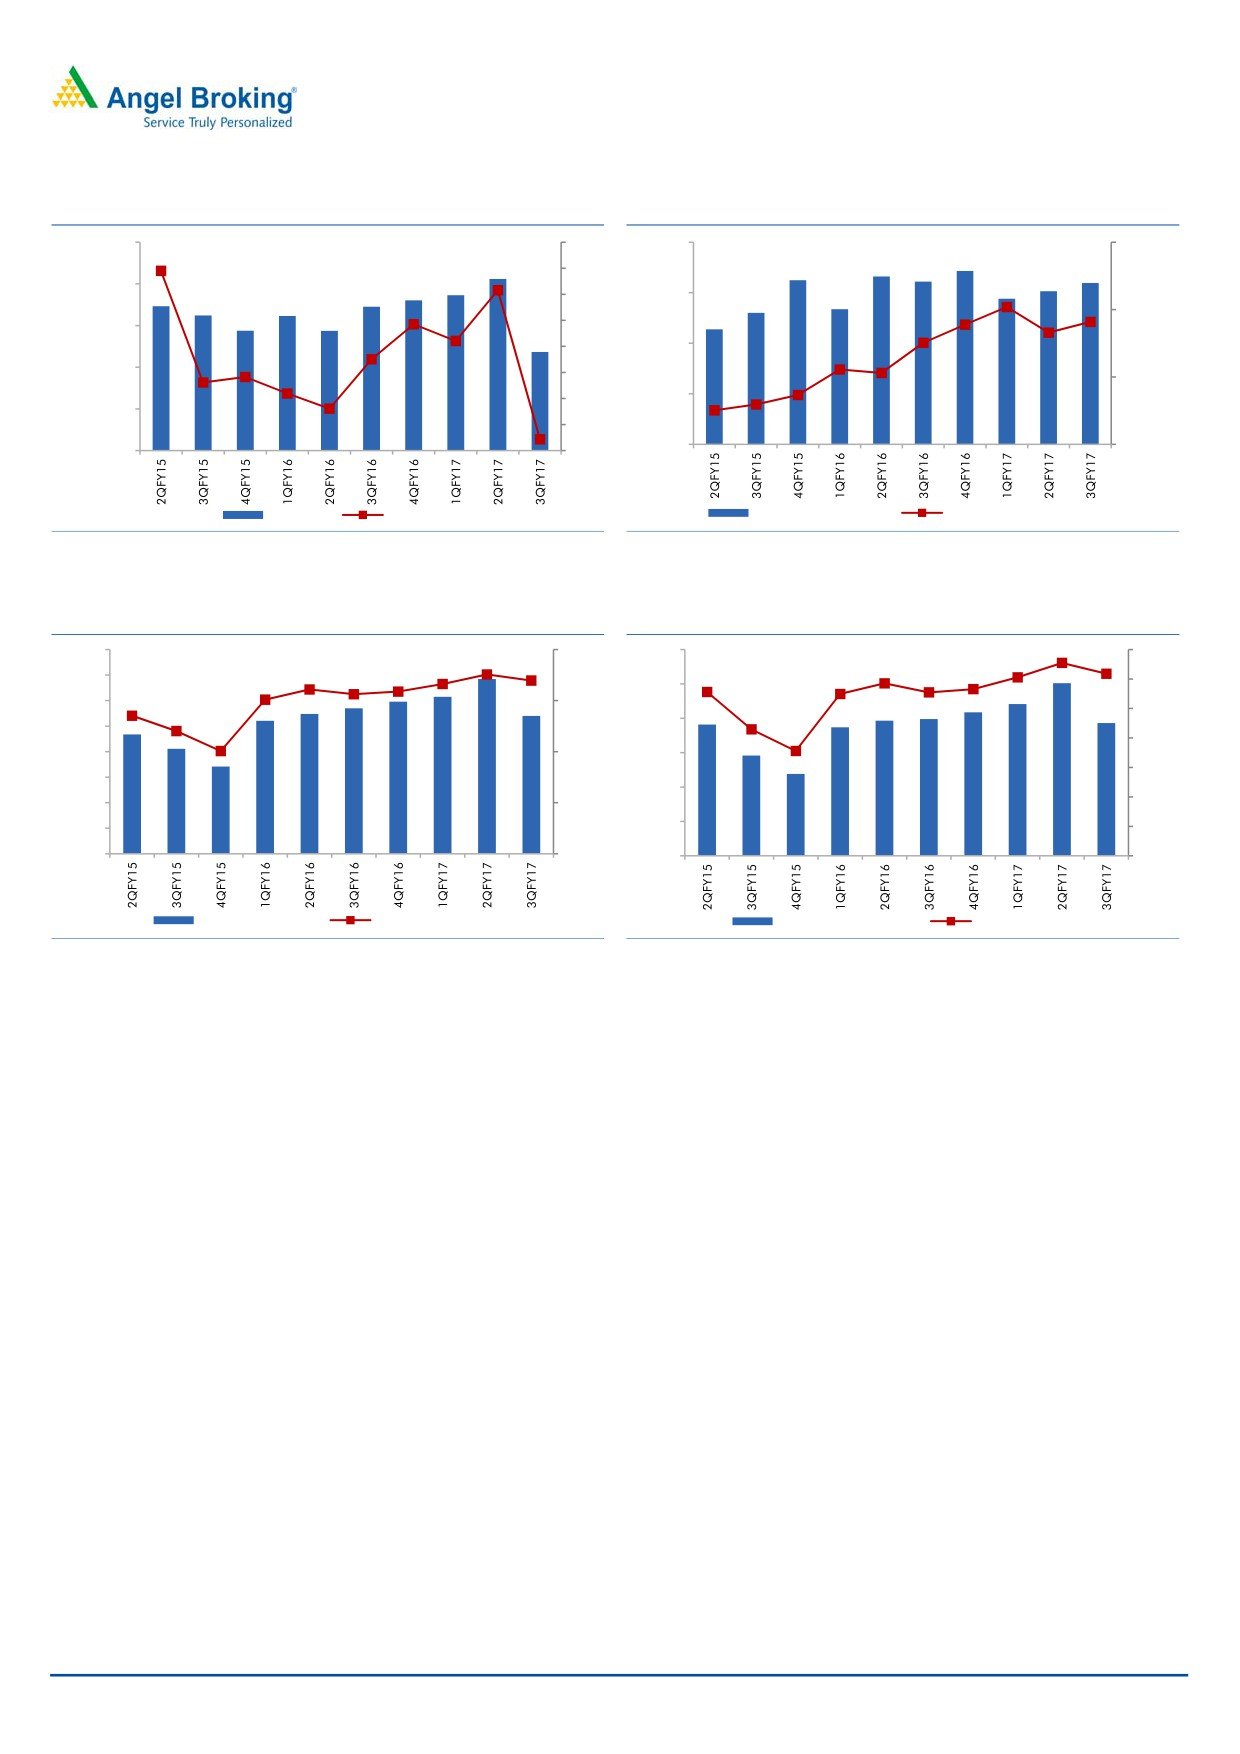
Total volumes were at 14.73 lakh vehicles showing a yoy decline of 13%. On
sequential basis, volumes declined by 19%.
Net realization stood at `42,387 per vehicle vs. `42,059 in 2QFY17 and
`42,442 in 3QFY16.
The company has maintained the upward trajectory in contribution per vehicle
which stood at `14,373 per vehicle against `13,552 in 3QFY16.
EBITDA came in at `1080cr vs. 1,140cr in 3QFY16.
EBITDA margins improved by ~140bps on yoy basis and declined by ~60bps
on qoq basis. Gross margins improved to 35.1% in 3QFY17 vs. 33.5% in
3QFY16. This is mainly due to the 6 month lag in the raw material prices.
Net profit declined by 3% yoy from `796cr in 3QFY16 to `772cr in 3QFY17.
February 14, 2017
2
Hero MotoCorp | 3QFY2017 Result Update
Exhibit 2: Volume growth at 8 quarter high
Exhibit 3: Realisations & contribution/vehicle improve
20,00,000
25
44,000
16,000
20
18,00,000
15
42,000
14,000
10
16,00,000
5
40,000
14,00,000
0
12,000
-5
38,000
12,00,000
-10
36,000
10,000
10,00,000
-15
Volumes
yoy growth (%)
Net realization (`)
Contribution / Vehicle (`)
Source: Company, Angel Research
Source: Company, Angel Research
Exhibit 4: Consistent rise in EBITDA margins beat
Exhibit 5: PAT at record high
1,600
20.0
1,200
14.0
1,400
12.0
1,000
1,200
15.0
10.0
800
1,000
8.0
800
10.0
600
6.0
600
400
4.0
400
5.0
200
200
2.0
0
0.0
0
0.0
EBITDA (`cr)
EBITDA margins (%)
Net profit (`cr)
Net margin (%)
Source: Company, Angel Research
Source: Company, Angel Research
Conference call - Key highlights
The company expects soft demand trajectory to continue until the first quarter
of next fiscal.
Feb and March 2017 volumes are expected to be flat however company
expects higher single digit growth in FY18
Company reported higher gross margins (35.1% in Q3FY17 vs. 33.06% in
Q3FY16 and 33.5% in Q2FY17). This was due to the increase of material cost
lag period from ~3 months to ~6 months.
The ongoing LEAP program is expected to improve its margins by 80-90bps in
FY17E and further 50-60bps in FY18E.
The Excise benefit at its Haridwar plant will end in FY18E.
While company gained market share in the motorcycle segment, in scooter
segment market remained flat. This will be addressed by new product
launches in this category.
Company has taken 0.5-1% hike in its models to absorb the raw material cost
impact.
February 14, 2017
3
Hero MotoCorp | 3QFY2017 Result Update
Investment arguments
Domestic vehicle demand to recover faster than expected: The automobile
demand in India impacted post demonetisation. The demand however is
slowly coming back to normalcy as liquidity in the country is improveing. From
March onwards, there will be no limit on cash withdrawals which will benefit
Automobile industry. The lower interest rates, government’s focus on rural
economy and cut in the entry level tax rates is expected to benefit the
automobile sector. Overall we expect the demand scenario to come back to
normalcy in 1QFY18E.
Hero Motocorp well positioned to gain from demand recovery: Hero Motocorp
(HMCL) is a well established brand and commands more than 50% market
share in the domestic 2W industry. It has a wide range of brands from entry
level to high end motorbikes. It also has strong presence in scooters segment
and it is a well recognized in brand in rural area. Push for rural economy and
tax rate cuts should benefit HMCL gong ahead.
Capacity expansion to meet higher demand: HMCL has total installed capacity
of ~8.2 million units. This capacity would further increase by ~0.750mn units
after commissioning of new capacity at Neemrana plant which is currently
under trial product run. Company is also developing a new capacity at Halol
in Gujarat (~1.8mn units), which is expected to be operational in FY2017,
thus taking the overall capacity to ~10.75 mn units. As a result of its capacity
expansion, HMCL remains well positioned to meet future demand. Its
Haridwar plant contributes ~35% of the total volumes and is currently running
at the capacity utilization of ~67% which gives enough room for volume
growth in short term.
Outlook and valuation
The demonetisation has impacted HMCL’s volumes sharply with decline in all
parameters. Company expects the volumes growth to remain challenging in
4QFY17E and expects high single digit volume growth in FY18E. As automobile
industry recovers, HMCL looks to be better positioned due to its higher market
share in the motorcycle segment. The company also has rural exposure and as
budget sets tone for higher rural spending, HMCL is likely to benefit. Company has
lost ~50bps market share in the scooter segment. We forecast 6.8% and 9.5%
volume growth in FY18E and FY19E. We also forecast top line and bottom line
CAGR of 8.5% and 8.9% over FY17E-FY19E. Company has indicated of ~50-
60bps margin expansion in FY18E which is likely to take the operating margins at
17% post which we don’t see any lever for expansion. The stock, at CMP, trades at
17.3x and 15.8x of FY18E and FY19E EPS respectively. We value the stock at 17x
of FY19E earrings to arrive at a price target of `3,466. .
February 14, 2017
4
Hero MotoCorp | 3QFY2017 Result Update
Exhibit 6: Key assumptions - Volumes
Y/E March
FY2014
FY2015
FY2016E
FY2017E
FY2018E
FY2019E
Total two-wheelers
6,245,960
6,631,826
6,632,322
6,631,198
7,078,838
7,749,013
Source: Company, Angel Research
Company background
Hero MotoCorp (HMCL) is a leading 2W manufacturer globally and the market
leader in the domestic motorcycle segment with more than 50% market share.
HMCL has four manufacturing facilities in India, located at Gurgaon, Dharuhera,
Haridwar and Neemrana. It has also a production facility in Colombia. Together it
has a capacity of ~8.2mn units/year as of September 2016. Over 2010-16,
HMCL recorded a strong volume CAGR of ~12%, backed by its strong brands
(Passion and Splendor) and a well-entrenched dealership network (~19,000),
which has a good presence across rural areas as well.
February 14, 2017
5
Hero MotoCorp | 3QFY2017 Result Update
Profit and loss statement (Standalone)
Y/E March (` cr)
FY2015
FY2016
FY2017E
FY2018E
FY2019E
Total operating income
27,351
28,160
28,083
30,096
33,071
% chg
8.9
3.0
(0.3)
7.2
9.9
Total Expenditure
24,043
24,152
23,794
25,359
27,884
Cost of Materials
19,754
19,315
18,896
20,244
22,255
Personnel
1,173
1,320
1,418
1,434
1,560
Others Expenses
3,116
3,518
3,481
3,681
4,069
EBITDA
3,307
4,008
4,289
4,736
5,187
% chg
0.1
25.5
7.0
9.4
9.7
(% of Net Sales)
12.1
14.2
15.3
15.7
15.7
Depreciation& Amortisation
540
441
477
551
607
EBIT
2,768
3,567
3,811
4,185
4,580
% chg
21.3
28.9
6.9
9.8
9.4
(% of Net Sales)
10.1
12.7
13.6
13.9
13.8
Interest & other Charges
11
2
6
6
6
Other Income
493
391
527
581
605
(% of PBT)
15.2
9.9
12.2
12.2
11.7
Recurring PBT
3,249
3,956
4,332
4,760
5,178
% chg
19.6
21.7
9.5
9.9
8.8
Prior Period & Extraord. Exp./(Inc.)
-
-
-
-
-
PBT (reported)
3,249
3,956
4,332
4,760
5,178
Tax
943
1,262
1,372
1,499
1,634
(% of PBT)
29.0
31.9
31.7
31.5
31.6
PAT (reported)
2,306
2,694
2,960
3,261
3,544
Add: Share of earnings of asso.
-
-
-
-
-
Less: Minority interest (MI)
-
-
-
-
-
PAT after MI (reported)
2,306
2,694
2,960
3,261
3,544
ADJ. PAT
2,306
2,694
2,960
3,261
3,544
% chg
13.1
31.3
9.6
8.8
9.0
(% of Net Sales)
8.4
9.6
10.5
10.8
10.7
Basic EPS (`)
119.5
156.9
171.8
187.0
203.9
Fully Diluted EPS (`)
119.5
156.9
171.8
187.0
203.9
% chg
13.1
31.3
9.6
8.8
9.0
February 14, 2017
6
Hero MotoCorp | 3QFY2017 Result Update
Balance sheet statement (Standalone)
Y/E March (` cr)
FY2015
FY2016
FY2017E FY2018E
FY2019E
SOURCES OF FUNDS
Equity Share Capital
40
40
40
40
40
Reserves& Surplus
6,501
7,905
9,792
11,659
13,695
Shareholders’ Funds
6,541
7,945
9,832
11,699
13,735
Minority Interest
-
-
-
-
-
Total Loans
-
-
-
-
-
Deferred Tax Liability
6
239
239
239
239
Other Liabilities
97
119
119
119
119
Total Liabilities
6,645
8,303
10,191
12,058
14,094
APPLICATION OF FUNDS
Gross Block
8,114
9,397
10,697
11,797
12,997
Less: Acc. Depreciation
5,201
5,560
6,037
6,589
7,196
Net Block
2,913
3,837
4,660
5,208
5,801
Capital Work-in-Progress
713
605
680
780
780
Investments
3,154
4,266
4,266
4,266
4,266
Current Assets
3,669
3,632
4,739
6,334
8,310
Inventories
815
673
923
825
815
Sundry Debtors
1,390
1,283
1,385
1,402
1,540
Cash
159
131
774
2,212
3,871
Loans & Advances
627
601
646
752
827
Other Assets
677
944
1,011
1,144
1,257
Current liabilities
3,883
4,049
4,166
4,543
5,076
Net Current Assets
(215)
(417)
573
1,791
3,235
Deferred Tax Asset
80
11
11
11
11
Mis. Exp. not written off
-
-
-
-
-
Total Assets
6,645
8,303
10,191
12,058
14,094
Note: Cash includes cash with scheduled banks on dividend current accounts
February 14, 2017
7
Hero MotoCorp | 3QFY2017 Result Update
Cash flow statement (Standalone)
Y/E March (` cr)
FY2015E
FY2016
FY2017E FY2018E FY2019E
Profit before tax
3,329
4,395
4,804
5,233
5,706
Depreciation
540
441
477
551
607
Change in Working Capital
(337)
446
(347)
220
216
Interest / Dividend (Net)
(142)
(173)
6
6
6
Direct taxes paid
(1,000)
(1,103)
(1,372)
(1,499)
(1,634)
Others
(141)
(92)
-
-
-
Cash Flow from Operations
2,250
3,914
3,568
4,511
4,901
(Inc.)/ Dec. in Fixed Assets
0
0
(1,375)
(1,200)
(1,200)
(Inc.)/ Dec. in Investments
12
(2,271)
-
-
-
Cash Flow from Investing
12
(2,271)
(1,375)
(1,200)
(1,200)
Issue of Equity
-
1
-
-
-
Inc./(Dec.) in loans
0
0
0
0
0
Dividend Paid (Incl. Tax)
(1,897)
(1,398)
(1,544)
(1,867)
(2,036)
Interest / Dividend (Net)
(333)
(287)
(6)
(6)
(6)
Cash Flow from Financing
(2,231)
(1,684)
(1,550)
(1,873)
(2,042)
Inc./(Dec.) in Cash
32
(42)
642
1,438
1,659
Opening Cash balances
66
98
131
774
2,212
Closing Cash balances
98
56
774
2,212
3,871
February 14, 2017
8
Hero MotoCorp | 3QFY2017 Result Update
Key ratios
Y/E March
FY2015E
FY2016
FY2017E FY2018E FY2019E
Valuation Ratio (x)
P/E (on FDEPS)
27.0
20.6
18.8
17.3
15.8
P/CEPS
20.9
18.0
16.5
15.0
13.8
P/BV
9.8
8.1
6.6
5.5
4.7
Dividend yield (%)
1.9
2.2
2.4
2.9
3.2
EV/Sales
2.2
2.1
2.1
1.9
1.7
EV/EBITDA
18.5
15.0
13.8
12.2
10.9
EV / Total Assets
5.8
4.9
4.1
3.5
2.9
Per Share Data (Rs)
EPS (Basic)
119.5
156.9
171.8
187.0
203.9
EPS (fully diluted)
119.5
156.9
171.8
187.0
203.9
Cash EPS
154.3
179.0
195.7
214.6
234.3
DPS
60.0
72.0
77.3
93.5
101.9
Book Value
327.6
397.8
492.3
585.8
687.8
Returns (%)
ROCE
42.3
44.9
38.8
35.8
33.3
Angel ROIC (Pre-tax)
85.7
100.6
79.5
80.2
81.8
ROE
35.3
33.9
30.1
27.9
25.8
Turnover ratios (x)
Asset Turnover (Gross Block)
3.4
3.0
2.6
2.6
2.5
Inventory / Sales (days)
11
9
12
10
9
Receivables (days)
19
18
17
17
-
Payables (days)
38
38
39
40
41
WC cycle (ex-cash) (days)
(8)
(11)
(10)
(13)
(32)
February 14, 2017
9
Hero MotoCorp | 3QFY2017 Result Update
Research Team Tel: 022 - 39357800
DISCLAIMER
Angel Broking Private Limited (hereinafter referred to as “Angel”) is a registered Member of National Stock Exchange of India Limited,
Bombay Stock Exchange Limited and Metropolitan Stock Exchange Limited. It is also registered as a Depository Participant with CDSL
and Portfolio Manager with SEBI. It also has registration with AMFI as a Mutual Fund Distributor. Angel Broking Private Limited is a
registered entity with SEBI for Research Analyst in terms of SEBI (Research Analyst) Regulations, 2014 vide registration number
INH000000164. Angel or its associates has not been debarred/ suspended by SEBI or any other regulatory authority for accessing
/dealing in securities Market. Angel or its associates/analyst has not received any compensation / managed or co-managed public
offering of securities of the company covered by Analyst during the past twelve months.
This document is solely for the personal information of the recipient, and must not be singularly used as the basis of any investment
decision. Nothing in this document should be construed as investment or financial advice. Each recipient of this document should
make such investigations as they deem necessary to arrive at an independent evaluation of an investment in the securities of the
companies referred to in this document (including the merits and risks involved), and should consult their own advisors to determine
the merits and risks of such an investment.
Reports based on technical and derivative analysis center on studying charts of a stock's price movement, outstanding positions and
trading volume, as opposed to focusing on a company's fundamentals and, as such, may not match with a report on a company's
fundamentals. Investors are advised to refer the Fundamental and Technical Research Reports available on our website to evaluate the
contrary view, if any.
The information in this document has been printed on the basis of publicly available information, internal data and other reliable
sources believed to be true, but we do not represent that it is accurate or complete and it should not be relied on as such, as this
document is for general guidance only. Angel Broking Pvt. Limited or any of its affiliates/ group companies shall not be in any way
responsible for any loss or damage that may arise to any person from any inadvertent error in the information contained in this report.
Angel Broking Pvt. Limited has not independently verified all the information contained within this document. Accordingly, we cannot
testify, nor make any representation or warranty, express or implied, to the accuracy, contents or data contained within this document.
While Angel Broking Pvt. Limited endeavors to update on a reasonable basis the information discussed in this material, there may be
regulatory, compliance, or other reasons that prevent us from doing so.
This document is being supplied to you solely for your information, and its contents, information or data may not be reproduced,
redistributed or passed on, directly or indirectly.
Neither Angel Broking Pvt. Limited, nor its directors, employees or affiliates shall be liable for any loss or damage that may arise from
or in connection with the use of this information.
Disclosure of Interest Statement
Hero MotoCorp
1. Financial interest of research analyst or Angel or his Associate or his relative
No
2. Ownership of 1% or more of the stock by research analyst or Angel or associates or relatives
No
3. Served as an officer, director or employee of the company covered under Research
No
4. Broking relationship with company covered under Research
No
Ratings (Based on expected returns
Buy (> 15%)
Accumulate (5% to 15%)
Neutral (-5 to 5%)
over 12 months investment period):
Reduce (-5% to -15%)
Sell (< -15)
February 14, 2017
10