3QFY2016 Result Update | FMCG
January 18, 2016
Hindustan Unilever
NEUTRAL
CMP
`811
Performance Highlights
Target Price
-
Quarterly Data
Investment Period
-
(` cr)
3QFY16
3QFY15
% yoy
2QFY16
% qoq
Revenue
7,981
7,774
2.7
7,955
0.3
EBITDA
1,314
1,321
(0.5)
1,304
0.8
Stock Info
Margin (%)
16.5
17.0
(52bp)
17.4
(89bp)
Sector
FMCG
Adj. PAT
1,026
972
5.6
971
5.7
Market Cap (` cr)
1,75,403
Source: Company, Angel Research
Net Debt (` cr)
-5,671
Hindustan Unilever (HUL)’s performance for 3QFY2014 was slightly below
Beta
0.6
consensus expectations. For the quarter, the company’s top-line grew by 2.7% yoy
52 Week High / Low
979 / 771
to `7,981cr while the reported PAT grew ~6% yoy to `1,026cr.
Avg. Daily Volume
96,053
Face Value (`)
1
Key highlights: For 3QFY2016, HUL’s top-line rose by 2.7% yoy to `7,981cr. The
BSE Sensex
24,188
soaps and detergents division posted a flat yoy growth due to weak macros.
Nifty
7,351
However, in the soaps segment, we saw some growth in Dove, Pears and Lifebuoy
as well as double-digit growth in the liquids portfolio. The detergents segment’s
Reuters Code
HLL.BO
saw double-digit growth in Surf and Rin. The personal products division posted a
Bloomberg Code
HUVR@IN
modest growth of 5.6% yoy. The reported growth of this segment was impacted by
delayed winter and owing to one-time realignment of channel spends. In the
Shareholding Pattern (%)
beverages segment, the company reported a growth of 7% yoy primarily led by
Promoters
67.2
volumes, which were driven by activations and market development initiatives by
MF / Banks / Indian Fls
13.9
the company.
FII / NRIs / OCBs
4.8
On the operating profit front, the company reported a de-growth of 0.5% yoy due
Indian Public / Others
14.1
to lower sales growth. Further, the operating profit margin fell by 52bp yoy to
16.5% due to increase in advertisement and other expenses. During the quarter,
Abs. (%)
3m 1yr 3yr
the company incurred `55cr under the exceptional items head, which factored in
provision towards restructuring and sale of properties. After adjusting for it, the
Sensex
(9.5)
(5.9)
20.7
company’s net profit rose by a modest 5.6% yoy to `1,026cr.
HUL
2.5
(0.7)
65.8
Outlook and valuation: We expect HUL to post a ~6% and ~6% CAGR in its top-
3-year price chart
line and bottom-line respectively, over FY2015-16E. At the current market price,
1100
the stock is trading at 37.6x FY2018E earnings. We maintain our Neutral view on
1000
the stock
900
800
Key financials (Consolidated)
700
600
Y/E March (` cr)
FY2015
FY2016
FY2017E
FY2018E
500
Net sales
31,972
33,299
35,497
38,230
400
% chg
9.4
4.2
6.6
7.7
Net profit
3,893
4,088
4,328
4,629
% chg
3.3
5.0
5.9
6.9
Source: Company, Angel Research
EBITDA margin (%)
16.9
17.1
17.1
17.1
EPS (`)
18.0
18.9
20.0
21.4
P/E (x)
44.7
42.6
40.2
37.6
P/BV (x)
43.3
37.3
32.5
28.5
RoE (%)
108.5
87.6
80.8
75.9
RoCE (%)
125.3
113.5
105.4
99.8
Amarjeet S Maurya
EV/Sales (x)
5.3
5.0
4.7
4.4
022-39357800 Ext: 6831
EV/EBITDA (x)
31.1
29.4
27.5
25.5
Source: Company, Angel Research; Note: CMP as of January 18, 2016
Please refer to important disclosures at the end of this report
1
Hindustan Unilever | 3QFY2016 Result Update
Exhibit 1: Consolidated quarterly performance
Y/E March (` cr)
3QFY16
3QFY15
% yoy
2QFY15
% qoq
9MFY16
9MFY15
% chg
Net Sales
7,981
7,774
2.7
7,955
0.3
24,042
23,130
3.9
Consumption of RM
3,742
3,848
(2.8)
3,899
(4.0)
11,544
11,797
(2.1)
(% of Sales)
46.9
49.5
49.0
48.0
51.0
Staff Costs
402
442
(9.1)
381
5.5
1,146
1,190
(3.7)
(% of Sales)
5.0
5.7
4.8
4.8
5.1
Advertising
1,138
977
16.4
1,145
(0.6)
3,436
2,847
20.7
(% of Sales)
14.3
12.6
14.4
14.3
12.3
Other Expenses
1,385
1,187
16.7
1,226
13.0
3,792
3,418
11.0
(% of Sales)
17.4
15.3
15.4
15.8
14.8
Total Expenditure
6,667
6,454
3.3
6,651
0.2
19,918
19,252
3.5
Operating Profit
1,314
1,321
(0.5)
1,304
0.8
4,124
3,878
6.3
OPM
16.5
17.0
17.4
17.2
16.8
Interest
0
4
(98.8)
0
66.7
0
17
(99.1)
Depreciation
82
73
12.4
76
7.9
233
216
7.9
Other Income
177
527
(66.5)
180
(1.8)
476
1,017
(53.2)
PBT (excl. Ext Items)
1,409
1,771
(20.5)
1,408
0.1
4,366
4,662
(6.3)
Ext (Income)/Expense
PBT (incl. Ext Items)
1,409
1,771
(20.5)
1,408
0.1
4,366
4,662
(6.3)
(% of Sales)
17.6
22.8
16.8
18.2
20.2
Provision for Taxation
437
519
445
1,373
1,365
0.6
(% of PBT)
31.0
29.3
23
31
29
Reported PAT
971
1,252
(22.4)
962
1.0
2,993
3,297
(9.2)
PATM
12.2
16.1
12.9
12.4
14.3
Extra-ordinary Items
(55)
280
(8)
(56)
343
Reported PAT
1,026
972
5.6
971
5.7
3,049
2,954
3.2
Equity shares (cr)
216
216
216
216
216
FDEPS (`)
4.7
4.5
5.6
4.5
5.7
14.1
13.7
3.2
Source: Company, Angel Research
January 18, 2016
2
Hindustan Unilever | 3QFY2016 Result Update
Exhibit 2: Segmental Performance
3QFY2016
3QFY2015
% chg
2QFY2016
% chg 9MFY16 9MFY15
% chg
Income
Soaps & Detergents
3,630
3,600
0.8
3,817
(4.9)
11,301
11,203
0.9
Personal Products
2,593
2,455
5.6
2,346
10.5
7,344
6,757
8.7
Beverages
984
920
7.0
953
3.3
2,852
2,655
7.4
Packaged Foods
470
420
11.8
507
(7.4)
1,585
1,415
12.0
Others
295
354
(16.7)
324
(9.1)
931
1,018
(8.5)
Total Gross Income
7,971
7,748
7,946
24,012
23,048
PBIT segment -wise bifurcation
Soaps & Detergents
509
502
1.3
490
3.8
1,597
1,545
3.4
Personal Products
748
681
9.9
612
22.3
2,073
1,800
15.2
Beverages
173
141
22.6
138
25.4
454
433
4.9
Packaged Foods
15
(21)
(170.3)
27
(44.4)
96
58
66.5
Others
(35)
(4)
839.1
10
(438.5)
(29)
(8)
284.8
Total PBIT
1,410
1,299
1,277
4,191
3,828
Less: Interest Exp
0
4
(98.8)
0
-
0
17
Less: Other Unallocable Exp
1
-
-
PBT
1,409
1,771
1,408
1,409
1,771
PBIT Margin (%)
Soaps & Detergents
14.0
14.0
12.8
14.1
13.8
Personal Products
28.9
27.7
26.1
28.2
26.6
Beverages
17.6
15.3
14.5
15.9
16.3
Packaged Foods
3.2
(5.1)
5.3
6.1
4.1
Others
(12.0)
(1.1)
3.2
(3.2)
(0.8)
Source: Company, Angel Research
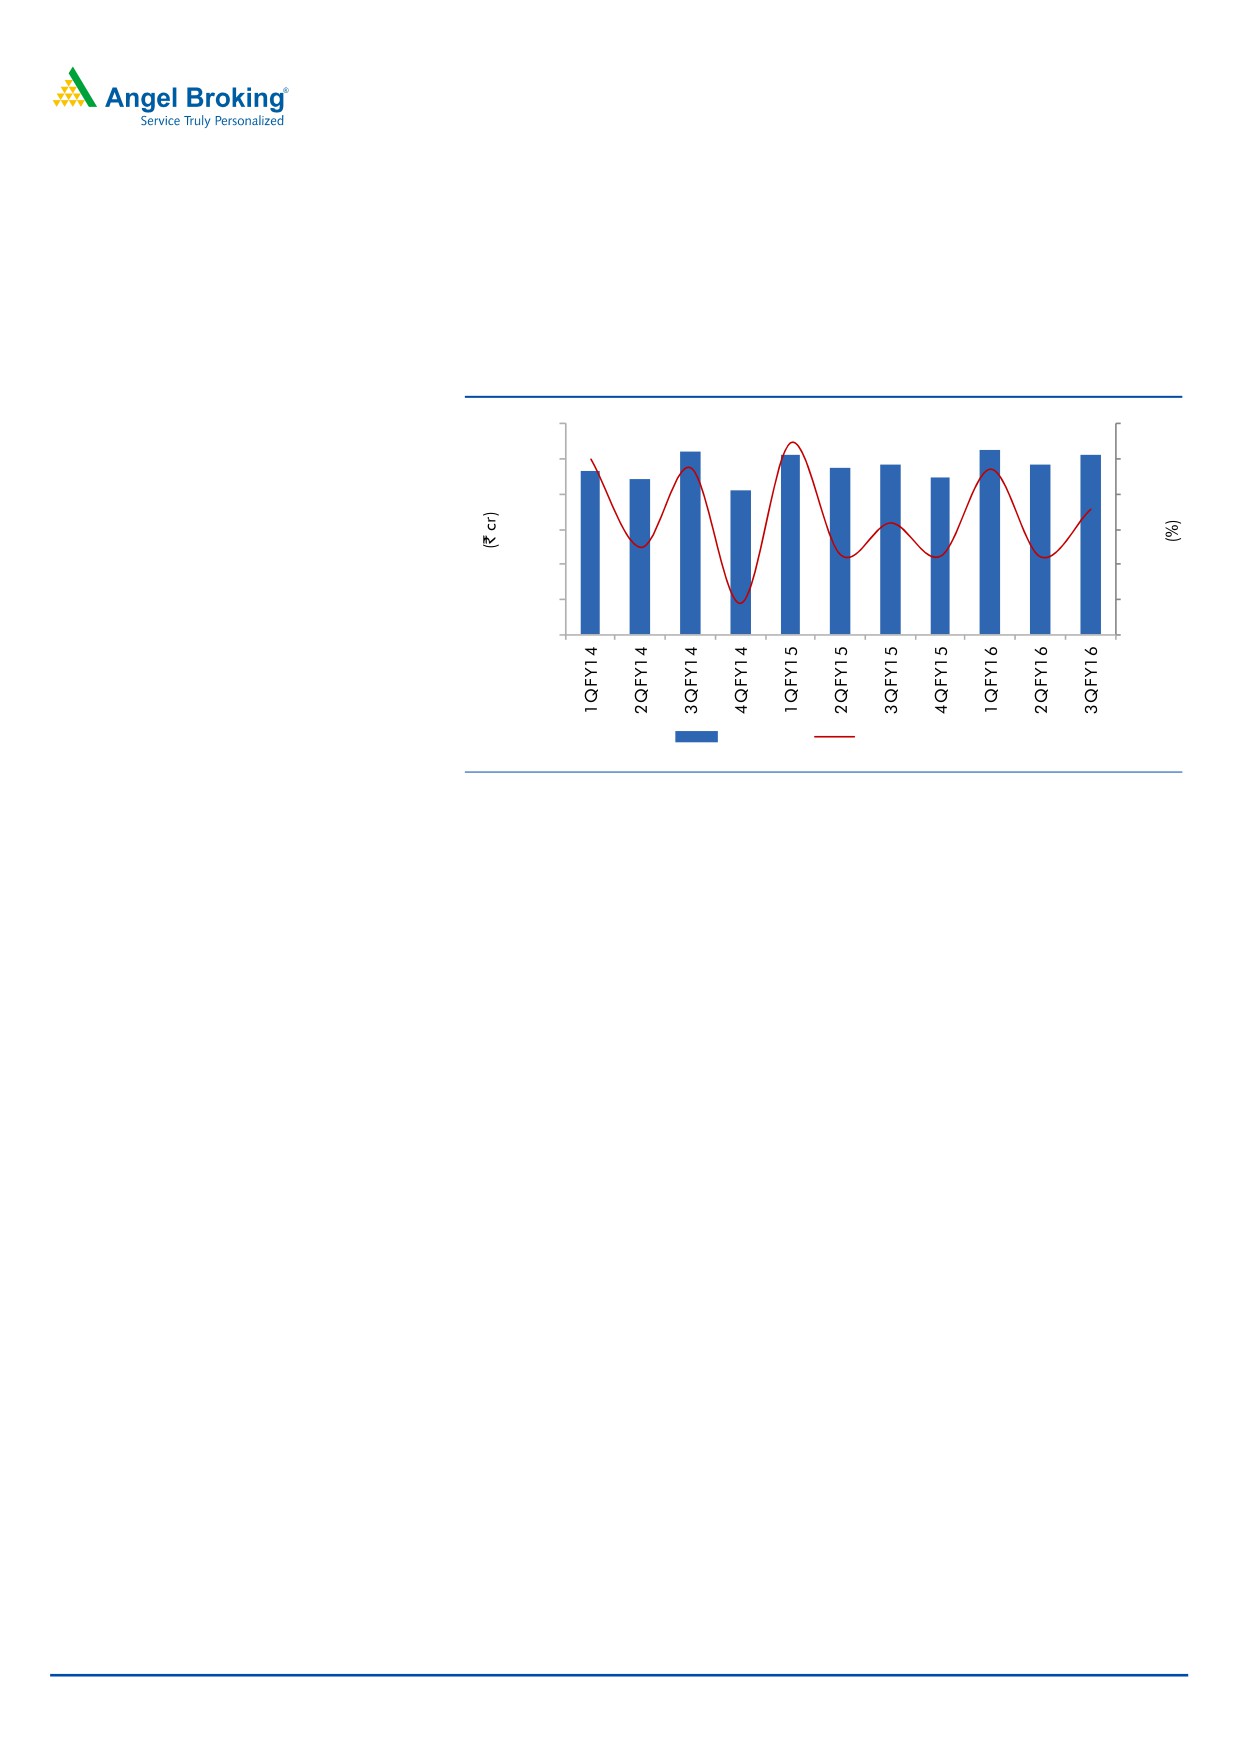
Overall top-line growth flattish
For 3QFY2016, HUL’s top-line rose by 2.7% yoy to `7,981cr. The soaps &
detergents business reported lower growth of 0.8% yoy due to weak macros. The
soaps category’s performance was supported by growth in Dove, Pears and
Lifebuoy as well as double-digit growth in the liquids portfolio. The detergents
segment saw double-digit growth in Surf and Rin.
The personal products division posted a growth of 5.6% yoy. The reported growth
of the segment was impacted by delayed winter and owing to one-time
realignment of channel spends undertaken to drive effectiveness in the market
place. In this segment, skin care delivered volume led growth driven by Fair &
Lovely, Pond’s and Lakme. Fair & Lovely continued to do well and saw an
encouraging response to the BB cream. The performance of Pond’s was led by
premium skin lightening while Lakme’s growth was buoyed by premium
innovations and facewash. Hair care maintained its strong volume led growth
momentum, with Dove and TRESemmé leading the category performance. In oral
care, the overall performance was subdued. Close Up’s growth was driven by
impactful activation while Pepsodent Clove and Salt continued to do well.
In the Beverages segment, the company reported a growth of 7%, primarily led by
volumes, which were driven by activations and market development initiatives by
the company. In the tea segment, Red Label, Taj Mahal and 3 Roses grew well and
January 18, 2016
3
Hindustan Unilever | 3QFY2016 Result Update
Lipton Green Tea registered another quarter of high growth on sustained market
development. In the coffee segment, Bru delivered double-digit growth and
achieved market leadership.
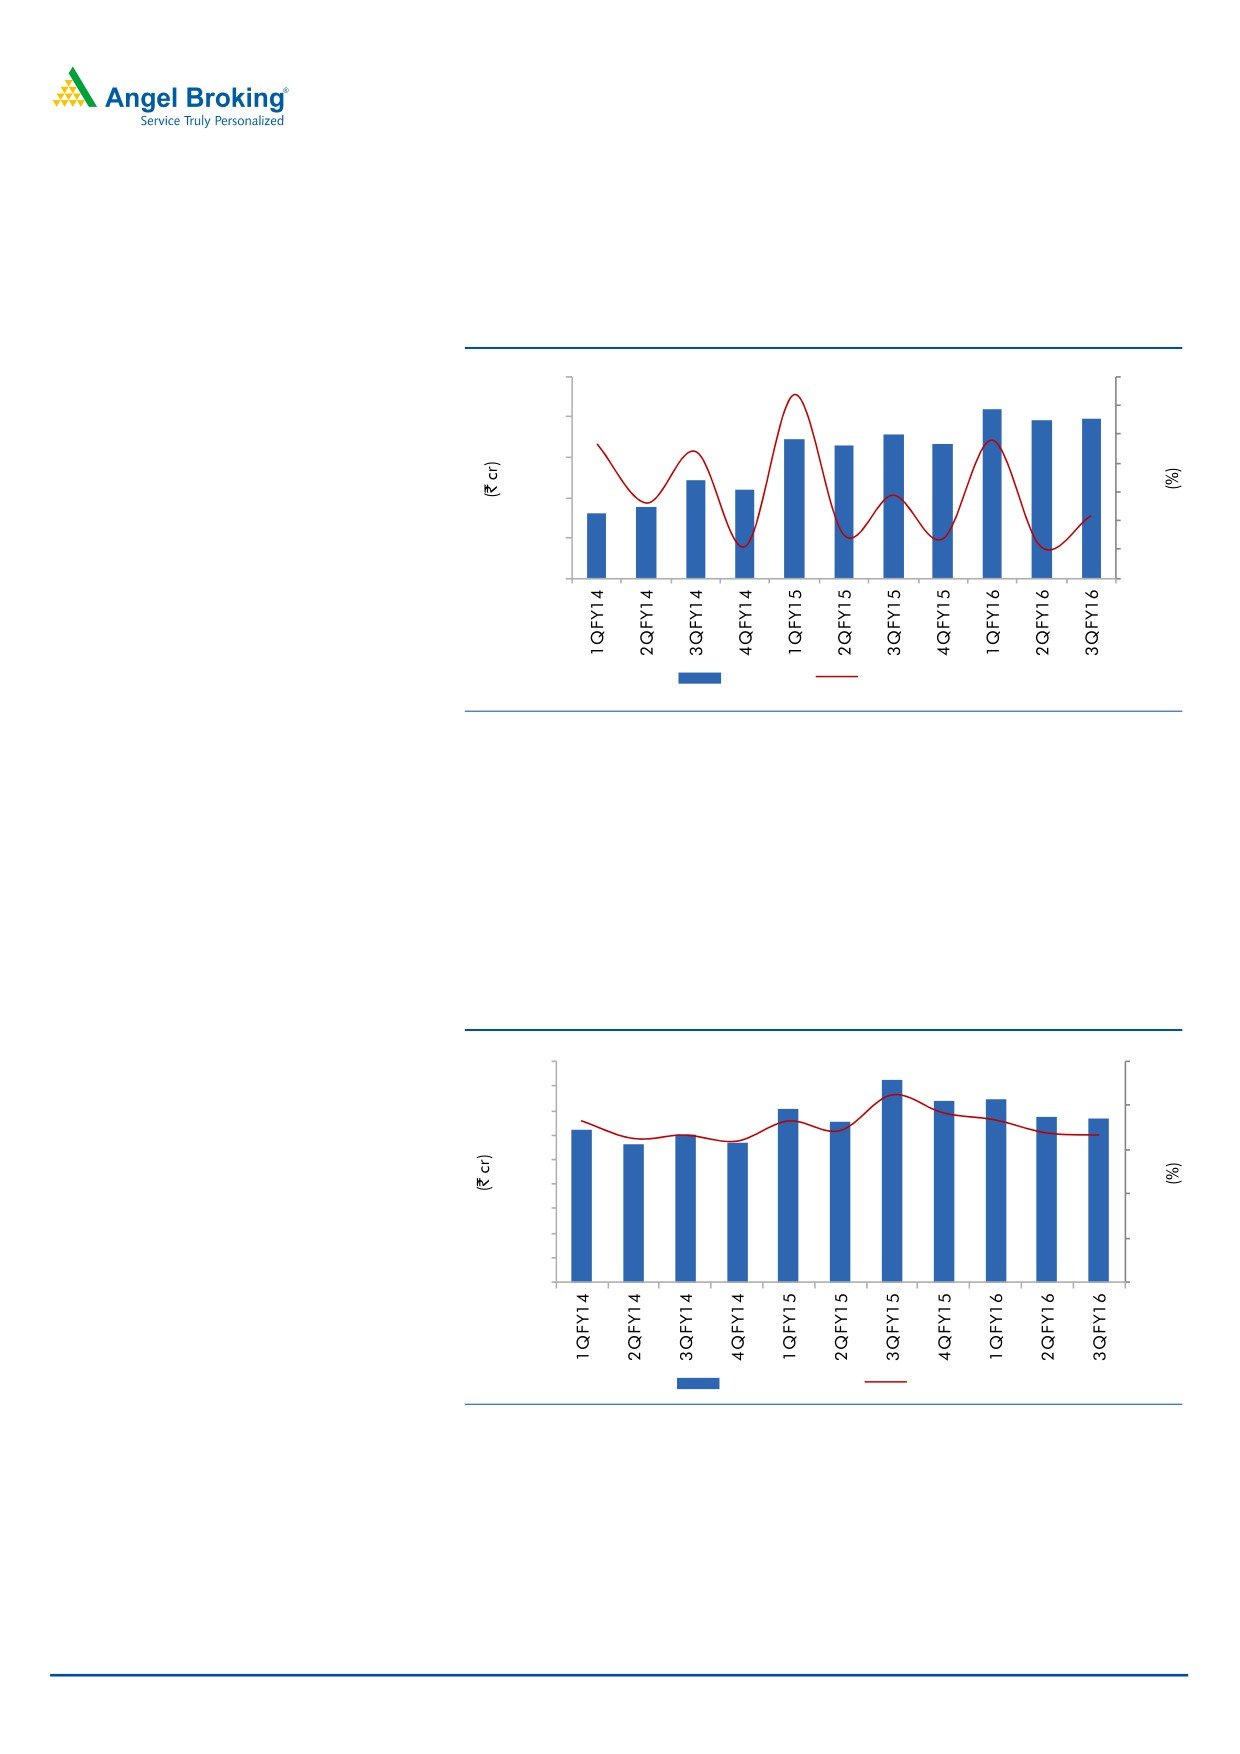
Exhibit 3: Top-line growth trend
8,500
10
8
8,000
6
7,500
4
2
7,000
-
6,500
(2)
6,000
(4)
Net Sales
QoQ growth (%)
Source: Company, Angel Research
Operating margin contracts due to higher advertisement and
other expenses
On the operating profit front, the company reported a de-growth of 0.5% yoy due
to lower sales growth. Further, the operating profit margin fell by 52bp yoy to
16.5% due to increase in advertisement and other expenses, which rose by 169bp
and 209bp as a percentage of sales, respectively.
Exhibit 4: Operating profit and margin trend
1,800
25
1,600
1,400
20
1,200
15
1,000
800
10
600
400
5
200
0
0
Operating Profit
Margin (%)
Source: Company, Angel Research
January 18, 2016
4
Hindustan Unilever | 3QFY2016 Result Update
Adjusted PAT grew ~5.6%
During the quarter, the company incurred `55cr under the exceptional items head,
which factored in provision towards restructuring and sale of properties. After
adjusting for it, the company’s net profit rose by a modest 5.6% yoy to `1,026cr.
Exhibit 5: Net Profit and growth trend
1,200
30
1,000
20
800
10
600
-
400
(10)
200
(20)
0
(30)
Net Profit
QOQ growth (%)
Source: Company, Angel Research
January 18, 2016
5
Hindustan Unilever | 3QFY2016 Result Update
Investment rationale
Largest FMCG player with leadership in several categories
HUL has presence across various product categories and has brands in both mass
and premium segments in most of these categories. The company’s products are
available at multiple price points and it is a leader in many of the categories in
which it has presence.
Outlook and valuation
We expect HUL to post a ~6% and ~6% CAGR in its top-line and bottom-line
respectively, over FY2015-16E. At the current market price, the stock is trading at
37.6x FY2018E earnings. We maintain our Neutral view on the stock.
Company background
HUL, a 52% subsidiary of Unilever, is one of India's largest consumer goods
companies. HUL is present across four main product categories - 1) Soaps and
Detergents (50% of revenue); 2) Personal Products (mainly shampoos, skin care
and toothpaste; 30% of revenue); 3) Beverages (mainly tea and coffee; 12% of
revenue); 4) Packaged Foods and Ice cream (6% of revenue); and 5) Others,
mainly consisting of water purifiers. The company, with its iconic brands such as
Lux, Lifebuoy, Surf Excel, Rin, Wheel, Fair & Lovely, Pond's, Vaseline, Lakmé, Dove,
Clinic Plus, Sunsilk, Pepsodent, Close Up, Axe, Brooke Bond, Bru, Knorr, Kissan and
Walls, has a vast presence in rural as well as urban Indian markets, with one of the
largest distribution networks spanning over 6.3mn retail outlets.
January 18, 2016
6
Hindustan Unilever | 3QFY2016 Result Update
Consolidated Profit & Loss Statement
Y/E March (` cr)
FY2013
FY2014
FY2015
FY2016E
FY2017E
FY2018E
Total operating income
27,004
29,234
31,972
33,299
35,497
38,230
% chg
15.2
8.3
9.4
4.2
6.6
7.7
Total Expenditure
22,799
24,488
26,558
27,605
29,427
31,693
Raw Materials
14087
14870
16176
16583
17464
18580
Selling & Administrative Exp
3290
3675
3944
4162
4508
4932
Personnel Expenses
1,413
1,573
1,724
1,865
2,059
2,294
Others Expenses
4,009
4,371
4,715
4,995
5,396
5,887
EBITDA
4,205
4,746
5,414
5,694
6,070
6,537
% chg
20.7
12.8
14.1
5.2
6.6
7.7
(% of Net Sales)
15.6
16.2
16.9
17.1
17.1
17.1
Depreciation& Amortisation
251
296
322
350
377
407
EBIT
3,954
4,450
5,091
5,344
5,693
6,130
% chg
21.7
12.5
14.4
5.0
6.5
7.7
(% of Net Sales)
14.6
15.2
15.9
16.0
16.0
16.0
Interest & other Charges
26
41
18
0
0
0
Other Income
1,138
806
1,246
600
600
600
(% of PBT)
22.5
15.4
19.7
10.1
9.5
8.9
Share in profit of Associates
-
-
-
-
-
-
PBT (reported)
5,066
5,215
6,320
5,943
6,293
6,730
Tax
1,227
1,259
1,944
1,842
1,951
2,086
(% of PBT)
24.2
24.1
30.8
31.0
31.0
31.0
PAT (reported)
3,839
3,956
4,376
4,101
4,342
4,644
Less: Minority interest (MI)
10
10
12
13
14
15
PAT after MI (reported)
3,829
3,946
4,363
4,088
4,328
4,629
Prior Period & Extra. Exp./(Inc.)
459
179
470
-
-
-
ADJ. PAT
3,370
3,767
3,893
4,088
4,328
4,629
% chg
24.7
11.8
3.3
5.0
5.9
6.9
(% of Net Sales)
12.5
12.9
12.2
12.3
12.2
12.1
Basic & diluted EPS (`)
15.6
17.4
18.0
18.9
20.0
21.4
Adjusted EPS EPS (`)
15.6
17.4
18.0
18.9
20.0
21.4
% chg
24.7
11.8
3.3
5.0
5.9
6.9
January 18, 2016
7
Hindustan Unilever | 3QFY2016 Result Update
Consolidated Balance Sheet
Y/E March (` cr)
FY2013
FY2014
FY2015
FY2016E FY2017E FY2018E
SOURCES OF FUNDS
Equity Share Capital
216
216
216
216
216
216
Reserves& Surplus
2,649
3,321
3,805
4,449
5,141
5,882
Shareholders Funds
2,865
3,537
4,022
4,665
5,358
6,098
Minority Interest
21
22
25
25
25
25
Total Loans
25
46
43
43
43
43
Deferred Tax Liability
218
241
278
278
278
278
Total Liabilities
3,128
3,846
4,367
5,015
5,707
6,447
APPLICATION OF FUNDS
Gross Block
4,418
5,079
5,412
5,712
6,062
6,462
Less: Acc. Depreciation
1,986
2,333
2,591
2,941
3,318
3,725
Net Block
2,431
2,746
2,821
2,771
2,744
2,737
Capital Work-in-Progress
222
373
516
516
516
516
Investments
2,252
2,838
3,025
3,025
3,025
3,025
Current Assets
6,977
7,617
7,869
8,605
9,645
11,082
Inventories
2,706
2,940
2,849
2,737
2,918
3,142
Sundry Debtors
997
1,017
1,011
1,095
1,167
1,257
Cash
1,901
2,516
2,689
3,408
3,786
4,580
Loans & Advances
655
598
731
766
1,065
1,147
Other Assets
718
547
588
599
710
956
Current liabilities
9,181
10,149
10,341
10,379
10,701
11,391
Net Current Assets
(2,204)
(2,531)
(2,472)
(1,775)
(1,055)
(309)
Deferred Tax Asset
426
421
477
477
477
477
Mis. Exp. not written off
-
-
-
-
-
-
Total Assets
3,128
3,846
4,367
5,015
5,707
6,447
January 18, 2016
8
Hindustan Unilever | 3QFY2016 Result Update
Consolidated Cashflow Statement
Y/E March (` cr)
FY2013
FY2014
FY2015
FY2016E FY2017E FY2018E
Profit before tax
4,460
4,980
5,640
5,943
6,293
6,730
Depreciation
251
296
322
350
377
407
Change in Working Capital
429
429
405
(342)
(6)
(372)
Interest / Dividend (Net)
(140)
(290)
(258)
(225)
0
0
Direct taxes paid
(1,074)
(1,384)
(2,030)
(1,842)
(1,951)
(2,086)
Others
(323)
(212)
(957)
549
(380)
404
Cash Flow from Operations
3,605
3,818
3,124
4,433
4,333
5,083
(Inc.)/ Dec. in Fixed Assets
(7)
111
493
(300)
(350)
(400)
(Inc.)/ Dec. in Investments
70
(586)
(187)
-
-
-
Cash Flow from Investing
63
(475)
306
(300)
(350)
(400)
Issue of Equity
7
2
2
-
-
-
Inc./(Dec.) in loans
25
(15)
(3)
(0)
-
-
Dividend Paid (Incl. Tax)
(4,000)
(2,811)
(3,245)
(3,434)
(3,636)
(3,888)
Interest / Dividend (Net)
212
98
(9)
20
30
(1)
Cash Flow from Financing
(3,764)
(2,728)
(3,256)
(3,414)
(3,605)
(3,889)
Inc./(Dec.) in Cash
(96)
615
173
719
378
794
Opening Cash balances
1,996
1,901
2,516
2,689
3,408
3,786
Closing Cash balances
1,901
2,516
2,689
3,408
3,786
4,580
January 18, 2016
9
Hindustan Unilever | 3QFY2016 Result Update
Key Ratios
Y/E March
FY2013
FY2014
FY2015
FY2016E FY2017E FY2018E
Valuation Ratio (x)
P/E (on FDEPS)
51.6
46.2
44.7
42.6
40.2
37.6
P/CEPS
42.5
40.9
37.0
39.1
36.9
34.4
P/BV
60.7
49.2
43.3
37.3
32.5
28.5
Dividend yield (%)
2.3
1.6
1.9
2.0
2.1
2.2
EV/Sales
6.3
5.8
5.3
5.0
4.7
4.4
EV/EBITDA
40.4
35.5
31.1
29.4
27.5
25.5
EV / Total Assets
13.8
12.1
11.4
10.9
10.2
9.3
Per Share Data (`)
EPS (Basic)
15.6
17.4
18.0
18.9
20.0
21.4
EPS (fully diluted)
15.6
17.4
18.0
18.9
20.0
21.4
Cash EPS
18.9
19.6
21.7
20.6
21.8
23.3
DPS
18.5
13.0
15.0
15.9
16.8
18.0
Book Value
13.2
16.3
18.6
21.6
24.8
28.2
Returns (%)
ROCE
136.8
124.2
125.3
113.5
105.4
99.8
ROE
133.7
111.5
108.5
87.6
80.8
75.9
Turnover ratios (x)
Asset Turnover (Gross Block)
6.1
5.8
5.9
5.8
5.9
5.9
Inventory / Sales (days)
37
37
33
30
30
30
Receivables (days)
13
13
12
12
12
12
Payables (days)
58
62
58
58
57
57
WC cycle (ex-cash) (days)
(8)
(12)
(14)
(16)
(15)
(15)
January 18, 2016
10
Hindustan Unilever | 3QFY2016 Result Update
Research Team Tel: 022 - 39357800
DISCLAIMER
Angel Broking Private Limited (hereinafter referred to as “Angel”) is a registered Member of National Stock Exchange of India Limited,
Bombay Stock Exchange Limited and Metropolitian Stock Exchange of India Limited. It is also registered as a Depository Participant
with CDSL and Portfolio Manager with SEBI. It also has registration with AMFI as a Mutual Fund Distributor. Angel Broking Private
Limited is a registered entity with SEBI for Research Analyst in terms of SEBI (Research Analyst) Regulations, 2014 vide registration
number INH000000164. Angel or its associates has not been debarred/ suspended by SEBI or any other regulatory authority for
accessing /dealing in securities Market. Angel or its associates including its relatives/analyst do not hold any financial
interest/beneficial ownership of more than 1% in the company covered by Analyst. Angel or its associates/analyst has not received any
compensation / managed or co-managed public offering of securities of the company covered by Analyst during the past twelve
months. Angel/analyst has not served as an officer, director or employee of company covered by Analyst and has not been engaged in
market making activity of the company covered by Analyst.
This document is solely for the personal information of the recipient, and must not be singularly used as the basis of any investment
decision. Nothing in this document should be construed as investment or financial advice. Each recipient of this document should
make such investigations as they deem necessary to arrive at an independent evaluation of an investment in the securities of the
companies referred to in this document (including the merits and risks involved), and should consult their own advisors to determine
the merits and risks of such an investment.
Reports based on technical and derivative analysis center on studying charts of a stock's price movement, outstanding positions and
trading volume, as opposed to focusing on a company's fundamentals and, as such, may not match with a report on a company's
fundamentals.
The information in this document has been printed on the basis of publicly available information, internal data and other reliable
sources believed to be true, but we do not represent that it is accurate or complete and it should not be relied on as such, as this
document is for general guidance only. Angel Broking Pvt. Limited or any of its affiliates/ group companies shall not be in any way
responsible for any loss or damage that may arise to any person from any inadvertent error in the information contained in this report.
Angel Broking Pvt. Limited has not independently verified all the information contained within this document. Accordingly, we cannot
testify, nor make any representation or warranty, express or implied, to the accuracy, contents or data contained within this document.
While Angel Broking Pvt. Limited endeavors to update on a reasonable basis the information discussed in this material, there may be
regulatory, compliance, or other reasons that prevent us from doing so.
This document is being supplied to you solely for your information, and its contents, information or data may not be reproduced,
redistributed or passed on, directly or indirectly.
Neither Angel Broking Pvt. Limited, nor its directors, employees or affiliates shall be liable for any loss or damage that may arise from
or in connection with the use of this information.
Note: Please refer to the important ‘Stock Holding Disclosure' report on the Angel website (Research Section). Also, please refer to the
latest update on respective stocks for the disclosure status in respect of those stocks. Angel Broking Pvt. Limited and its affiliates may
have investment positions in the stocks recommended in this report.
Disclosure of Interest Statement
Hindustan Unilever
1. Analyst ownership of the stock
No
2. Angel and its Group companies ownership of the stock
No
3. Angel and its Group companies' Directors ownership of the stock
No
4. Broking relationship with company covered
No
Note: We have not considered any Exposure below ` 1 lakh for Angel, its Group companies and Directors
Ratings (Based on expected returns
Buy (> 15%)
Accumulate (5% to 15%)
Neutral (-5 to 5%)
over 12 months investment period):
Reduce (-5% to -15%)
Sell (< -15%)
January 18, 2016
11