4QFY2016 Result Update | Ceramic Products
May 27, 2016
HSIL
ACCUMULATE
CMP
`290
Company Update
Target Price
`310
Y/E March (` cr)
4QFY16 4QFY15
% chg (yoy)
3QFY16
% chg (qoq)
Investment Period
12 Months
Net sales
596
559
6.6
506
17.7
EBITDA
99
106
(6.3)
95
4.0
Stock Info
EBITDA margin (%)
16.6
18.9
(230)bp
18.8
(220)bp
Sector
Ceramic Products
Adjusted PAT
38
40
(4.3)
37
3.1
Source: Company, Angel Research
Market Cap (` cr)
2,095
Net Debt
596
HSIL’s reported standalone numbers for 4QFY2016 have come in mostly in-line
with our estimates. The top-line grew by 6.6% yoy to `596cr. The raw material
Beta
0.8
cost declined by 77bp yoy to 39.9% of sales while employee and other expenses
52 Week High / Low
370 / 224
increased by
139bp yoy and
168bp yoy to
11.1% and
32.4% of sales,
Avg. Daily Volume
18,724
respectively. As a result, the EBITDA margin declined by 230bp yoy to 16.6%.
Interest cost was lower by 49.9% yoy while tax rate was higher at 38.5% vs 30.8%
Face Value (`)
2
in 4QFY2015. Consequently, the bottom-line de-grew by 4.3% yoy to `38cr.
BSE Sensex
26,367
Building products’ performance under pressure; but long term prospects intact:
Nifty
8,070
The quarterly numbers for the core Building products division were under pressure
Reuters Code
HSNT.BO
reflecting overall sluggishness in the new construction market. However, the
Bloomberg Code
HSI.IN
Faucets division continued its strong performance which will likely drive the
revenue growth in the near term. On the profitability front, the company has
made incremental investments in setting up its sales channel for the Consumer
Shareholding Pattern (%)
products division and increased its advertisement spend by roping in some
Promoters
47.1
Bollywood celebrities to endorse products, coupled with initial losses in the
MF / Banks / Indian Fls
26.4
consumer products business which impacted segmental margins during the
quarter. However, the Management has indicated that excluding the cost for
FII / NRIs / OCBs
12.0
development of sales channel, the EBIT margin for the core business is stable. We
Indian Public / Others
14.4
believe that the margin for the segment should improve gradually once the
Consumer products division’s sales pick up. In the longer run, we expect HSIL to
leverage on its strong position/brand in the sanitaryware industry to capitalize on
Abs.(%)
3m 1yr 3yr
improvement in the real-estate sector.
Sensex
13.9
(4.2)
31.6
Packaging products’ profitability improves: Although the segment has posted
HSIL
25.3
(21.5)
166.6
muted growth numbers on the top-line front, the profitability of the segment has
improved on account of a better product mix in terms of revenue composition,
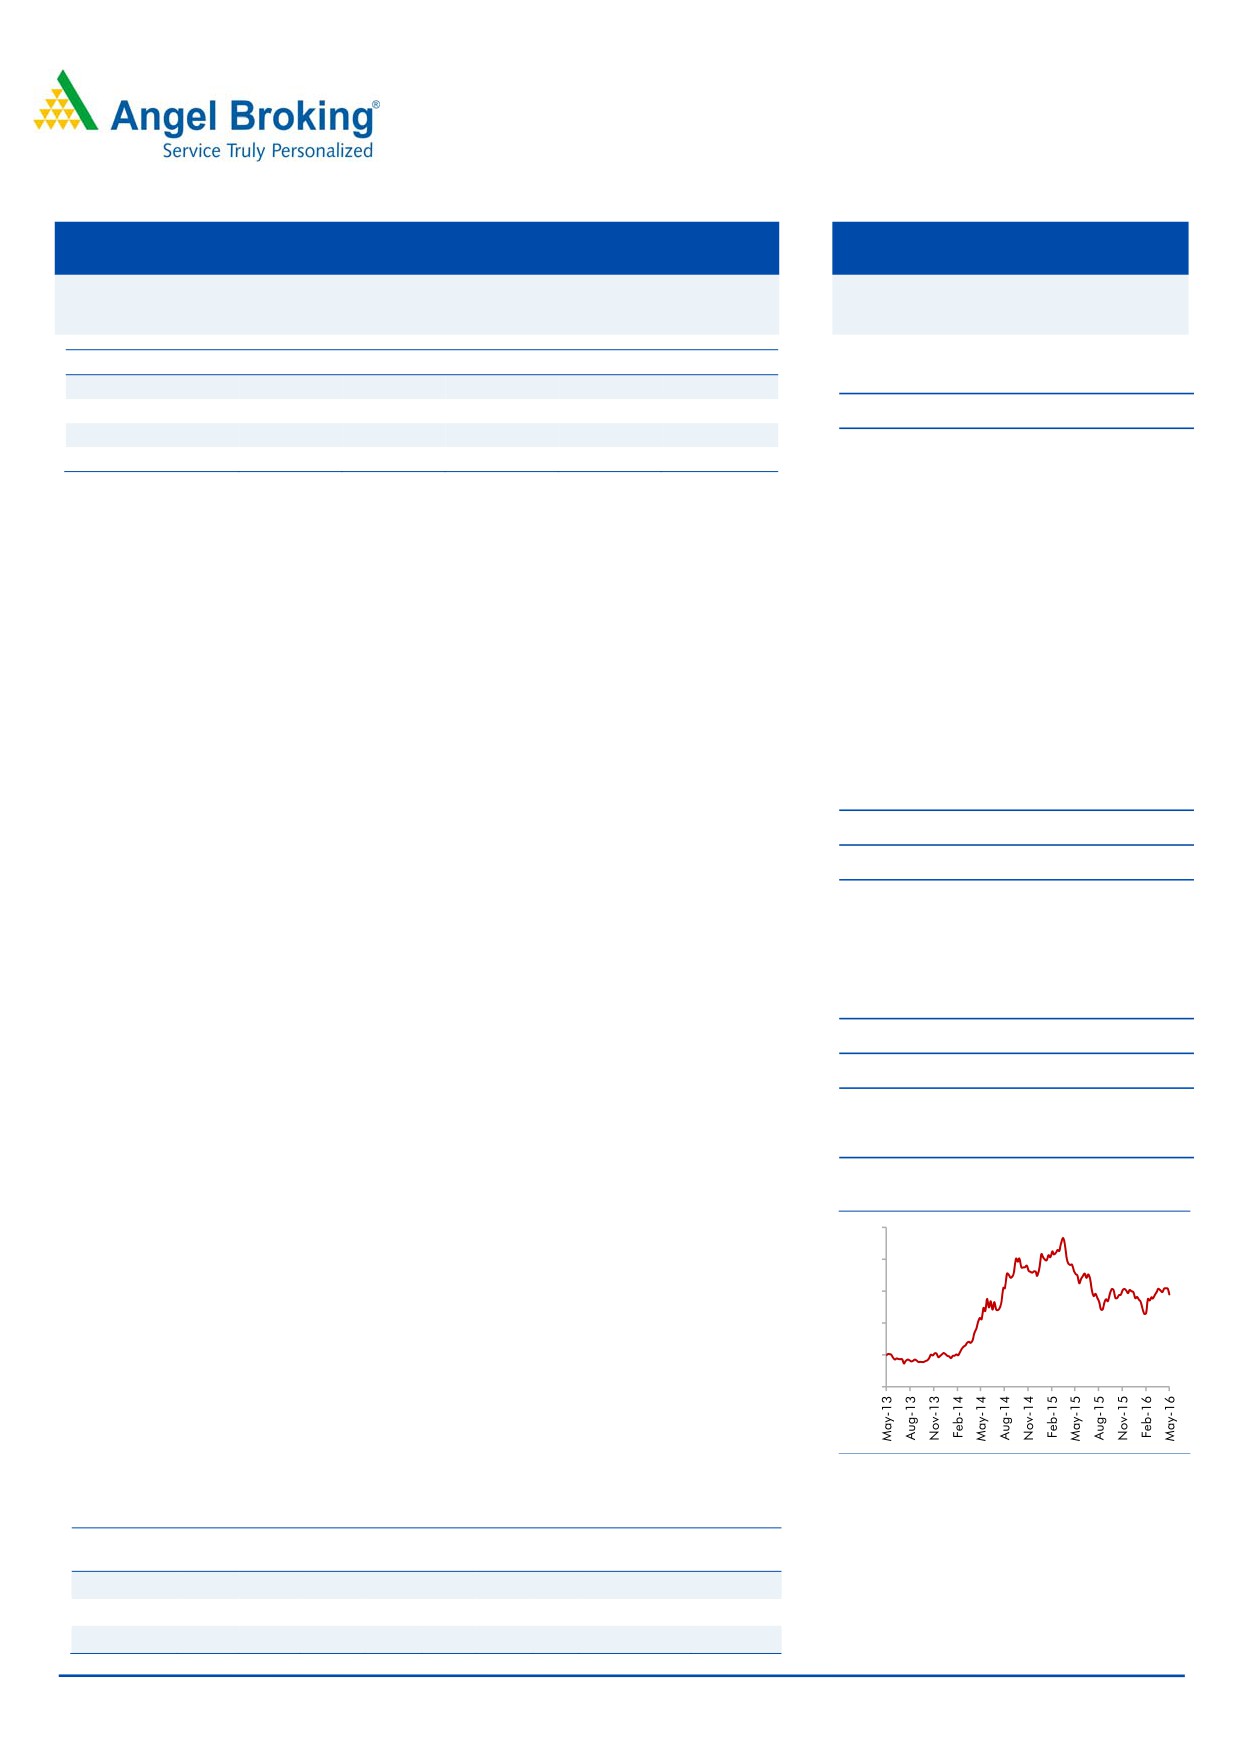
3 Year Daily price chart
better cost management, and due to decline in fuel prices. Going forward, the
500
Management has acknowledged the threat of further prohibition on liquor by state
400
governments but expects the damage to be somewhat offset by rising beer consumption.
300
Outlook and valuation: We has revised downwards our estimates for FY2017
200
for both Building and Packaging products segments but expect FY2018E to be
100
better on account of contribution from newer businesses as well as pick up in
volumes. Further, favorable pricing for the core Building products business should
-
also aid the company in delivering better numbers.
At the current market price, the stock trades at 15.0x its FY2018E earnings. We
Source: Company, Angel Research
have an Accumulate rating on the stock with a target price of `310.
Key Financials (Consolidated)
Sales OPM
PAT EPS ROE
PE PBV EV/EBITDA EV/sales
Y/E March
(` cr)
(%)
(` cr)
(`)
(%)
(x)
(x)
(x)
(x)
FY2016
2,056
15.3
89
12.3
6.6
23.5
1.5
7.2
1.3
Milan Desai
FY2017E
2,223
15.8
111
15.3
7.8
18.9
1.4
6.5
1.3
Tel: 022- 4000 3600 Ext: 6846
FY2018E
2,515
16.3
140
19.4
9.3
15.0
1.4
5.5
1.1
Source: Company, Angel Research; Note: CMP as of May 26, 2016
Please refer to important disclosures at the end of this report
1
HSIL | 4QFY2016 Result Update
Exhibit 1: 4QFY2016 performance (Standalone)
Y/E March (` cr)
4QFY16
4QFY15
% chg (yoy)
3QFY16
% chg (qoq)
1HFY16
1HFY15
% chg
Net Sales
596
559
6.6
506
17.7
842
836
0.7
Net raw material
238
227
4.6
181
31.3
277
283
(2.0)
(% of Sales)
39.9
40.7
(77)bp
35.8
411bp
32.9
33.8
(92)bp
Staff Costs
66
54
21.9
61
9.1
107
91
18.6
(% of Sales)
11.1
9.7
139bp
12.0
(88)bp
12.8
10.8
192bp
Other Expenses
193
172
12.5
169
14.1
318
322
(1.0)
(% of Sales)
32.4
30.7
168bp
33.4
(104)bp
37.8
38.5
(68)bp
Total Expenditure
497
453
9.6
411
20.9
703
695
1.1
Operating Profit
99
106
(6.3)
95
4.0
140
141
(1.1)
OPM (%)
16.6
18.9
(230)bp
18.8
(220)bp
16.6
16.9
(32)bp
Interest
9
18
(49.9)
10
(6.4)
20
36
(45.5)
Depreciation
29
31
(6.6)
29
0.5
57
57
1.1
Other Income
1
1
32.7
1
(12.7)
2
2
2.6
PBT
62
58
7.8
58
7.3
65
51
27.9
(% of Sales)
10.4
10.3
11.4
7.7
6.1
Tax
24
17.7
34.9
21
14.7
24
17
39.1
(% of PBT)
38.5
30.8
36.1
36.1
33.2
Reported PAT
38
40
(4.3)
37
3.1
42
34
22.4
PATM
6.4
7.1
245bp
7.3
4.9
4.1
245bp
Source: Company, Angel Research
Exhibit 2: Actual vs. Angel estimates (4QFY2016)
Actual (` cr)
Estimate (` cr)
Var (%)
Total Income
596
581
2.6
EBIDTA
99
96
3.2
EBIDTA margin (%)
16.6
16.6
8bp
Adjusted PAT
38
37
3.1
Source: Company, Angel Research
HSIL’s numbers for 4QFY2016 have come in in-line with our estimates. Its
standalone top-line for the quarter grew by 6.6% yoy to `596cr (vs our estimate of
`581cr). The Building products segment grew by 9.0% yoy to `314cr while the
Packaging products segment grew by 4.1% yoy to `282cr.
The raw material cost was stable during the quarter; however employee and other
expenses grew by 139bp yoy and 168bp yoy to 11.1% and 32.4% of sales,
respectively. This could be attributed to higher costs related to setting up a channel
for the Consumer products division and due to higher advertisement spend. As a
result, the EBITDA margin contracted by 230bp yoy to 16.6%, which is the same as
our estimate. The EBIT margin for the Building products segment declined by
530bp yoy to 13.2% while that of the Packaging products business increased by
265bp yoy to 15.1%.
Owing to lower debt on the balance sheet, the interest expense for the quarter
declined by 49.9% yoy to `9cr but the tax rate was higher at 38.5% vs 30.8% in
4QFY2015. With the operating performance coming under pressure, the net profit
declined by 4.3% yoy to `38cr vis-à-vis our estimate of `37cr.
May 27, 2016
2
HSIL | 4QFY2016 Result Update
Segmental Performance
Exhibit 3: Segmental Review (Standalone)
Y/E Mar (` cr)
4QFY16
4QFY15
% chg (yoy) 3QFY16
% chg (qoq)
Revenue
A) Building Products
314
288
9.0
268
17.4
B) Packaging Products
282
270
4.1
239
18.1
Total
596
559
6.6
506
17.7
EBIT
A) Building Products
41.4
53.2
(22.3)
43.3
(4.4)
B) Packaging Products
42.5
33.6
26.3
35.3
20.3
EBIT Margin(%)
A) Building Products
13.2
18.5
(530)bp
16.2
(300)bp
B) Packaging Products
15.1
12.4
265bp
14.8
28bp
Source: Company, Angel Research
Conference call takeaways
For FY2016, the sanitaryware business grew by ~7% and accounted for 65%
of the Building products business’ revenue. Demand is likely to remain muted
in the near term. The company is likely to raise capacity from 3.8mn pieces to
4.2mn pieces by FY2017E. Utilization levels stood at ~91% for FY2016.
The Faucet division posted robust growth of ~22% for FY2016 and accounted
for 24% of Building products segment’s revenue. The capacity utilization was
at ~65%.
Building products’ margins were under pressure on account of higher ad
spend and expenses related to setting up of a channel for the Consumer
products business. Core business EBIT margins were stable.
The Consumer products business’ revenue for the year was at `60cr vs `25cr
in FY2016. For 4QFY2016, the revenue from Consumer products was `13.5cr
and it contributed a loss of `9cr towards the total EBIT for Building products.
All capital expenditure related to the Pipes business is expected to be
capitalized in FY2017.
The Packaging products business is likely to be under pressure. The company
will monitor developments to determine the status of the fourth furnace. The
capacity utilization on basis of three furnaces stood at 95%.
The company’s Retail business continues to be a drag on profitability. The
company is taking measures to curb costs and is selectively closing down loss-
making stores. The Management remains hopeful about the long term
prospects of the business.
May 27, 2016
3
HSIL | 4QFY2016 Result Update
Investment arguments
Enhanced capacity to pay-off once demand scenario improves
HSIL’s Management has guided that it will be increasing its capacity for the
sanitaryware business from the existing 3.8mn pieces to 4.2mn pieces/year. This
was due to be augmented in FY2016 but in light of dampened new construction
market, the expansion was deferred as per our reckoning. The Faucet division is
performing well and the company will look to gear the utilization levels at its faucet
plant where work was previously being outsourced. Although in the near term, the
sanitaryware business is expected to remain under mild pressure as top cities are
facing high inventory levels, the company has been making inroads into Tier II & III
towns to drive volumes. We expect volumes to flow in once the demand scenario
improves.
Packaging Products profitability improves, volumes to remain
lackluster
The poor performing Packaging products business had been a drag on the overall
performance of the company in the past. This was on account of low demand,
over capacity in the industry and rising fuel & raw materials costs. Improvement in
market conditions which resulted in better realizations along with measures taken
by the company such as substituting high cost furnace oil with alternate fuel,
renegotiation of terms with vendors for raw material sourcing, and new product
introductions amongst others, have resulted in improvement in profitability of the
business. Going forward, the volumes for the division are expected to remain under
pressure on account of various state governments mulling over banning liquor sales.
However, the Management has mentioned that it will look to drive volumes from the
beer segment on account of its growing popularity.
Leading position in Building products industry with strong brand
recall to provide an edge
HSIL holds a leading position in the sanitaryware industry (organized segment). Of
the total revenue, ~85% is accounted by the dealer distribution network (amongst
the largest in the industry) while 15% is contributed by institutional sales to large
builders, commercial space developers, hospitals, and hotels. The company has a
wide product offering catering to various price points in the sanitaryware, faucets
and in other product lines. The company has been aggressive in promoting its
brand and has roped in some Bollywood celebrities to push sales.
New businesses to add to Consumer products revenues
The Consumer products business of the company has been entailing investment in
terms of setting up separate sales vertical. The company has launched consumer
electrical products like water and air purifiers, water heaters, etc in the recent past
and expects them to garner a share of ~5% share in the ~`10,000cr market. The
company is focusing on the premium segment which garner gross margins of
~35%.
May 27, 2016
4
HSIL | 4QFY2016 Result Update
Financials
Exhibit 4: Key assumptions (Consolidated)
Key Assumptions
FY2017E
FY2018E
Building Products Sales (` cr)
1,179
1,418
Yoy Growth
14.0
20.3
Packaging Products Sales (` cr)
933
975
Yoy Growth
2.6
4.5
Source: Company, Angel Research
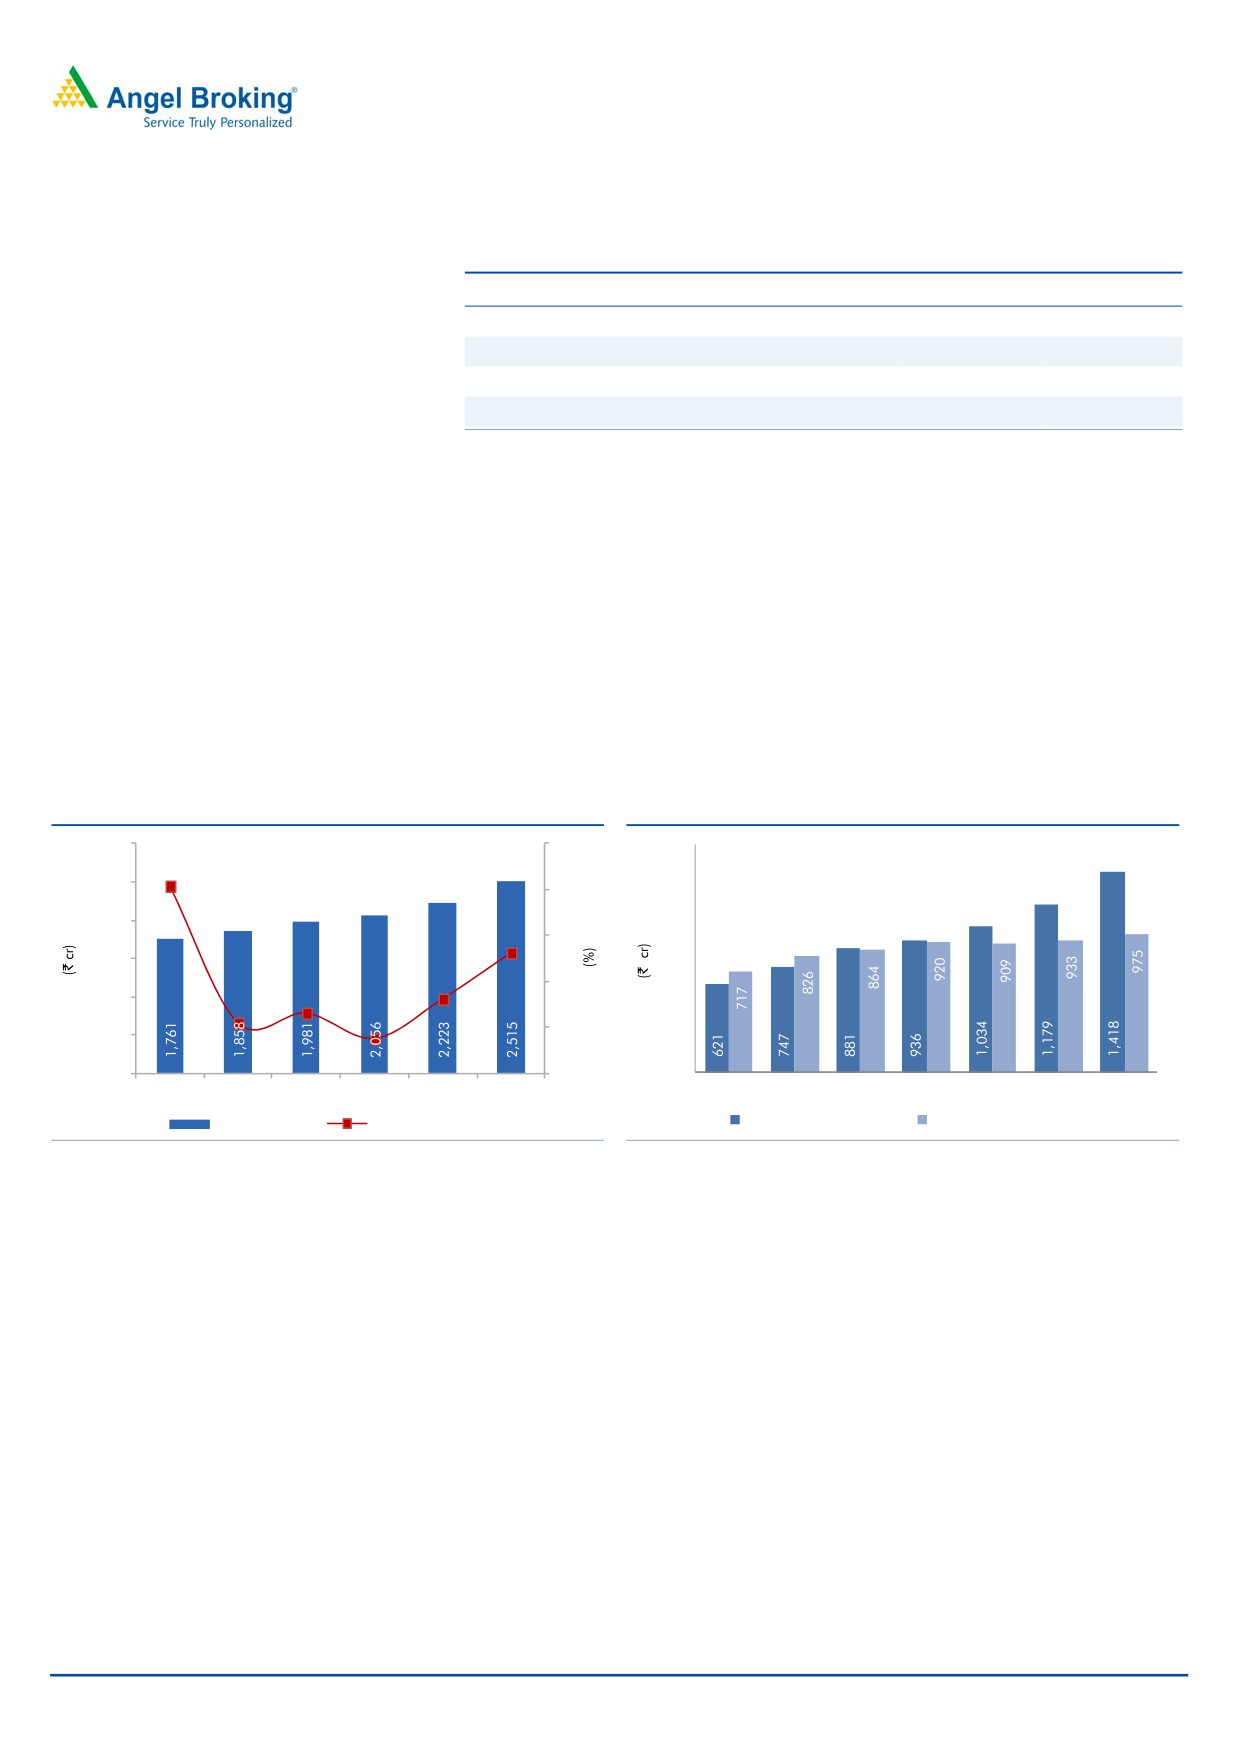
Top-line to post 10.6% CAGR over FY2016-FY2018E
We expect the Building products business to grow at 14.0% in FY2017E on account
of continued performance of the Faucet business and slightly higher contribution
from the Consumer electrical products business. As the Management has guided
that the Pipes business will be capitalized in FY2017E, we expect some contribution
from it towards the Building products segment revenue in FY2018E. The Packaging
products business is expected to post nominal growth over FY2016-18E. As a
result, we expect the top-line to post a revenue CAGR of 10.6% over FY2016-18E
to `2,515cr.
Exhibit 5: Sales growth to rebound
Exhibit 6: Segmental sales trend
3,000
25
1,600
1,400
2,500
20.4
20
1,200
2,000
15
1,000
1,500
13
.1
800
10
600
1,000
8.1
6.6
400
5.5
5
500
3.8
200
-
0
-
FY2013
FY2014
FY2015
FY2016
FY2017E FY2018E
FY2012
FY2013
FY2014
FY2015
FY2016
FY2017E FY2018E
Net sales (LHS)
Net sales yoy growth (RHS)
Building Products segment Packaging Products segment
Source: Company, Angel Research
Source: Company, Angel Research
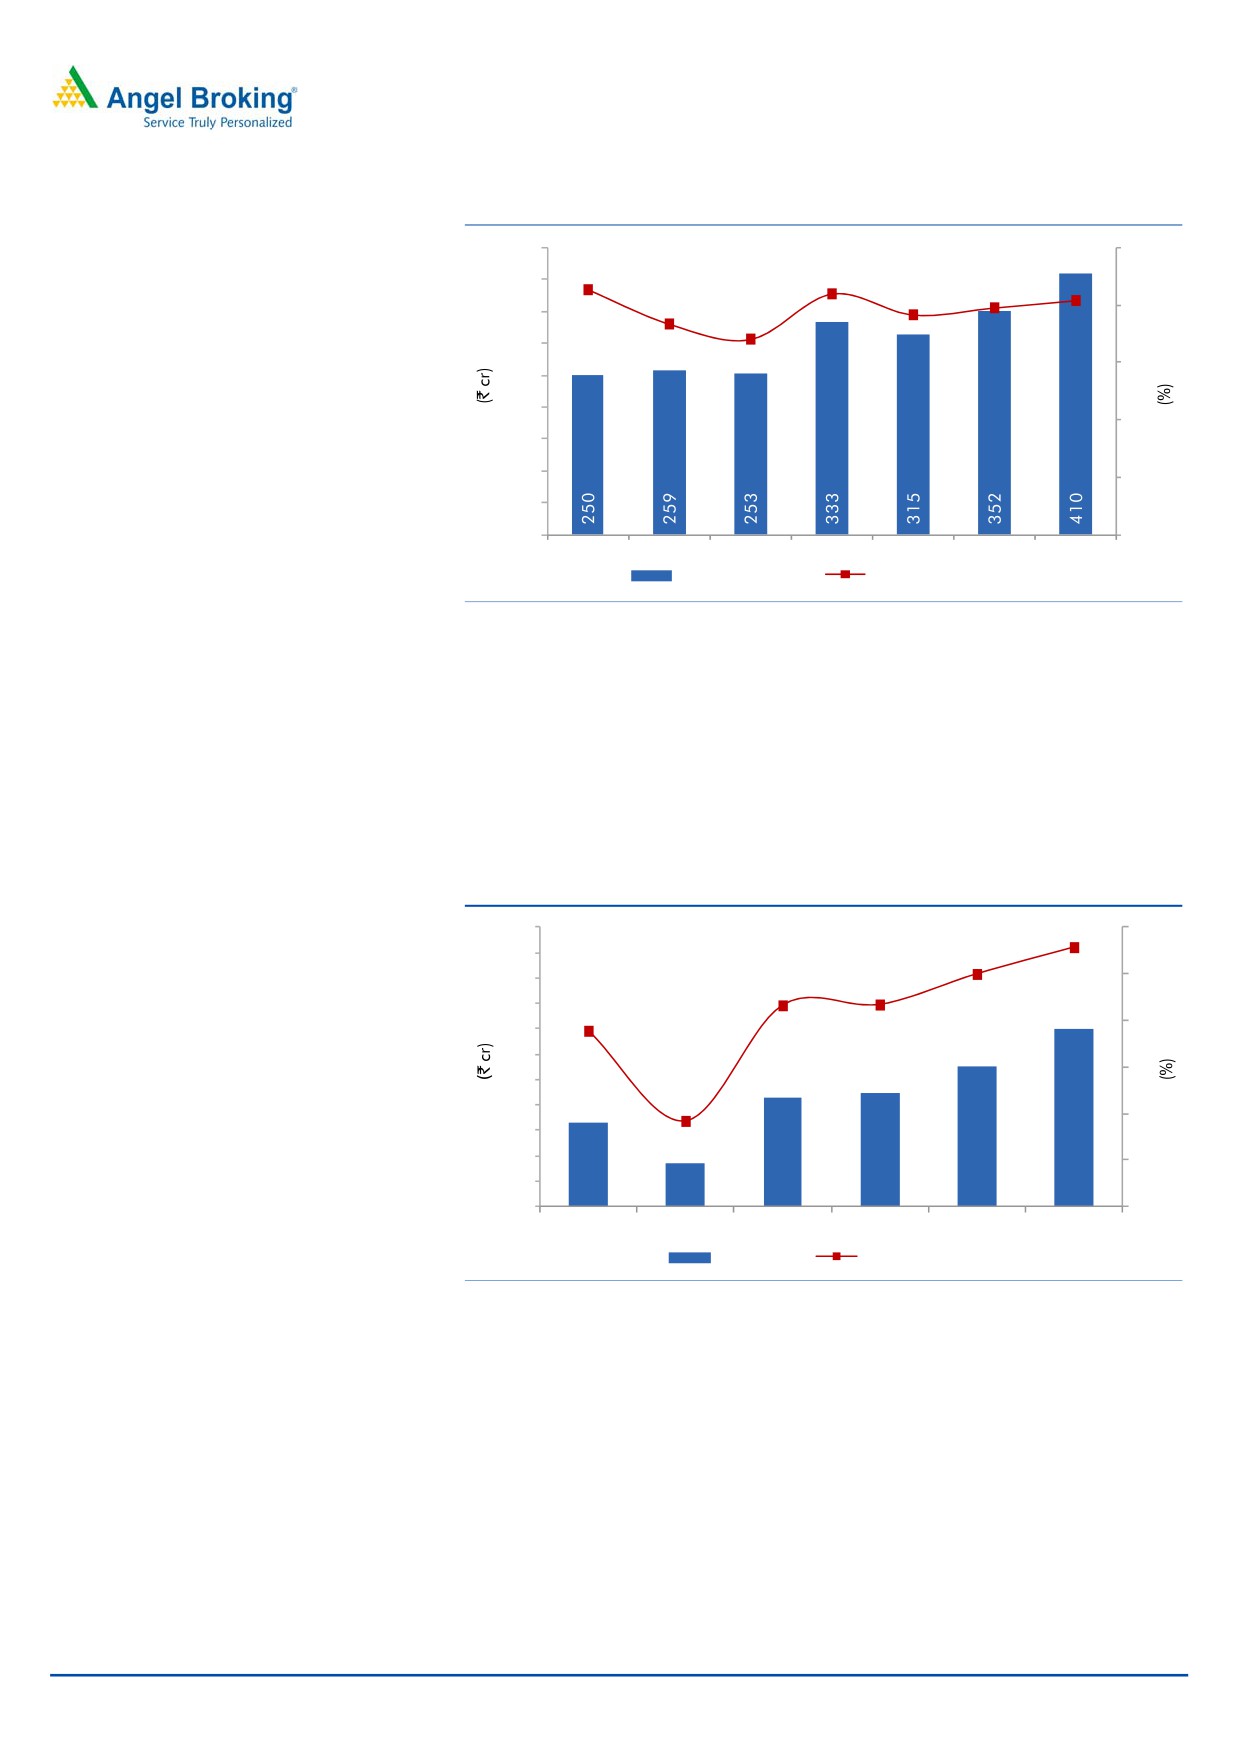
EBITDA to post CAGR of 14.1% over FY2016-18E
As the Management has incurred higher expenses in FY2016 towards
development of sales channel for the Consumer products business and
advertisement, coupled with losses in initial phase for the Consumer business, the
EBITDA margin has contracted by 146bp yoy to 15.3%. With the Consumer
division gaining traction, we expect the margins to improve from here on.
May 27, 2016
5
HSIL | 4QFY2016 Result Update
Exhibit 7: EBIDTA margin trend
450
20
16.3
17.1
16.8
400
15.3
15.8
14.7
16
350
13.6
300
12
250
200
8
150
100
4
50
0
0
FY2012
FY2013
FY2014
FY2015
FY2016
FY2017E FY2018E
EBITDA (LHS)
EBITDA margin (RHS)
Source: Company, Angel Research
Net profit to post a 25.4% CAGR over FY2016-18E
Depreciation expense is expected to increase FY2017E onwards as the Pipes
business capex will get capitalized in FY2017E. Also on account of higher losses in
the subsidiary, the consolidated tax rate is higher in FY2016. We expect the tax
rate to retract to 35% on the subsidiary trimming its losses. As a result, we expect
the bottom-line to post a CAGR 25.4% over FY2016-18E to `140cr.
Exhibit 8: Lower interest cost to lead PAT northwards
220
5.6
6
200
5.0
4.3
5
180
4.3
160
3.8
4
140
120
3
100
1.8
80
2
60
40
1
20
66
34
85
89
111
140
0
0
FY2013
FY2014
FY2015
FY2016
FY2017E FY2018E
PAT (LHS)
PAT margin (RHS)
Source: Company, Angel Research
May 27, 2016
6
HSIL | 4QFY2016 Result Update
Outlook and Valuation
We has revised downwards our estimates for FY2017 for both Building and
Packaging products segments but expect FY2018E to be better on account of
contribution from newer businesses as well as pick up in volumes. Further,
favorable pricing for the core Building products business should also aid the
company in delivering better numbers.
At the current market price, the stock trades at 15.0x its FY2018E earnings. We
have an Accumulate rating on the stock with a target price of `310.
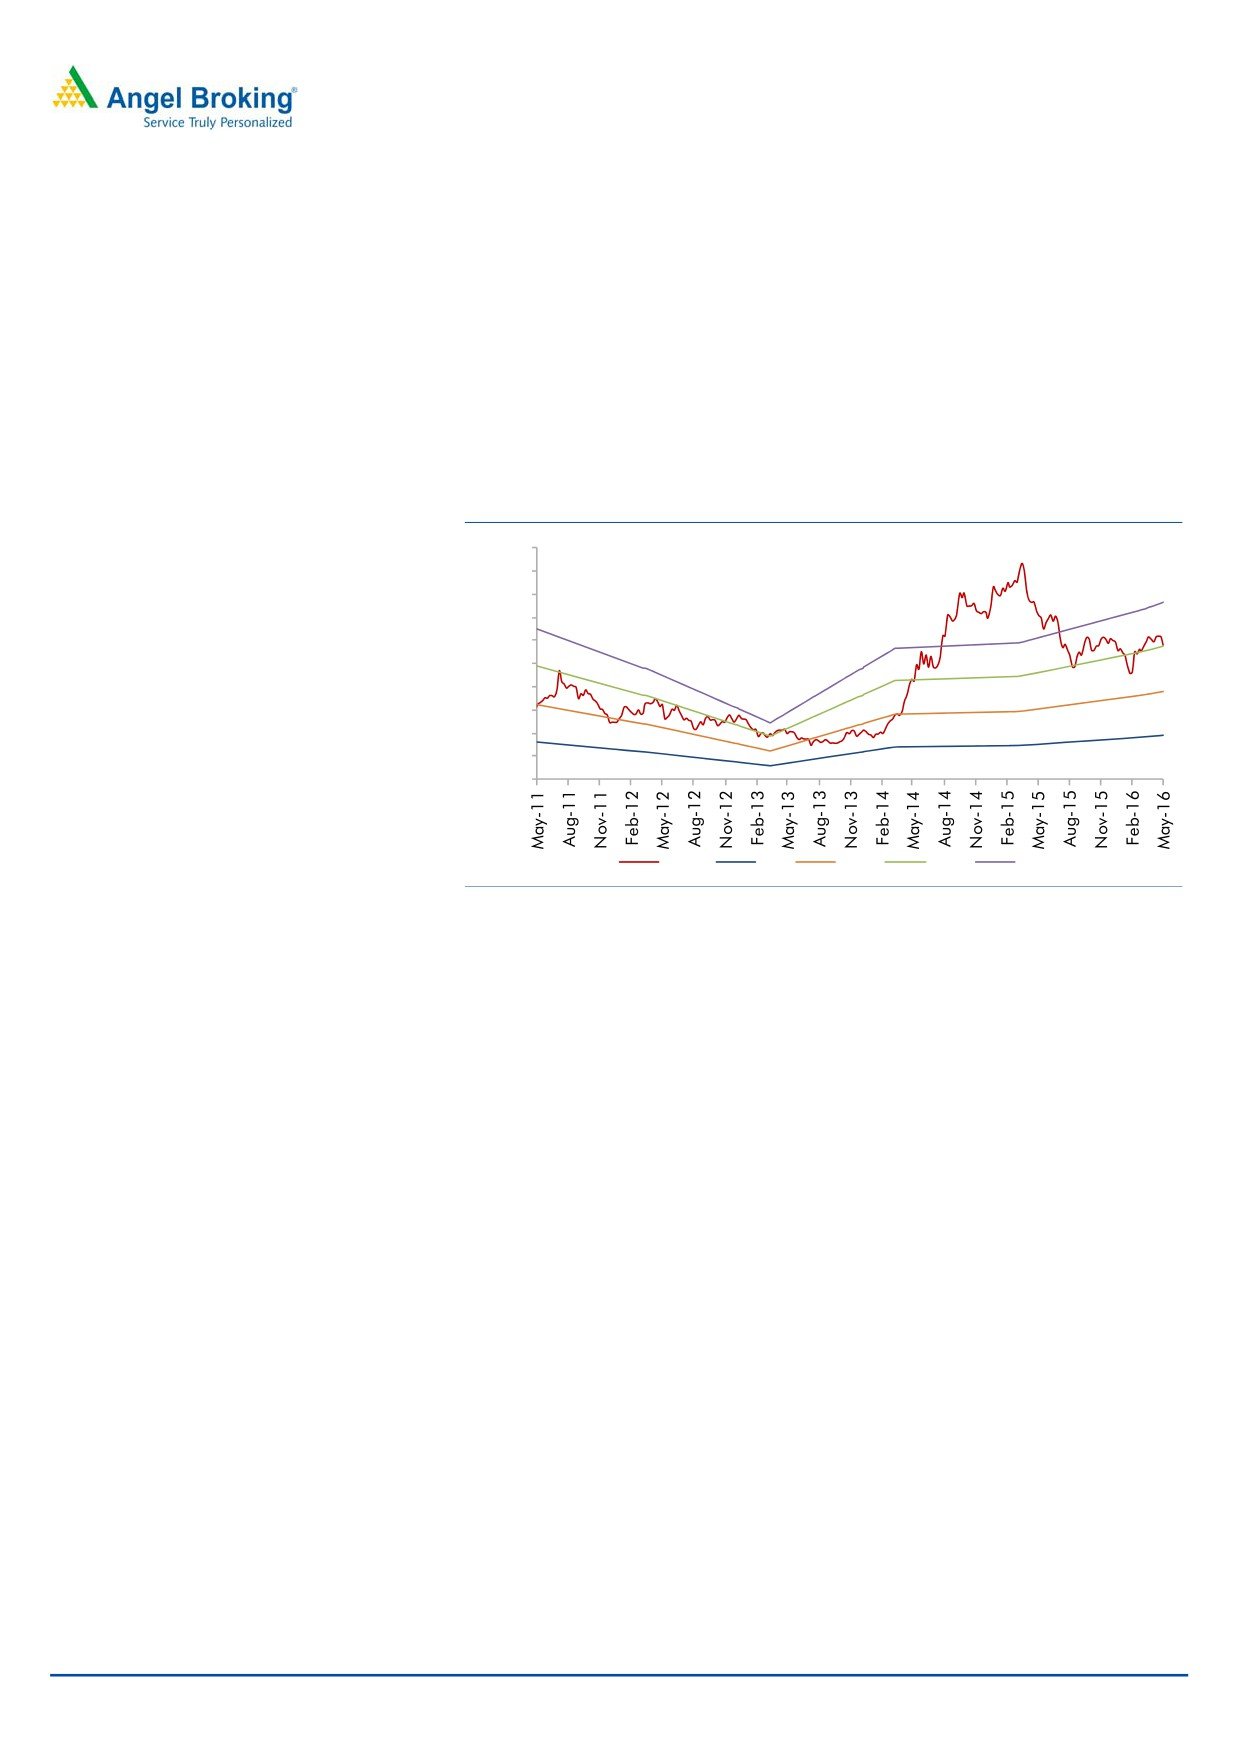
Exhibit 9: One-year forward PE band
500
450
400
350
300
250
200
150
100
50
-
Price
6x
12x
18x
24x
Source: Company, Angel Research,
Risk factors
Unorganized sanitaryware manufacturers pose a threat since they enjoy the
benefit of nil excise duty and sales tax. Hence, their products are ~70%
cheaper than the organized sector’s products. The increase in excise duty from
8% to 12% has made products from organized players more expensive.
Low-cost imports from China.
Any drastic change in government policy related to housing construction and
imports among others is bound to impact the industry.
Raw material cost- Any increase in the price of brass, the main raw material
for faucets, may dent the company’s EBITDA margin. Rise in the cost of raw
materials such as soda ash could dent operational margins.
Continued slowdown in the housing segment will cease growth, as in India the
major demand for sanitaryware is fresh demand.
External Commercial Borrowings (ECBs) formed a significant portion of total
borrowing of the company. Weakness in INR against the USD owing to global
macro economic slowdown and imminent interest rate hike in the US will
impact the performance of the company and work against our estimates.
May 27, 2016
7
HSIL | 4QFY2016 Result Update
Profit and Loss (Consolidated)
Y/E March (` cr)
FY2014
FY2015
FY2016
FY2017E
FY2018E
Total operating income
1,858
1,981
2,056
2,223
2,515
% chg
5.5
6.6
3.8
8.1
13.1
Net Raw Materials
648
732
763
829
922
% chg
19.3
13.0
4.3
8.7
11.3
Power and Fuel
377
280
231
253
289
% chg
(6.6)
(25.7)
(17.5)
9.6
14.1
Personnel
188
216
251
271
307
% chg
3.4
14.6
16.2
8.1
13.1
Other
392
421
496
518
586
% chg
4.8
7.3
18.0
4.4
13.1
Total Expenditure
1,605
1,648
1,741
1,871
2,104
EBITDA
253
333
315
352
410
% chg
(2.1)
31.3
(5.2)
11.6
16.8
(% of Net Sales)
13.6
16.8
15.3
15.8
16.3
Depreciation& Amortisation
110
125
120
127
145
EBIT
143
207
195
225
266
% chg
(13.5)
44.9
(6.0)
15.4
18.2
(% of Net Sales)
7.7
10.5
9.5
10.1
10.6
Interest & other Charges
72
78
41
49
56
Other Income
4
4
4
3
5
(% of Net Sales)
0.2
0.2
0.2
0.1
0.2
Recurring PBT
71
130
154
176
210
% chg
(25.7)
82.0
18.3
14.4
19.5
PBT (reported)
75
134
157
179
215
Tax
41
48
68
68
75
(% of PBT)
54.8
36.0
43.4
38.0
35.0
PAT (reported)
34
85
89
111
140
Extraordinary Expense/(Inc.)
0
0
0
0
0
ADJ. PAT
34
85
89
111
140
% chg
(48.8)
151.5
4.2
24.5
26.2
(% of Net Sales)
1.8
4.3
4.3
5.0
5.6
Basic EPS (`)
5.1
11.8
12.3
15.3
19.4
Fully Diluted EPS (`)
5.1
11.8
12.3
15.3
19.4
% chg
(48.8)
129.7
4.2
24.5
26.2
May 27, 2016
8
HSIL | 4QFY2016 Result Update
Balance Sheet (Consolidated)
Y/E March (` cr)
FY2014
FY2015
FY2016E
FY2017E
FY2018E
SOURCES OF FUNDS
Equity Share Capital
13
14
14
14
14
Reserves& Surplus
1,015
1,308
1,363
1,440
1,536
Shareholders’ Funds
1,028
1,323
1,378
1,454
1,551
Total Loans
1,133
786
627
756
767
Other Long Term Liabilities
15
18
20
20
20
Long Term Provisions
5
5
9
9
9
Deferred Tax (Net)
115
105
101
101
101
Total Liabilities
2,297
2,237
2,135
2,340
2,447
APPLICATION OF FUNDS
Gross Block
2,018
2,211
2,266
2,449
2,622
Less: Acc. Depreciation
537
654
774
901
1,045
Net Block
1,481
1,557
1,492
1,549
1,577
Capital Work-in-Progress
119
34
57
100
50
Goodwill
38
31
27
23
19
Investments
11
11
11
11
11
Long Term Loans and adv.
55
32
45
49
55
Other Non-current asset
2
1
0
1
1
Current Assets
968
965
950
1,045
1,225
Cash
60
25
20
33
89
Loans & Advances
42
50
49
53
59
Inventory
444
474
490
522
584
Debtors
419
414
390
435
492
Other current assets
2
2
2
2
2
Current liabilities
377
394
447
436
490
Net Current Assets
590
571
503
609
735
Misc. Exp. not written off
-
-
-
-
-
Total Assets
2,297
2,237
2,135
2,340
2,447
May 27, 2016
9
HSIL | 4QFY2016 Result Update
Cash flow statement (Consolidated)
Y/E March (` cr)
FY2014
FY2015
FY2016E FY2017E FY2018E
Profit before tax
75
134
157
179
215
Depreciation
110
125
120
127
145
Change in Working Capital
(52)
(16)
62
(92)
(71)
Direct taxes paid
(41)
(48)
(68)
(68)
(75)
Others
(4)
(4)
(4)
(3)
(5)
Cash Flow from Operations
88
191
268
142
208
(Inc.)/Dec. in Fixed Assets
(171)
(100)
(74)
(223)
(119)
(Inc.)/Dec. in Investments
(0)
(0)
0
-
-
(Incr)/Decr In LT loans & adv.
(1)
23
(12)
(4)
(6)
Others
4
4
4
3
5
Cash Flow from Investing
(169)
(73)
(82)
(223)
(120)
Issue of Equity
-
1
-
-
-
Inc./(Dec.) in loans
99
(345)
(151)
129
11
Dividend Paid (Incl. Tax)
(23)
(30)
(35)
(35)
(43)
Others
(17)
221
(5)
-
-
Cash Flow from Financing
59
(153)
(191)
95
(33)
Inc./(Dec.) in Cash
(22)
(35)
(5)
14
55
Opening Cash balances
82
60
25
20
33
Closing Cash balances
60
25
20
33
89
May 27, 2016
10
HSIL | 4QFY2016 Result Update
Key ratios (Consolidated)
Y/E March
FY2014
FY2015
FY2016E
FY2017E
FY2018E
Valuation Ratio (x)
P/E (on FDEPS)
61.7
24.5
23.5
18.9
15.0
P/CEPS
14.5
10.0
10.0
8.8
7.4
P/BV
2.0
1.6
1.5
1.4
1.4
EV/Net sales
1.7
1.4
1.3
1.3
1.1
EV/EBITDA
9.0
6.8
7.2
6.5
5.5
EV / Total Assets
1.4
1.3
1.3
1.2
1.1
Per Share Data (`)
EPS (Basic)
5.1
11.8
12.3
15.3
19.4
EPS (fully diluted)
5.1
11.8
12.3
15.3
19.4
Cash EPS
21.8
29.1
28.9
32.8
39.3
DPS
3.0
3.5
4.0
4.0
5.0
Book Value
155.7
183.0
190.6
201.1
214.5
DuPont Analysis
EBIT margin
7.7
10.5
9.5
10.1
10.6
Tax retention ratio
0.5
0.6
0.6
0.6
0.7
Asset turnover (x)
0.9
0.9
1.0
1.1
1.1
ROIC (Post-tax)
3.2
6.3
5.3
6.7
7.8
Cost of Debt (Post Tax)
3.0
5.2
3.3
4.4
4.8
Leverage (x)
1.0
0.6
0.4
0.5
0.4
Operating ROE
3.4
7.0
6.2
7.8
9.1
Returns (%)
ROCE (Pre-tax)
6.4
9.2
8.9
10.1
11.1
Angel ROIC (Pre-tax)
7.1
9.9
9.4
10.7
11.9
ROE
3.3
7.3
6.6
7.8
9.3
Turnover ratios (x)
Asset TO (Gross Block)
1.0
0.9
0.9
0.9
1.0
Inventory / Net sales (days)
84
85
86
83
80
Receivables (days)
79
77
71
71
71
Payables (days)
86
85
88
85
85
WC cycle (ex-cash) (days)
99
99
91
87
89
Solvency ratios (x)
Net debt to equity
1.0
0.6
0.4
0.5
0.4
Net debt to EBITDA
4.2
2.3
1.9
2.0
1.6
Int. Coverage (EBIT/ Int.)
2.0
2.7
4.7
4.6
4.8
May 27, 2016
11
HSIL | 4QFY2016 Result Update
Research Team Tel: 022 - 39357800
DISCLAIMER
Angel Broking Private Limited (hereinafter referred to as “Angel”) is a registered Member of National Stock Exchange of India Limited,
Bombay Stock Exchange Limited and Metropolitian Stock Exchange of India Limited. It is also registered as a Depository Participant
with CDSL and Portfolio Manager with SEBI. It also has registration with AMFI as a Mutual Fund Distributor. Angel Broking Private
Limited is a registered entity with SEBI for Research Analyst in terms of SEBI (Research Analyst) Regulations, 2014 vide registration
number INH000000164. Angel or its associates has not been debarred/ suspended by SEBI or any other regulatory authority for
accessing /dealing in securities Market. Angel or its associates including its relatives/analyst do not hold any financial
interest/beneficial ownership of more than 1% in the company covered by Analyst. Angel or its associates/analyst has not received any
compensation / managed or co-managed public offering of securities of the company covered by Analyst during the past twelve
months. Angel/analyst has not served as an officer, director or employee of company covered by Analyst and has not been engaged in
market making activity of the company covered by Analyst.
This document is solely for the personal information of the recipient, and must not be singularly used as the basis of any investment
decision. Nothing in this document should be construed as investment or financial advice. Each recipient of this document should
make such investigations as they deem necessary to arrive at an independent evaluation of an investment in the securities of the
companies referred to in this document (including the merits and risks involved), and should consult their own advisors to determine
the merits and risks of such an investment.
Reports based on technical and derivative analysis center on studying charts of a stock's price movement, outstanding positions and
trading volume, as opposed to focusing on a company's fundamentals and, as such, may not match with a report on a company's
fundamentals.
The information in this document has been printed on the basis of publicly available information, internal data and other reliable
sources believed to be true, but we do not represent that it is accurate or complete and it should not be relied on as such, as this
document is for general guidance only. Angel Broking Pvt. Limited or any of its affiliates/ group companies shall not be in any way
responsible for any loss or damage that may arise to any person from any inadvertent error in the information contained in this report.
Angel Broking Pvt. Limited has not independently verified all the information contained within this document. Accordingly, we cannot
testify, nor make any representation or warranty, express or implied, to the accuracy, contents or data contained within this document.
While Angel Broking Pvt. Limited endeavors to update on a reasonable basis the information discussed in this material, there may be
regulatory, compliance, or other reasons that prevent us from doing so.
This document is being supplied to you solely for your information, and its contents, information or data may not be reproduced,
redistributed or passed on, directly or indirectly.
Neither Angel Broking Pvt. Limited, nor its directors, employees or affiliates shall be liable for any loss or damage that may arise from
or in connection with the use of this information.
Note: Please refer to the important ‘Stock Holding Disclosure' report on the Angel website (Research Section). Also, please refer to the
latest update on respective stocks for the disclosure status in respect of those stocks. Angel Broking Pvt. Limited and its affiliates may
have investment positions in the stocks recommended in this report.
Disclosure of Interest Statement
HSIL
1. Analyst ownership of the stock
No
2. Angel and its Group companies ownership of the stock
No
3. Angel and its Group companies' Directors ownership of the stock
No
4. Broking relationship with company covered
No
Note: We have not considered any Exposure below ` 1 lakh for Angel, its Group companies and Directors
Ratings (Based on expected returns
Buy (> 15%)
Accumulate (5% to 15%)
Neutral (-5 to 5%)
over 12 months investment period):
Reduce (-5% to -15%)
Sell (< -15)
May 27, 2016
12