IPO Note | Capital Goods
September 20, 2016
HPL Electric & Power Limited
NEUTRAL
Issue Open: September 22, 2016
IPO Note - Weak on profitability, low on ROE
Issue Close: September 26, 2016
HPL Electric & Power Private Limited (HPL) is a New Delhi based company
Issue Details
engaged in manufacturing of energy meters, switchgears, lighting equipments
and wires and cables. Company operates seven manufacturing facilities located
Face Value: `10
in Haryana and Himachal Pradesh. HPL has pan-India presence and its
Present Eq. Paid up Capital: `46.4cr
distribution network includes
2,400 authorized dealers/distributors, selling
Fresh Issue: `2.06*- 1.78cr**
products to 15,000 retailers. As per its FY16 numbers, Metering contributes 47%
Offer for sale:-NA
of the total revenues whereas switchgears (15%), Lighting equipment (24%) and
Post Eq. Paid up Capital: `64.3cr
Wires and cables (14%) form the rest of the business mix. B2C sales represent
44% of the total sales and B2B sales represent remaining 56% sales.
Market Lot: 70 Shares
Major business has seen slower growth in last three years: HPL’s three business
Issue (amount): `361cr
segments (Meters, Switchgears and wires and cables) contribute 3/4th of the total
Price Band: `175-202
revenues. In the last three years revenues from these segments have remained
Post-issue implied mkt. cap `1,174cr*-
1,299cr**
flat. Company holds meaningful market share in Meters and Switchgears, despite
Note:*at Lower price band and **Upper price band
which it has not been able to generate higher revenues. Its fourth segment
Lighting has been a consistent performer due to its exposure to LED lamps
however it has low contribution in revenues.
Book Building
High working capital requirements: HPL has high working capital requirements
QIBs
50%
than its peers. Company derives bulk of its revenues from the debt ridden power
Non-Institutional
15%
utilities which is the cause of the problem. Over last few years, working capital
Retail
35%
have deteriorated with working capital cycle stretching from 140 days in FY13 to
160 days in FY16. Company is hopeful of ease in the working capital once Ujwal
Post Issue Shareholding Pattern(%)
DISCOM Assurance Yojana (UDAY) is fully implemented. We remain uncertain
over the time line of ease in its working capital.
Promoters Group
72.1
Public
27.9
Lower ROE than peers: HPL has been a low ROE business compared to its peers.
Higher working capital cycle, increased depreciation due to increased capacity
and high debt has impacted its profitability and ROE. Company will have to
significantly improve operating performance in near future to maintain current
ROE levels. With the further equity dilution, we don’t see significant jump in the
ROE profile.
Existing litigation against HPL by Havells India: Two of promoter companies of
HPL use name Havells in their name. HPL and Havells India Limited have been
engaged in the litigation over the use of name ‘Havell’s’ in the corporate name.
HPL has clarified that its promoters and promoter group companies are not
associated with Havells India limited in any manner.
Outlook & Valuation: On the valuation front, at the upper end of the price band,
the pre-issue P/E works out to 25.6x of its FY2016 earnings which is lower
compared to its peers. However this discount is justified considering its
significantly low ROE, stretched working capital and low profitability compared to
Shrikant Akolkar
its peers. Considering past financial performance and poor visibility on future
+91 22 4000 3600 Ext: 6846
growth, we rate this issue as NEUTRAL.
Please refer to important disclosures at the end of this report
1
HPL Electric & Power | IPO Note
Key Financial
Y/E March (` cr)
FY2012
FY2013
FY2014
FY2015
FY2016
Net Sales
724
916
1,016
1,052
1,121
% chg
-
26.4
11.0
3.5
6.6
Net Profit
28
31
28
35
37
% chg
-
10.7
(9.7)
22.0
5.8
OPM (%)
10.9
11.3
9.5
10.8
11.3
EPS (`)
6.3
6.8
6.1
7.5
7.9
P/E (x)
32.0
29.7
33.1
27.1
25.6
P/BV (x)
3.8
3.3
3.0
2.9
2.6
RoE (%)
11.8
11.1
9.2
10.9
10.3
RoCE (%)
13.5
15.8
13.0
13.5
13.3
EV/Sales (x)
1.7
1.4
1.3
1.4
1.4
EV/EBITDA (x)
14.6
11.1
12.2
10.9
10.6
Source: Company, Angel Research; Note: Valuation ratios based on pre-issue outstanding shares
and at upper end of the price band
Company background
HPL Electric & Power Private Limited (HPL) is a New Delhi based company engaged
in manufacturing of energy meters, switchgears, lighting equipments and wires
and cables. It was founded as HPL-Socomec Private Limited in 1991 as a joint
venture between Socomec and Havells Electronics Private Limited (now Havells
India limited). The current promoter and promoter group holds 99.92% shares of
the company. In 2010, its name was changed to HPL Electric & Power Private
Limited.
Company operates seven manufacturing facilities located in Haryana and
Himachal. HPL has pan-India presence and its distribution network includes 2,400
authorized dealers or distributors selling products to 15,000 retailers. In addition,
company supplies products to Power Utilities, which primarily includes supply of
meters to electricity boards and power distribution companies. HPL also sells its
products to developers of residential and commercial building projects, original
equipment manufacturers and to industrial customers through a mix of direct sales
and through authorized dealer network. It also has two in-house research and
development centers in Haryana.
As per its FY16 numbers, meters contribute 47% of the total revenues whereas
switchgears (15%), Lighting equipment (24%) and Wires and cables (14%) form the
rest of the business mix. B2C sales represent 44% of the total sales and B2B sales
represent remaining 56% sales.
September 20, 2016
2
HPL Electric & Power | IPO Note
Issue details
The company is raising `361cr through fresh issue (1.78cr share) of equity shares
in the price band of `175-202. The fresh issue will constitute ~28% of the post-
issue paid-up equity share capital of the company assuming the issue is subscribed
at the upper end of the price band.
Exhibit 1: Shareholding pattern
Particulars
Pre-Issue
Post-Issue
No. of shares
(%)
No. of shares
(%)
Promoter group
46,391,699
99.9%
46,391,699
72.1%
Others
37,500
0.1%
17,908,787
27.9%
Total
46,429,199
100.0%
64,300,486
100.0%
Source: Company, Angel Research
Objects of the offer
~`130cr will be used for repayment/prepayment of certain indebtedness
~`180cr will be used for funding working capital requirements
The balance will be used for general corporate purposes.
September 20, 2016
3
HPL Electric & Power | IPO Note
Investment rationale
Major business has seen slower growth in last three years
Majority of HPL’s business has grown at slower rate in last three years. More than
half of its business comes from Meters and Switchgears segment (62% of gross
sales in FY16). Both the segments have witnessed weak revenue growth in the last
three years. Despite the company having ~20% market share in Electricity Energy
Meters, it has witnessed low CAGR of 5% in Meters revenue between FY14-FY16.
The Smart Cities Mission project announced by the central government is expected
to be the fortune changer for Meters market; however that is only expected after
2022 when the civil work for the smart cities will be near the completion and hence
we do not expect any immediate impact on this industry.
The switchgears segment, has witnessed CAGR of -11.3% in the gross revenues
between FY14-FY16. In the switchgears segment, company competes with the
bigger companies such as L&T, Schneider Electric ABB Limited, Havells Industries
Limited, etc. While company claims to have 5% market share in this segment,
strong decline in revenues from switchgears suggest that company is facing huge
competition or the market is not growing fast enough to accommodate all players.
Company claims that it’s Wires and cables business segment is a 100% B2C
business but it has a very low operating margin profile (4.4% EBIT margins in
FY16). This business has remained flat in the last three years growing from
`169.3cr in FY14 to `173.5cr in FY16. Overall nearly 3/4th of HPL’s business has
seen slow growth for last three years affecting its operating performance.
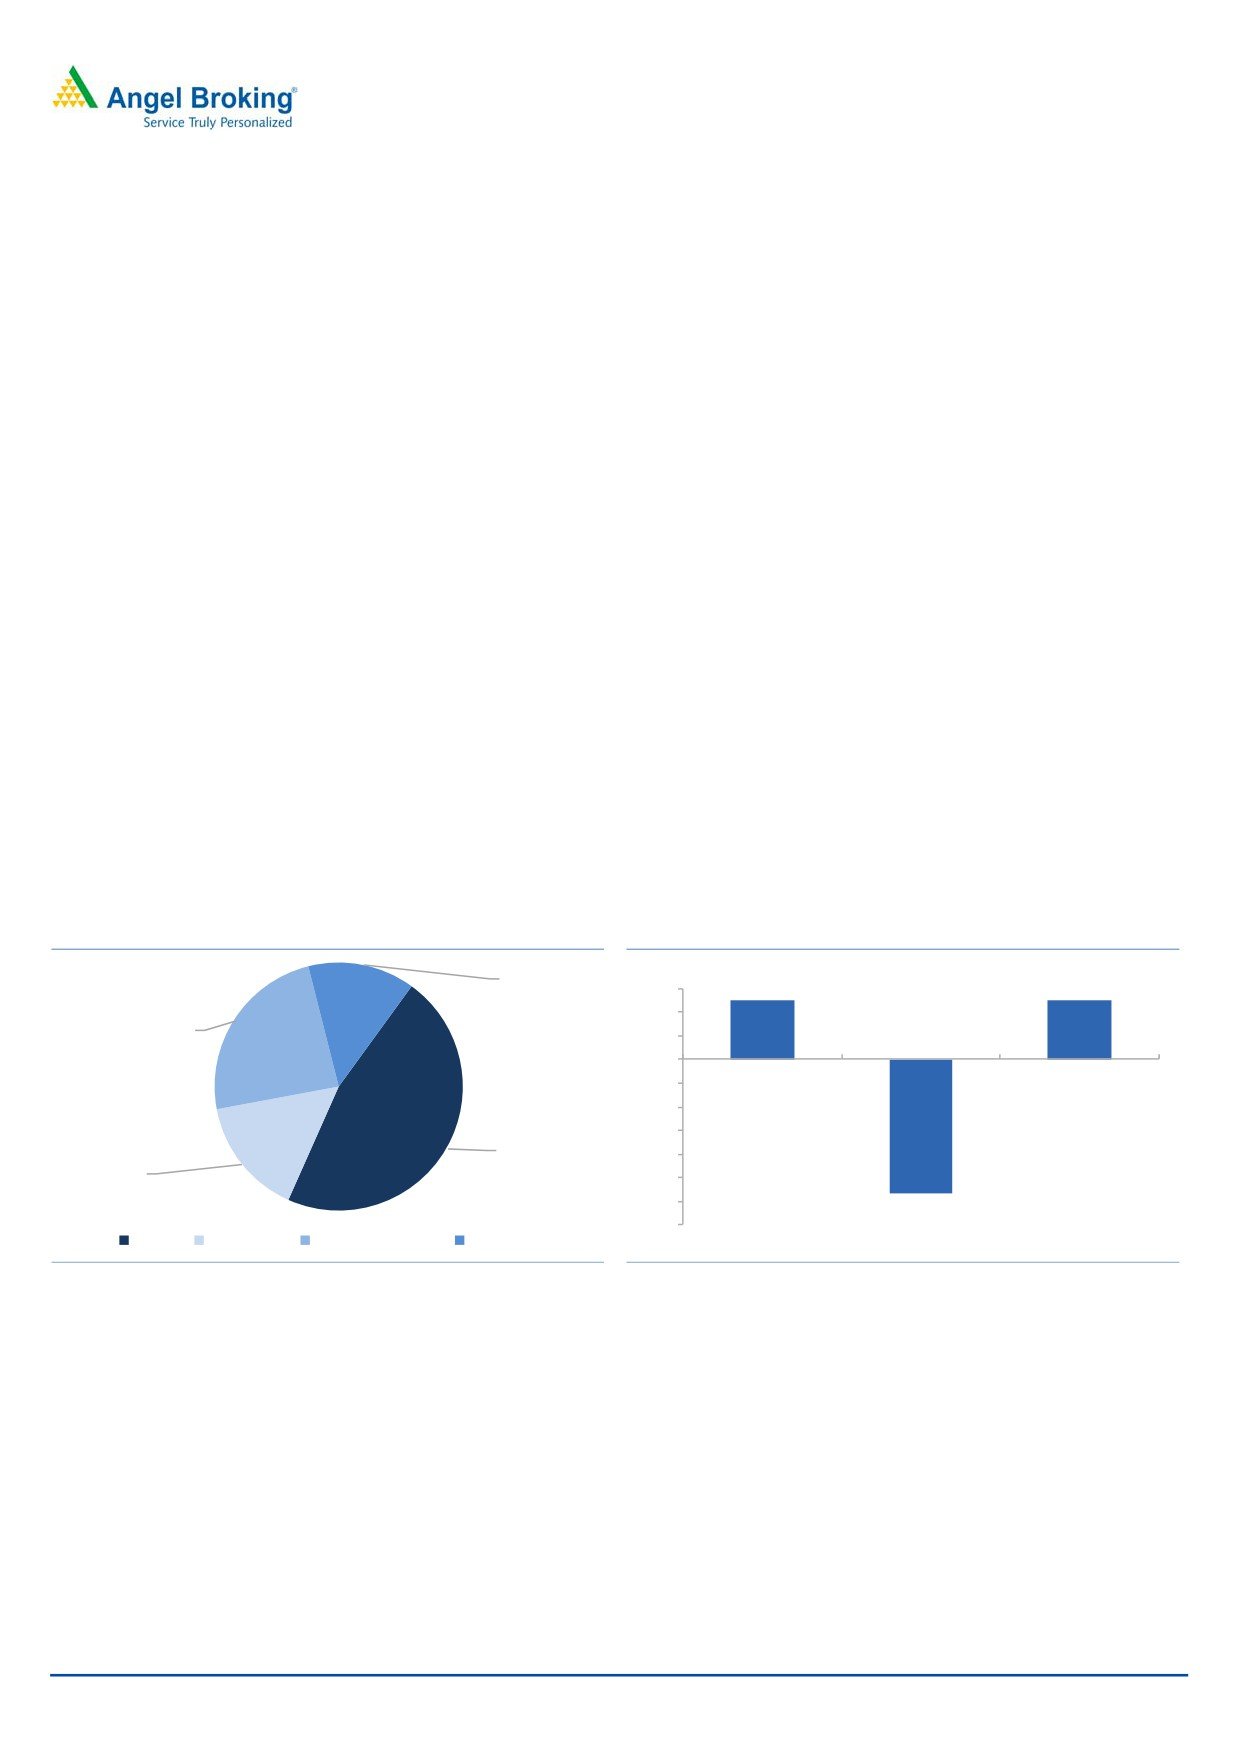
Exhibit 2: HPL’s revenue mix
Exhibit 3: Performance of major business FY2014-16
(%)
14%
5
6
5
4
24%
2
0
(2)
(4)
(6)
47%
(8)
15%
(10)
(12)
(11)
(14)
Meters
Switchgears
Lighting equipment
Wires and cables
Meters
Switchgears
Wires and cables
Source: Company, Angel Research
Source: Company, Angel Research
Lighting segment at bright spot
HPL’s Lighting segment contributed 24% of its revenues in FY16 and has seen a
CAGR of 29.3% between FY14-FY16. This is the only segment of HPL which has
been consistent in growth. HPL manufactures wide range of LED lamps (including
down-lighters), luminaires and CFLs. Strong growth drivers for LED specially has
been main reason that HPL’s lighting segment has been witnessing strong growth.
Indian LED lighting market is further expected to grow at a CAGR of 62% between
2016 and 2020. HPL holds 5% market share in LED lamps and hence we remain
positive over the growth of this segment. This positive impact however would be
offset by its lower revenue contribution in overall revenue mix.
September 20, 2016
4
HPL Electric & Power | IPO Note
High working capital requirements
HPL’s working capital cycle is a certainly an issue considering it takes more than
150 days to convert working capital in actual revenues. Working capital turnover
which stood at 2.8x in FY11 deteriorated to 2.1x in FY16 indicating high working
capital requirement. Receivables have seen a sharp increase as sizable proportion
of its revenues (45% in FY16) comes from debt ridden power utilities which have
been plagued by poor operating performances for several years. HPL believes that
Ujwal DISCOM Assurance Yojana (UDAY), announced by central government in
November-2015, is expected to ease it’s the working capital conditions. The UDAY
scheme is in early stages of implementation and earlier reforms in the power
sector have not been highly successful to improve the performance of state
electricity boards. Nearly half portion of the IPOL proceeds is allocated to fund the
working capital so company has understood its pain area however there is no
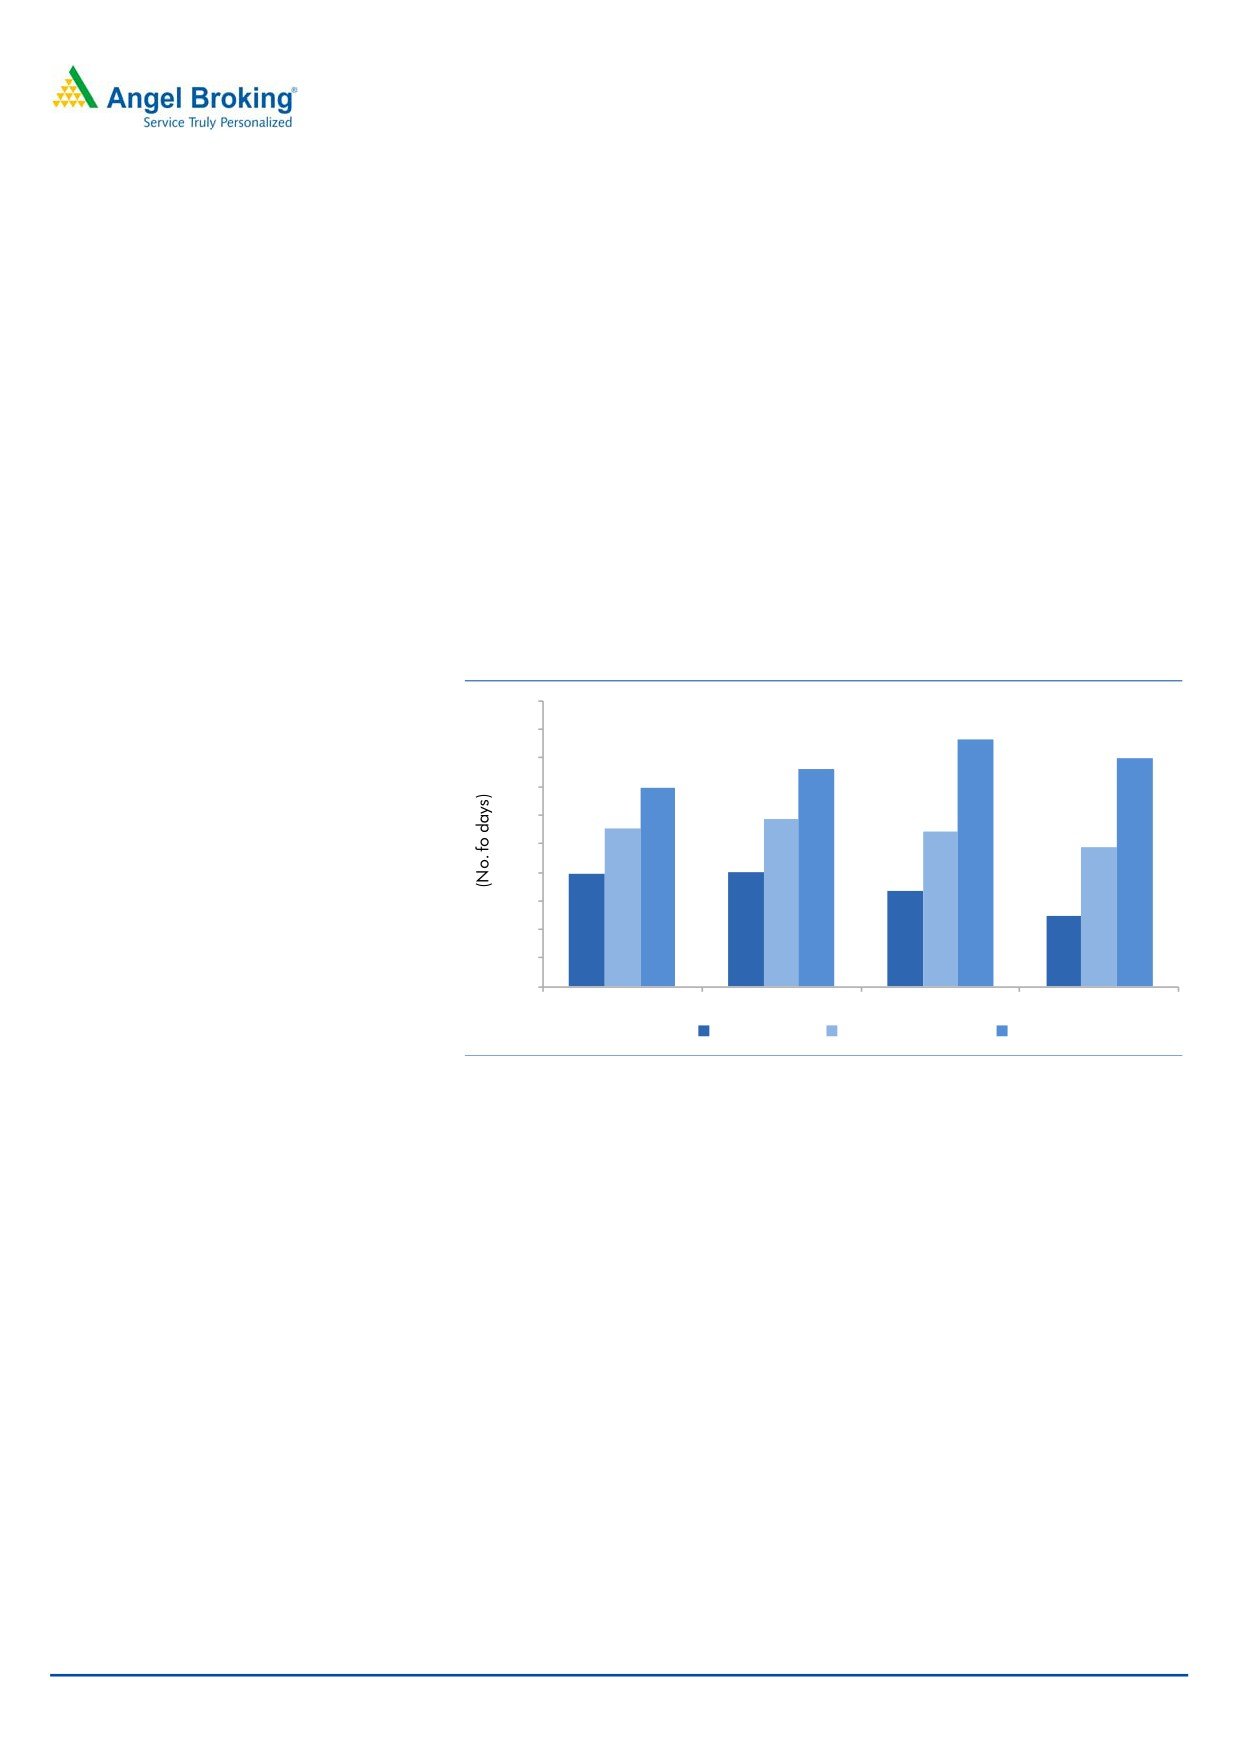
timeline when HPL will see ease in working capital.
Exhibit 4: Higher working capital cycle than peers
200
173
180
160
152
160
140
140
118
111
109
120
98
100
79
80
80
67
60
49
40
20
0
FY2013
FY2014
FY2015
FY2016
Havells India
V-Guard Industries
HPL
Source: Company, Angel Research
Lower ROE than peers
HPL has been a low ROE business for many years which is due to its weak working
capital, high debt and rise in depreciation due to the recent capacity additions.
HPL’s ROE of 17% in FY11 has been declining and stood 10.3% in FY16. During
this period, HPL’s debt has increased 2.73x from ` 220cr to ` 601cr. Its interest
cost has also remained at elevated levers which has reduced its net profit margins
from 6.6% in FY11 to 3.3% in FY16 despite having EBITDA margins between 12%
to 13%.
The company has lower ROE compared to its peers such as Havells India (23%), V-
Guard Industries (23%), Finolex Cables (19%), etc. The company is expected to
repay `130cr of the IPO proceeds which will help it to improve the net margins;
however the 28% dilution is also expected to offset this impact and hence leaving
the ROE unchanged.
September 20, 2016
5
HPL Electric & Power | IPO Note
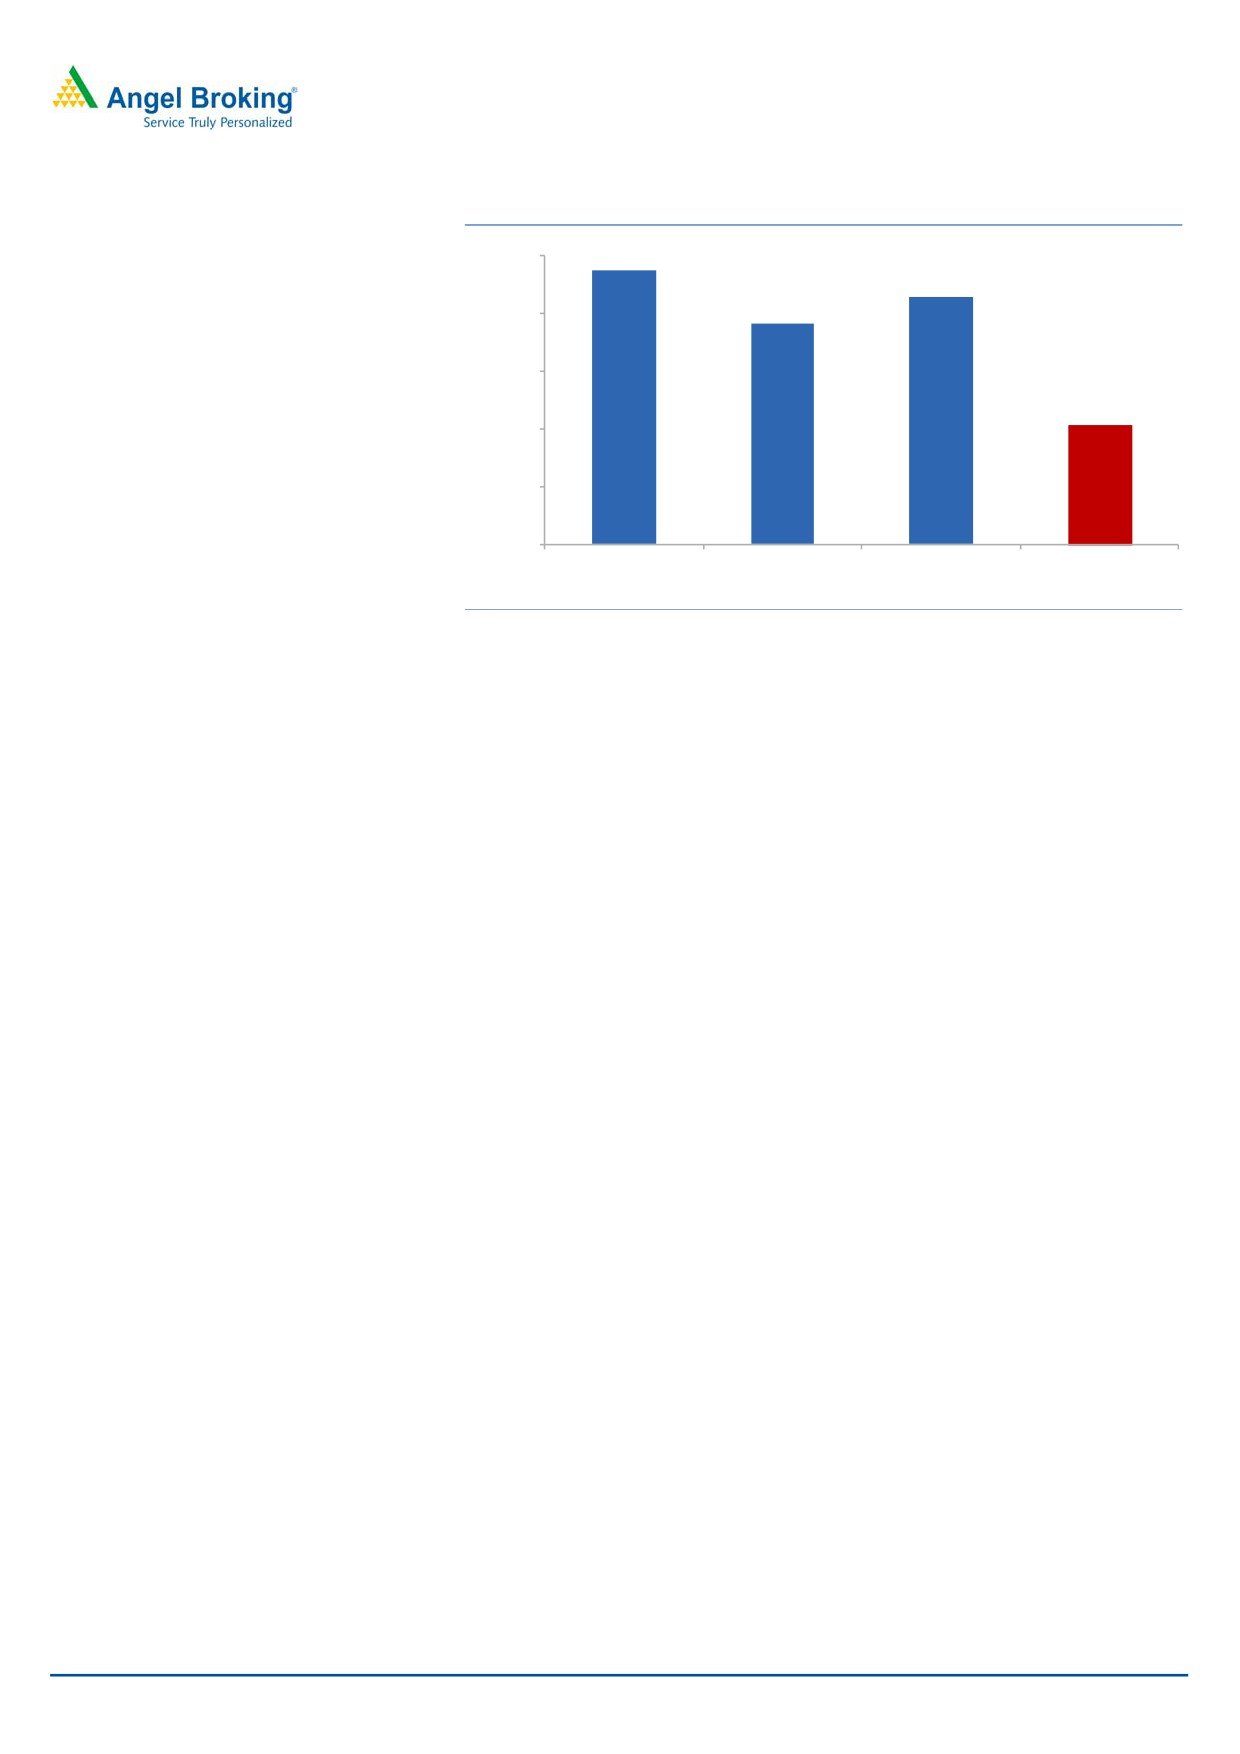
Exhibit 5: HPL has lower ROE compared to peers
23.7%
25.0%
21.4%
19.1%
20.0%
15.0%
10.3%
10.0%
5.0%
0.0%
V-Guard Industries
Finolex cables
Havells India
HPL
Consolidated
Source: Company, Angel Research
Existing litigation against HPL by Havells India
Among the promoters of HPL are two companies named Havell’s Private Limited
and Havells Electronics Private Limited. This is highly confusing due the similarity of
the name ‘Havells’ with Havells India Limited (HIL), which is a much larger
company listed on the bourses and also in the business of electrical consumer
durables. Due to this, HIL and Q.R.G. Enterprises have filed a litigation against
HPL refraining it from using word ‘Havell’s’ in its corporate name. HPL has
disclosed in the RHP that HPL and its promoters are not associated with Havells
India limited in any manner and they are two different companies.
September 20, 2016
6
HPL Electric & Power | IPO Note
Outlook and Valuation
On the valuation front, at the upper end of the price band, the pre-issue P/E works
out to 25.6x of its FY2016 earnings which is lower compared to its peers. However
this discount is justified considering its low ROE, high working capital conditions
and low profitability compared to its peers. Considering past financial
performance and poor visibility on future growth, we rate this issue as NEUTRAL.
Exhibit 6: Comparative Valuation
FY2016
P/E
P/BV
ROE EV/Sales
EV/EBITDA
Pre issue valuation^
(x)
(x)
(%)
(x)
(x)
HPL Electric & Power Ltd.
25.6
2.6
10.3
1.3
9.8
Havells India Ltd.
42.6
9.7
24.4
4.2
21.1
V-Guard Industries
49.2
11.7
23.7
3.0
27.5
Finolex Cables
21.2
4.0
19.1
2.3
12.0
KEC International
16.2
2.0
12.6
0.6
8.1
Source: RHP, Note: ^based on price at upper band & pre-market cap
Upside risks
Strong traction in Lighting business: Strong growth in lighting business may alter
the business mix significantly which could lead to better operating performance.
Decline in working capital: Success UDAY could lead to ease in HPL’s working
capital which could improve its financial performance.
September 20, 2016
7
HPL Electric & Power | IPO Note
Profit & Loss Statement
Y/E March (` cr)
FY2011
FY2012
FY2013
FY2014
FY2015
FY2016
Total operating income
568
724
916
1,016
1,052
1,121
% chg
27.6
26.4
11.0
3.5
6.6
Total Expenditure
494
638
801
906
922
975
Raw Material Consumed
387
503
647
720
715
741
Personnel Expenses
34
48
54
58
68
107
Others Expenses
73
88
100
128
139
127
EBITDA
73
86
115
110
130
146
% chg
17.1
33.5
(4.0)
18.0
12.2
(% of Net Sales)
12.9
11.9
12.5
10.8
12.4
13.0
Depreciation& Amortisation
5
7
11
13
16
19
EBIT
68
79
103
97
114
127
% chg
16.0
30.5
(6.3)
17.5
11.2
(% of Net Sales)
12.0
10.9
11.3
9.5
10.8
11.3
Interest & other Charges
21
41
62
59
70
78
Recurring PBT
47
38
42
38
44
48
% chg
(19.7)
9.8
(9.7)
16.7
10.1
Extraordinary Expense/(Inc.)
-
-
-
-
-
-
PBT (reported)
47
38
42
38
44
48
Tax
10
10
10
9
9
12
(% of PBT)
21.3
25.2
24.7
24.7
21.2
24.3
PAT before MI
37
28
31
28
35
37
Minority Interest (after tax)
-
-
-
-
-
-
Profit/Loss of Associate Co.
-
-
-
-
-
-
PAT after MI(reported)
37
28
31
28
35
37
Exceptional Items
-
-
-
-
-
-
Reported PAT
37
28
31
28
35
37
% chg
(23.8)
10.7
(9.7)
22.0
5.8
(% of Net Sales)
6.6
3.9
3.4
2.8
3.3
3.3
Basic EPS (`)
8.0
6.1
6.8
6.1
7.5
7.9
Fully Diluted EPS (`)
8.0
6.1
6.8
6.1
7.5
7.9
% chg
(23.8)
10.7
(9.7)
22.0
5.8
September 20, 2016
8
HPL Electric & Power | IPO Note
Balance Sheet
Y/E March (` cr)
FY2011
FY2012
FY2013
FY2014
FY2015
FY2016
SOURCES OF FUNDS
Equity Share Capital
18
18
19
19
19
46
Reserves& Surplus
195
223
263
291
300
308
Shareholders Funds
213
241
282
310
318
354
Minority Interest
-
-
-
-
-
-
Total Loans
220
347
374
433
526
601
Other long term liabilities
6
8
16
17
18
14
Long-term provisions
1
1
1
1
2
3
Deferred Tax Liability
7
11
13
16
19
24
Total Liabilities
447
609
687
778
881
996
APPLICATION OF FUNDS
Gross Block
145
199
249
326
372
419
Less: Acc. Depreciation
18
25
36
49
65
84
Net Block
127
175
213
277
307
335
Intangible assets
-
-
0
-
-
-
Capital Work in Progress
72
66
53
29
-
3
Investments
15
15
15
15
15
54
Current Assets
351
511
627
663
819
948
Inventories
138
211
264
260
308
317
Sundry Debtors
144
217
269
328
401
512
Cash
30
47
52
46
54
52
Loans & Advances
38
35
41
27
54
65
Other Assets
0
1
1
1
1
2
Current liabilities
119
160
222
208
261
353
Net Current Assets
231
352
405
455
558
595
Long term loans and advances
1
1
1
1
1
9
Total Assets
447
609
687
778
881
996
September 20, 2016
9
HPL Electric & Power | IPO Note
Cash Flow Statement
Y/E March (` cr)
FY2011
FY2012
FY2013
FY2014
FY2015
FY2016
Profit before tax
47
38
42
38
44
48
Depreciation
5
7
11
13
16
19
Change in Working Capital
23
(91)
(39)
(53)
(89)
(31)
Interest / Dividend (Net)
20
38
58
55
66
74
Direct taxes paid
(10)
(8)
(9)
(7)
(11)
(8)
Cash Flow from Operations
85
(16)
63
46
27
103
(Inc.)/ Dec. in Fixed Assets
(78)
(48)
(37)
(54)
(43)
(50)
(Inc.)/ Dec. in Investments
1
3
4
4
4
(42)
Cash Flow from Investing
(77)
(45)
(33)
(49)
(39)
(92)
Issue of Equity
6.0
-
9.6
-
-
-
Inc./(Dec.) in loans
16.8
123.1
28.1
57.1
90.3
64.6
Dividend Paid (Incl. Tax)
(2.1)
(3.1)
(0.4)
(0.2)
(0.2)
(0.2)
Interest / Dividend (Net)
(21.0)
(41.3)
(61.7)
(59.3)
(69.9)
(78.2)
Cash Flow from Financing
(0)
79
(24)
(2)
20
(14)
Inc./(Dec.) in Cash
8
17
5
(6)
8
(3)
Opening Cash balances
22
30
47
52
46
54
Closing Cash balances
30
47
52
46
54
52
September 20, 2016
10
HPL Electric & Power | IPO Note
Key Ratio
Y/E March
FY2011
FY2012
FY2013
FY2014
FY2015
FY2016
Valuation Ratio (x)
P/E (on FDEPS)
25.2
33.0
29.9
33.1
27.1
25.6
P/CEPS
22.1
26.7
21.9
22.5
18.5
16.8
P/BV
4.4
3.9
3.3
3.0
2.9
2.6
Dividend yield (%)
0.2
0.3
0.0
0.0
0.0
0.0
EV/Sales
2.0
1.7
1.4
1.3
1.3
1.3
EV/EBITDA
15.2
14.2
10.8
11.9
10.7
9.8
EV / Total Assets
2.0
1.6
1.4
1.3
1.2
1.1
Per Share Data (`)
EPS (Basic)
8.0
6.1
6.8
6.1
7.5
7.9
EPS (fully diluted)
8.0
6.1
6.8
6.1
7.5
7.9
Cash EPS
9.1
7.6
9.2
9.0
10.9
12.1
DPS
0.4
0.6
0.1
0.0
0.0
0.0
Book Value
45.9
51.9
60.7
66.8
68.5
76.3
Returns (%)
ROCE
15.8
13.5
15.8
13.0
13.5
13.3
Angel ROIC (Pre-tax)
21.6
17.2
19.3
14.9
14.7
15.0
ROE
17.5
11.8
11.1
9.2
10.9
10.3
Turnover ratios (x)
Asset Turnover (Gross Block)
3.9
3.6
3.7
3.1
2.8
2.7
Inventory / Sales (days)
130
153
149
132
157
156
Receivables (days)
93
110
108
118
140
168
Payables (days)
97
107
117
98
125
164
WC cycle (ex-cash) (days)
127
156
140
152
173
160
Solvency ratios (x)
Net debt to equity
0.8
1.2
1.1
1.2
1.4
1.4
Net debt to EBITDA
2.4
3.3
2.7
3.4
3.5
3.4
Int. Coverage (EBIT / Int.)
3.3
1.9
1.7
1.6
1.6
1.6
September 20, 2016
11
HPL Electric & Power | IPO Note
Research Team Tel: 022 - 39357800
DISCLAIMER
Angel Broking Private Limited (hereinafter referred to as “Angel”) is a registered Member of National Stock Exchange of India Limited,
Bombay Stock Exchange Limited and Metropolitan Stock Exchange Limited. It is also registered as a Depository Participant with CDSL
and Portfolio Manager with SEBI. It also has registration with AMFI as a Mutual Fund Distributor. Angel Broking Private Limited is a
registered entity with SEBI for Research Analyst in terms of SEBI (Research Analyst) Regulations, 2014 vide registration number
INH000000164. Angel or its associates has not been debarred/ suspended by SEBI or any other regulatory authority for accessing
/dealing in securities Market. Angel or its associates/analyst has not received any compensation / managed or co-managed public
offering of securities of the company covered by Analyst during the past twelve months.
This document is solely for the personal information of the recipient, and must not be singularly used as the basis of any investment
decision. Nothing in this document should be construed as investment or financial advice. Each recipient of this document should
make such investigations as they deem necessary to arrive at an independent evaluation of an investment in the securities of the
companies referred to in this document (including the merits and risks involved), and should consult their own advisors to determine
the merits and risks of such an investment.
Reports based on technical and derivative analysis center on studying charts of a stock's price movement, outstanding positions and
trading volume, as opposed to focusing on a company's fundamentals and, as such, may not match with a report on a company's
fundamentals. Investors are advised to refer the Fundamental and Technical Research Reports available on our website to evaluate the
contrary view, if any.
The information in this document has been printed on the basis of publicly available information, internal data and other reliable
sources believed to be true, but we do not represent that it is accurate or complete and it should not be relied on as such, as this
document is for general guidance only. Angel Broking Pvt. Limited or any of its affiliates/ group companies shall not be in any way
responsible for any loss or damage that may arise to any person from any inadvertent error in the information contained in this report.
Angel Broking Pvt. Limited has not independently verified all the information contained within this document. Accordingly, we cannot
testify, nor make any representation or warranty, express or implied, to the accuracy, contents or data contained within this document.
While Angel Broking Pvt. Limited endeavors to update on a reasonable basis the information discussed in this material, there may be
regulatory, compliance, or other reasons that prevent us from doing so.
This document is being supplied to you solely for your information, and its contents, information or data may not be reproduced,
redistributed or passed on, directly or indirectly.
Neither Angel Broking Pvt. Limited, nor its directors, employees or affiliates shall be liable for any loss or damage that may arise from
or in connection with the use of this information.
September 20, 2016
12