2QFY2016 Result Update | HFC
October 27, 2015
HDFC
NEUTRAL
CMP
`1,275
Performance Highlights
Target Price
-
Particulars (` cr)
2QFY16 1QFY16
% chg (qoq) 2QFY15
% chg (yoy)
Investment Period
-
NII
2,076
2,116
(1.9)
1,955
6.2
Pre-prov. profit
2,376
2,002
18.7
2,017
17.8
Stock Info
PAT
1,605
1,361
17.9
1,358
18.2
Source: Company, Angel Research
Sector
HFC
For 2QFY2016, HDFC posted an 18.2% yoy increase in PAT, which is broadly in-
Market Cap (` cr)
2,01,178
line with our expectation. The NII for the quarter grew 6.2% yoy, which is slightly
Beta
1.4
below our expectation due to moderate growth in advances.
52 Week High / Low
1,399/1,030
Loan book growth moderate; Asset quality fairly stable
Avg. Daily Volume
29,42,025
For 2QFY2016, HDFC’s loan book grew by 12.1% yoy, with loans to the
Face Value (`)
2
individual segment growing by 23% yoy (after adding back loans sold in the
BSE Sensex
27,253
preceding 12 months) whereas the corresponding growth in the reported loan
Nifty
8,233
book was of 14.0% yoy, which is below our expectation. This is due to greater
Reuters Code
HDFC.BO
amount of loans having been sold to HDFC Bank in recent quarters. During the
quarter, incremental growth in the loan book came through growth in individual
Bloomberg Code
HDFC@IN
loans, which now constitute almost 69.7% of the total loans portfolio as compared
to 68.6% in 2QFY2015.
Shareholding Pattern (%)
The spread stood largely stable at 2.32% as compared to 2.29% in September
Promoters
0.0
2014, while the NIM contracted to 3.95% from a slightly higher 4% in September
MF / Banks / Indian Fls
78.2
2014, despite spreads widening. In declining rate environment, as HDFC has
FII / NRIs / OCBs
9.9
large Net Worth, even with constant spreads, NIM’s would have a slightly
Indian Public / Others
12.0
downward bias. Overall, we expect the loan book to grow at a CAGR of 15.0%
over FY2015-17E, while the NII growth at a CAGR of 11.6% over the same period.
Abs. (%)
3m 1yr
3yr
The company continued to keep its asset quality under check, with gross non-
Sensex
(1.1)
1.9
46.2
performing assets as a % of total loans rising marginally by 2bp to 0.71% (vs
0.69% in 1QFY2016). The company continues to maintain a 100% Provision
HDFC
(4.5)
23.1
68.6
Coverage Ratio.
3-year price chart
Outlook and valuation: HDFC continues to post moderate set of numbers despite
1,600
sluggish economic environment. Overall, we expect HDFC to post a healthy PAT
1,400
CAGR of 15.3% over FY2015-17E. The stock has surged significantly from the
1,200
lows witnessed in the month of August 2015. Currently, HDFC’s core business
1,000
800
(after adjusting `482/share towards the value of its subsidiaries) trades at 4.5x
600
FY2017E ABV, which in our view, offers limited scope for upside from here on.
400
Hence, we maintain our Neutral rating on the stock.
Key financials (standalone)
Y/E March (` cr)
FY2014
FY2015
FY2016E
FY2017E
Source: Company, Angel Research
NII*
6,666
7,631
8,341
9,502
% chg
12.5
14.5
9.3
13.9
Net profit
5,440
5,990
6,466
7,407
% chg
12.2
10.1
8.0
14.5
Vaibhav Agrawal
NIM (%)
3.4
3.4
3.3
3.3
022 - 3935 7800 Ext: 6808
EPS (`)
34.9
38.0
41.1
47.0
P/E (x)
37.7
34.5
32.0
27.9
P/ABV (x)
7.3
6.7
6.1
5.5
Chintan Shah
RoA (%)
2.5
2.4
2.3
2.3
022 - 4000 3600 Ext: 6828
RoE (%)
20.5
20.3
19.9
20.8
Source: Company, Angel Research; Note: * Core NII; CMP as of October 27, 2015.
Please refer to important disclosures at the end of this report
1
HDFC | 2QFY2016 Result Update
Exhibit 1: Quarterly performance (standalone)
Particulars (` cr)
2QFY16
1QFY16
% chg (qoq)
2QFY15
% chg (yoy)
FY2015
FY2014
% chg
Income from operations
6,994
6,980
0.2
6,428
8.8
26,272
23,338
12.6
Interest expensed
4,918
4,863
1.1
4,474
9.9
17,975
16,029
12.1
NII
2,076
2,116
(1.9)
1,955
6.2
8,297
7,309
13.5
Non-interest income
487
89
448.8
242
100.9
1,199
859
39.6
Operating income
2,563
2,205
16.2
2,197
16.7
9,496
8,168
16.3
Operating expenses
187
203
(7.7)
180
3.8
707
628
12.5
Pre-prov. profit
2,376
2,002
18.7
2,017
17.8
8,789
7,540
16.6
Provisions & cont.
52
50
4.0
35
48.6
165
100
65.0
PBT
2,324
1,952
19.0
1,982
17.3
8,624
7,440
15.9
Prov. for taxes
719
591
21.7
624
15.2
2,634
2,000
31.7
PAT
1,605
1,361
17.9
1,358
18.2
5,990
5,440
10.1
EPS (`)
10.2
8.6
17.7
8.7
17.5
38.0
34.9
9.1
Cost-to-income ratio (%)
7.3
9.2
(190)bp
8.2
(90)bp
7.4
7.7
-
Effective tax rate (%)
30.9
30.3
31.5
30.5
26.9
Source: Company, Angel Research
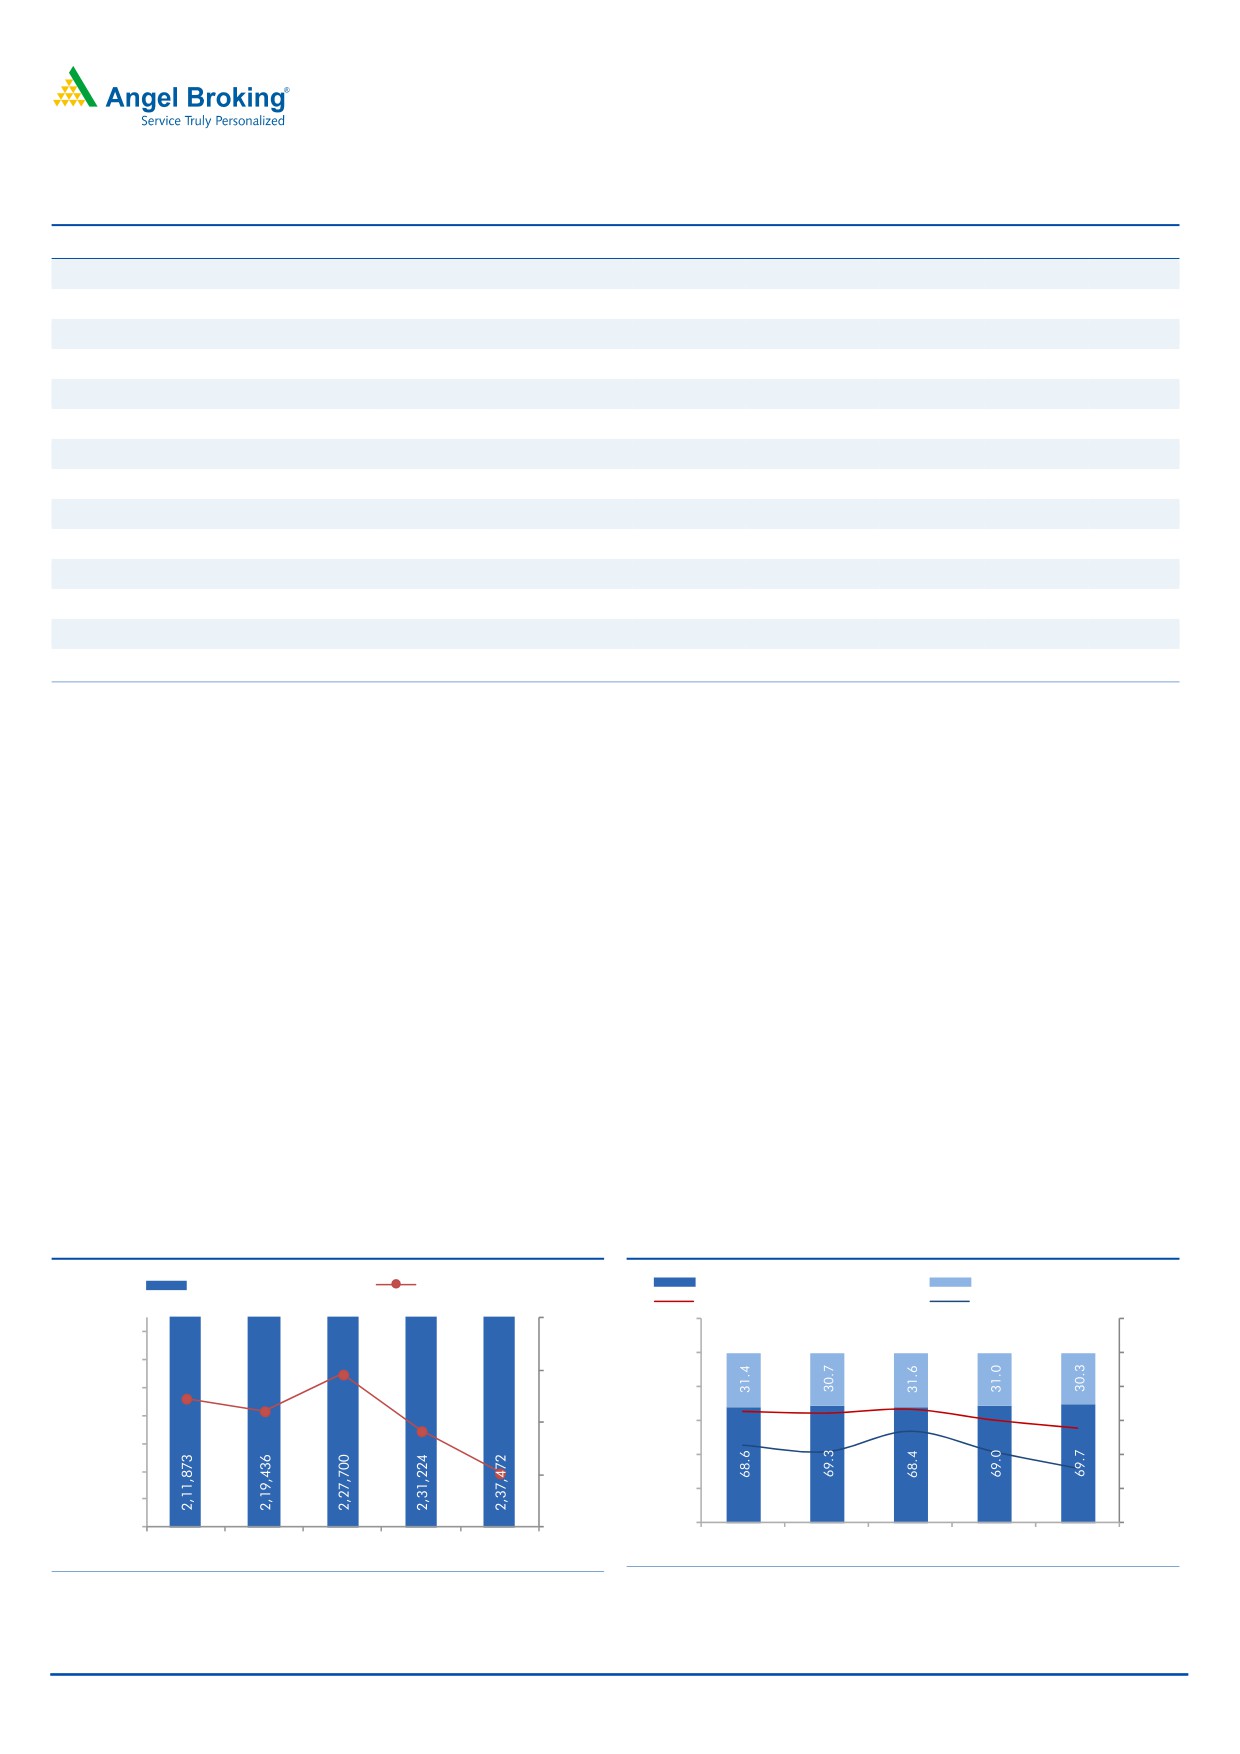
Moderate growth in retail loan book; corporate growth subdued
For 2QFY2016, HDFC’s loan book grew by 12.1% yoy, with loans to the individual
segment growing by 23% yoy (after adding back loans sold in the preceding
12 months) whereas the corresponding growth in the reported loan book was of
14.0% yoy, which is below our expectation. This is due to greater amount of loans
having been sold to HDFC Bank in recent quarters. Until the previous quarters,
55% of loans sourced by HDFC Bank for HDFC were bought back by HDFC Bank.
However, from this quarter onwards, they have started buying back 70% of its
loans thereby having a significant impact on the individual loan growth of HDFC.
The individual loan book has been consistently outpacing the corporate book over
the past few quarters. During the quarter, incremental growth in the loan book
came through growth in individual loans which now constitute almost 69.7% of the
total loans portfolio as compared to 68.6% in 2QFY2015. We expect individual
loan growth to be subdued for FY2016 as well as single-digit corporate book
growth.
Exhibit 2: Loan book grows at a moderate pace
Exhibit 3: Individual loans grew at 14.0% yoy
Advances (`cr)
Growth (yoy, %)
Ind. loans as % to Total
Non Ind. loans as % to Total
Ind. Loan growth (%) -RHS
Non Ind. loan growth (%) -RHS
18.0
120.0
30.0
1,90,000
15.8
100.0
25.0
1,70,000
14.9
16.0
1,50,000
14.4
80.0
20.0
13.7
1,30,000
14.0
60.0
15.0
1,10,000
12.1
40.0
10.0
90,000
12.0
20.0
5.0
70,000
50,000
10.0
-
-
2QFY15
3QFY15
4QFY15
1QFY16
2QFY16
2QFY15
3QFY15
4QFY15
1QFY16
2QFY16
Source: Company, Angel Research
Source: Company, Angel Research
October 27, 2015
2
HDFC | 2QFY2016 Result Update
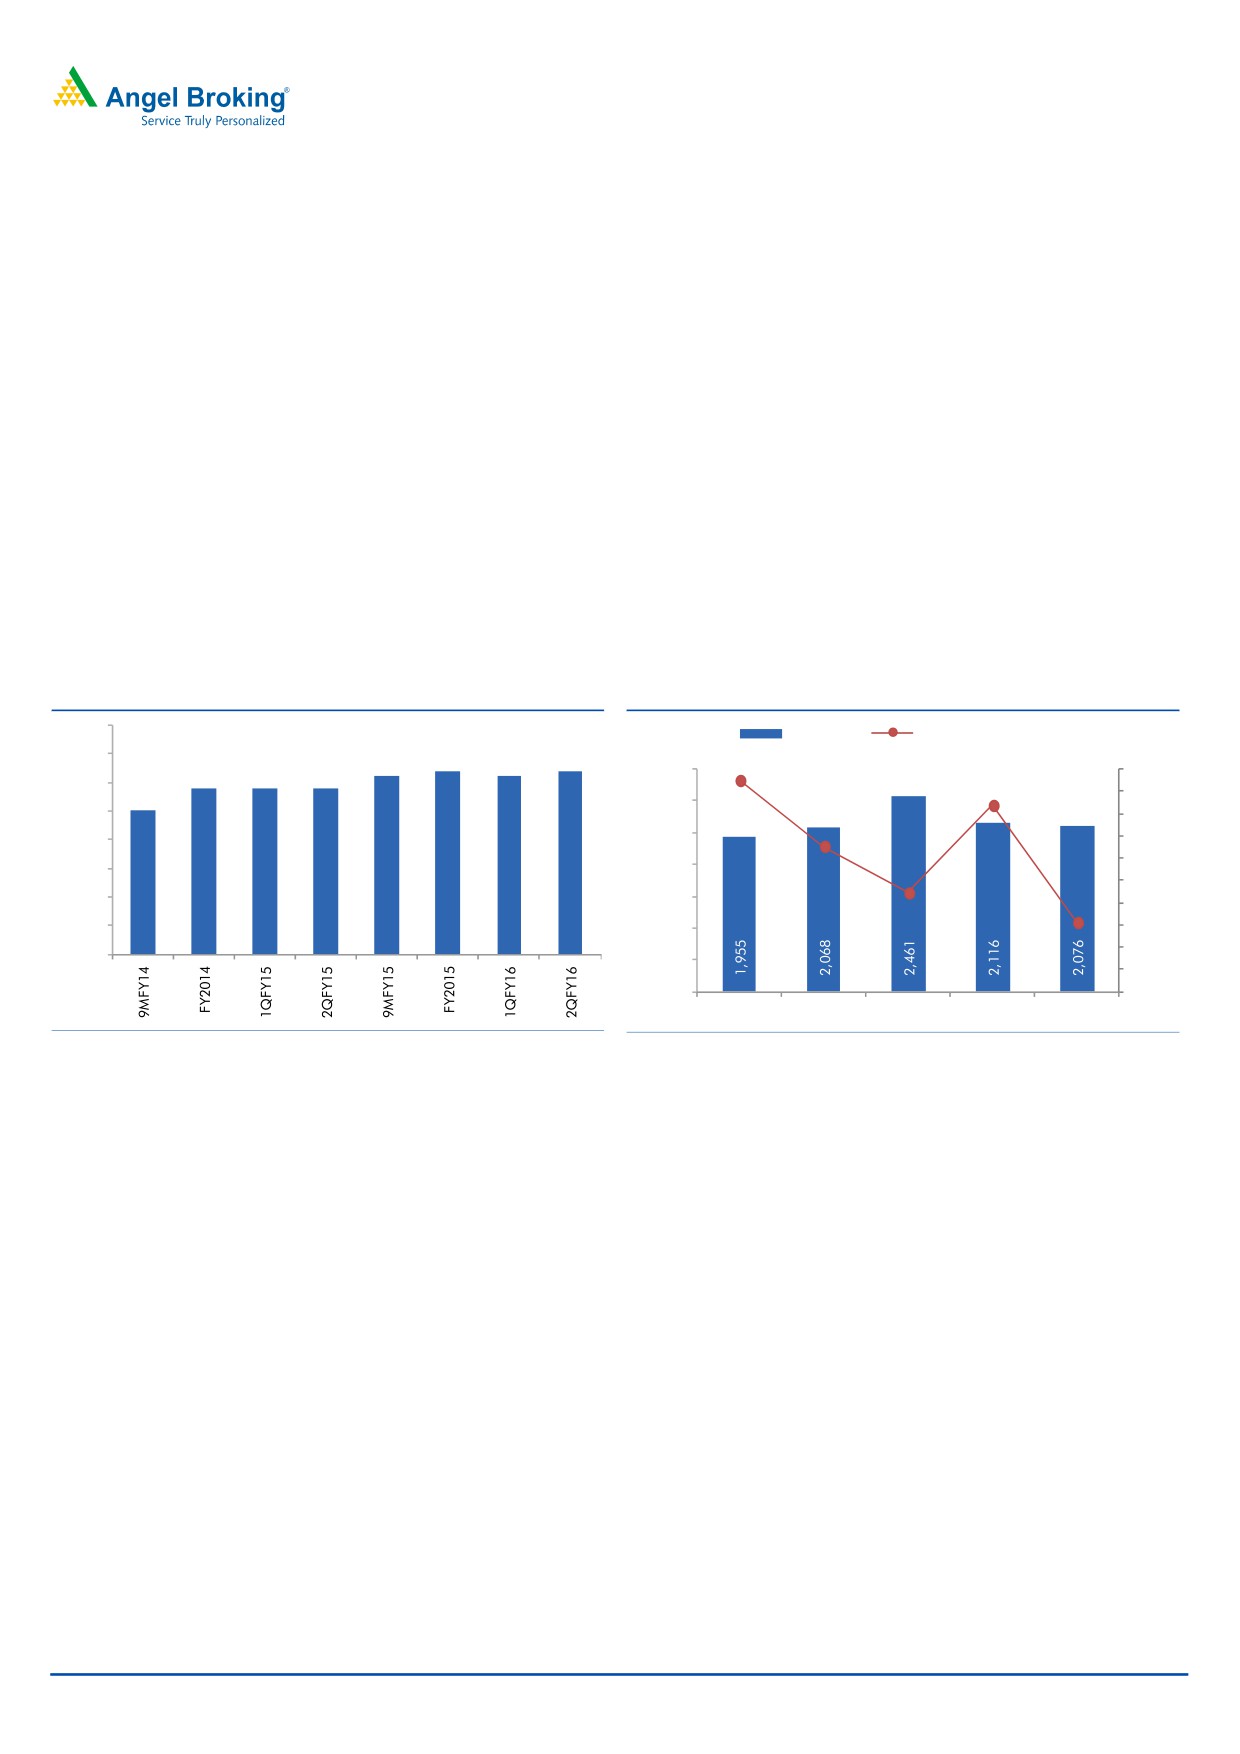
NII growth weakens
The spread stood largely stable at 2.32% as compared to 2.29% in September
2014, while the NIM contracted to 3.95% from a slightly higher 4% in September
2014, despite spreads widening. In declining rate environment, as HDFC has
large Net Worth, even with constant spreads, NIM’s would have a slightly
downward bias. Overall, we expect the loan book to grow at a CAGR of 15.0%
over FY2015-17E, while the NII growth at a moderate CAGR of 11.6% over the
same period.
Dividend received from HDFC Bank boosted other income
Non-interest income for the company came in at INR 486.6cr as compared to INR
242.2cr in 2QFY2015. The increase is attributed to the dividend income from
HDFC Bank, which in FY 2015 was received in first quarter, whereas in FY 2016, it
has been received in this quarter. PBT level earnings, adjusted for dividends and
sale of investments grew by 4.3% yoy which was below expectations.
Exhibit 4: Spreads strong at 2.32% for 2QFY2016
Exhibit 5: NII growth weakens
2.40
(%)
NII (`cr)
Growth yoy (%, RHS)
2.35
2.32
2.32
19.0
2.31
2.31
2.29
2.29
2.29
2,800
20.0
2.30
2.25
16.7
18.0
2,400
2.25
16.0
2,000
13.1
14.0
2.20
12.0
2.15
1,600
8.9
10.0
2.10
1,200
6.2
8.0
2.05
800
6.0
4.0
2.00
400
2.0
-
-
2QFY15
3QFY15
4QFY15
1QFY16
2QFY16
Source: Company, Angel Research
Source: Company, Angel Research
October 27, 2015
3
HDFC | 2QFY2016 Result Update
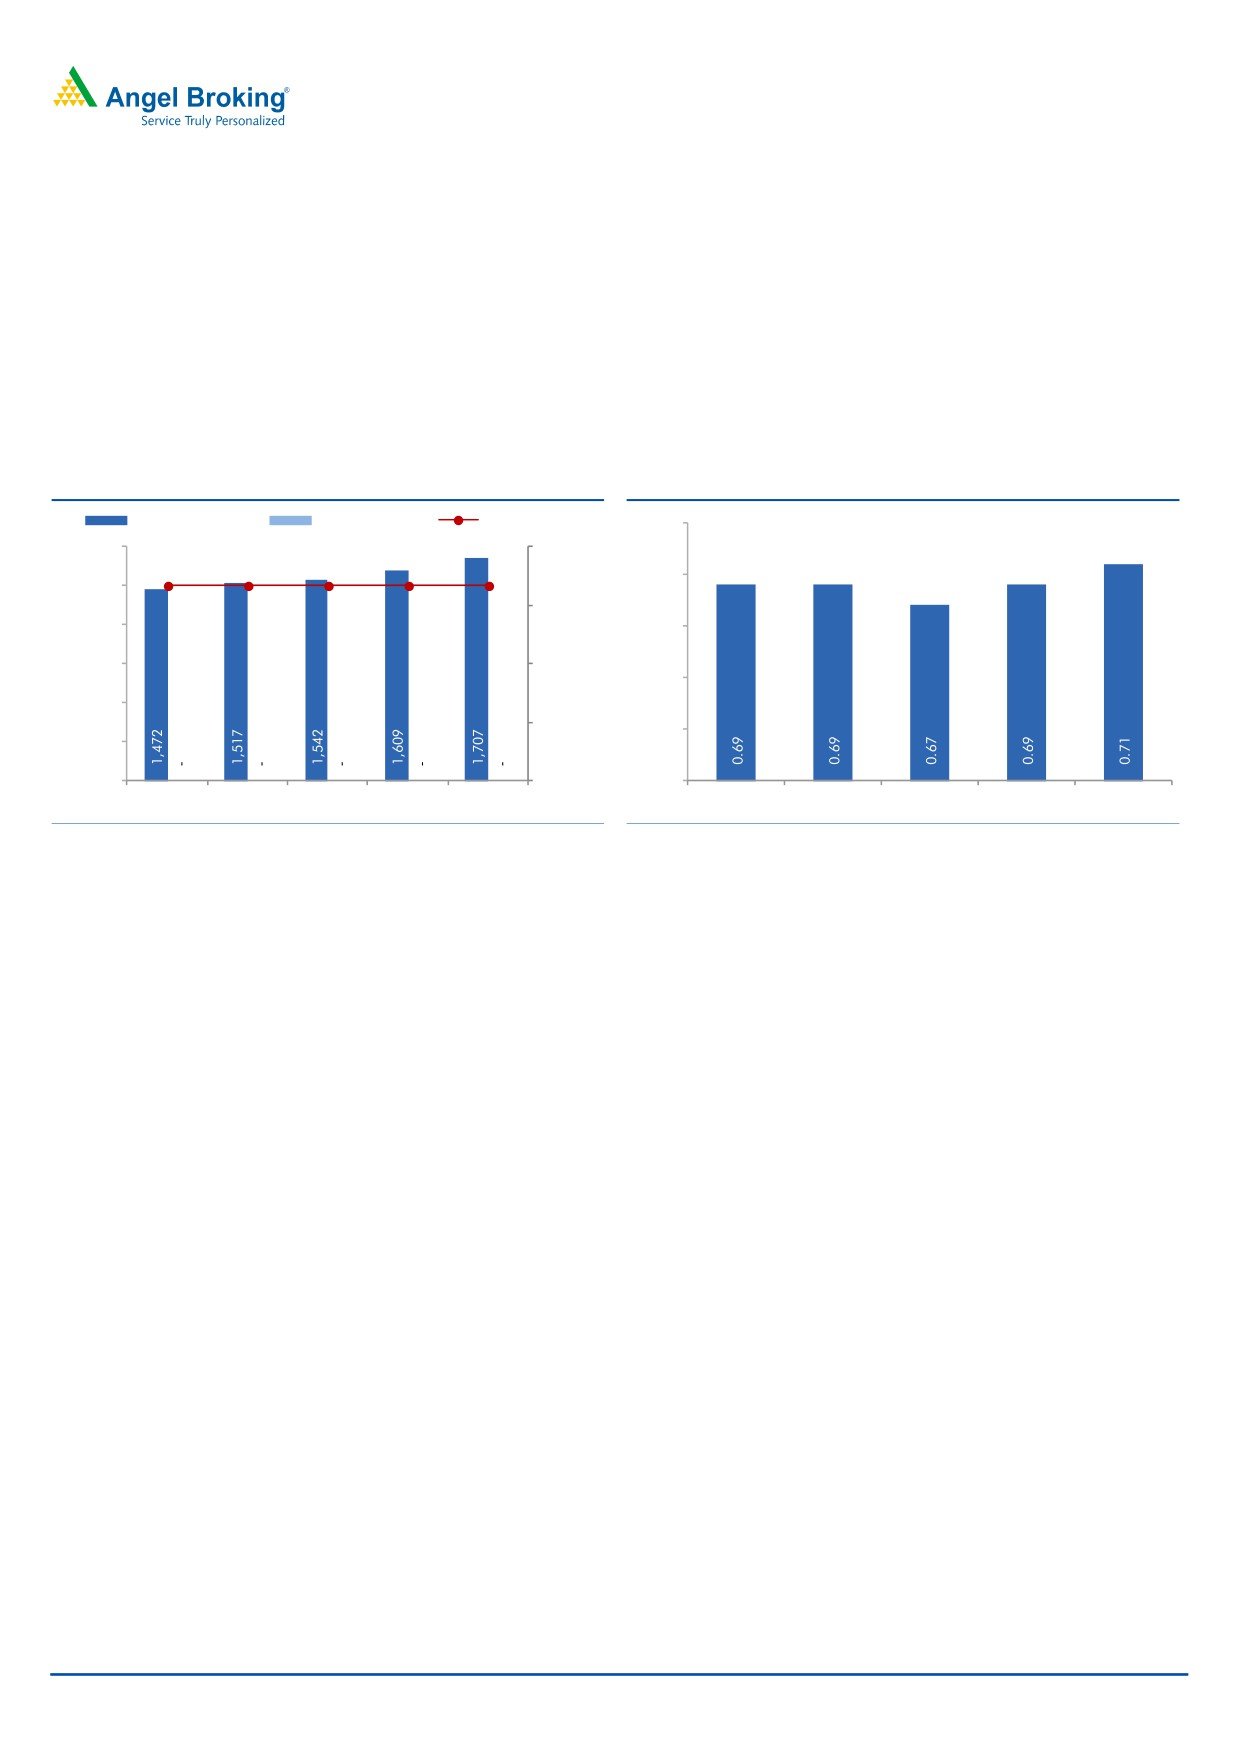
Asset quality remains fairly stable
Asset quality continues to remain fairly stable for the company, as its gross non-
performing assets as a % of total loans increased 2bp to 0.71% (vs 0.69% in
1QFY2016). The Gross NPA ratio for individual loans went up to 0.53% as against
0.51% in 1QFY2016, while the Gross NPA ratio for the non-individual loans
portfolio went up by 3bp qoq to 1.04%. The company continues to maintain a
100% Provision Coverage Ratio. In fact, the company carries `330cr of excess
provision over and above the regulatory requirement of `1,797cr.
Exhibit 6: NPA coverage remains at 100%
Exhibit 7: Gross NPA ratio remains stable
Gross NPA (`cr)
Net NPA (`cr)
PCR (%, RHS)
0.75
Gross NPA % (3 months)
1,800
120.0
100.0
100.0
100.0
100.0
100.0
0.70
1,500
90.0
1,200
0.65
900
60.0
0.60
600
30.0
0.55
300
-
-
0.50
2QFY15
3QFY15
4QFY15
1QFY16
2QFY16
2QFY15
3QFY15
4QFY15
1QFY16
2QFY16
Source: Company, Angel Research
Source: Company, Angel Research
October 27, 2015
4
HDFC | 2QFY2016 Result Update
Outlook and valuation
HDFC continues to post good set of numbers despite sluggish economic
environment. Overall, we expect HDFC to post a healthy PAT CAGR of 15.3% over
FY2015-17E. The stock has surged significantly from the lows witnessed in the
month of August
2015. Currently, HDFC’s core business (after adjusting
`482/share towards the value of its subsidiaries) trades at 4.5x FY2017E ABV,
which in our view, offers limited scope for upside from here on. Hence, we
maintain our Neutral rating on the stock.
Company Background
HDFC is India's leading housing finance company, with a balance sheet size of
around `2.6 lakh cr. The company's primary business is to provide loans for the
purchase or construction of residential houses. HDFC's distribution network spans
392 outlets, covering more than 2,400 towns and cities across India. HDFC also
has representative offices in London, Dubai and Singapore and service associates
in Kuwait, Oman, Qatar, Abu Dhabi and Saudi Arabia to cater to NRIs. From its
origins as a specialized mortgage company, HDFC has grown into a financial
conglomerate with market leading group companies in banking, asset
management and insurance verticals.
October 27, 2015
5
HDFC | 2QFY2016 Result Update
Income statement (standalone)
Y/E March (` cr)
FY12
FY13
FY14
FY15
FY16E
FY17E
NII*
4,998
5,927
6,666
7,631
8,341
9,502
- YoY Growth (%)
17.7
18.6
12.5
14.5
9.3
13.9
Other Income
1,199
1,329
1,503
1,865
2,017
2,350
- YoY Growth (%)
12.0
10.8
13.0
24.1
8.1
16.5
Operating Income
6,198
7,257
8,168
9,496
10,358
11,852
- YoY Growth (%)
16.5
17.1
12.6
16.3
9.1
14.4
Operating Expenses
452
539
628
707
795
898
- YoY Growth (%)
18.6
19.3
16.5
12.5
12.5
13.0
Pre - Provision Profit
5,746
6,718
7,540
8,789
9,563
10,954
- YoY Growth (%)
16.4
16.9
12.2
16.6
8.8
14.5
Prov. & Cont.
80
145
100
165
175
213
- YoY Growth (%)
14.3
81.3
(31.0)
65.0
6.1
21.6
Profit Before Tax
5,666
6,573
7,440
8,624
9,388
10,741
- YoY Growth (%)
16.4
16.0
13.2
15.9
8.9
14.4
Prov. for Taxation
1,543
1,725
2,000
2,634
2,922
3,334
- as a % of PBT
27.2
26.2
26.9
30.5
31.1
31.0
PAT
4,123
4,848
5,440
5,990
6,466
7,407
- YoY Growth (%)
16.6
17.6
12.2
10.1
8.0
14.5
Note: *Core NII
Balance sheet (standalone)
Y/E March (` cr)
FY12
FY13
FY14
FY15
FY16E
FY17E
Share Capital
295
309
312
315
315
315
Reserve & Surplus
18,722
24,691
27,643
30,655
33,661
37,092
Loan Funds
1,39,128
1,58,828
1,84,298
2,08,694
2,33,413
2,76,726
- Growth (%)
20.9
14.2
16.0
13.2
11.8
18.6
Other Liabilities & Prov.
9,375
11,703
13,504
14,383
16,153
18,962
Total Liabilities
1,67,520
1,95,531
2,25,757
2,54,047
2,83,542
3,33,095
Investments
12,207
13,613
13,804
14,294
15,020
16,238
Advances
1,40,422
1,69,571
1,96,554
2,27,700
2,55,024
3,00,928
- Growth (%)
20.2
20.8
15.9
15.8
12.0
18.0
Fixed Assets
234
238
276
677
758
894
Other Assets
14,657
12,109
15,123
11,376
12,741
15,034
Total Assets
1,67,520
1,95,531
2,25,757
2,54,047
2,83,542
3,33,095
October 27, 2015
6
HDFC | 2QFY2016 Result Update
Ratio analysis (standalone)
Y/E March
FY12
FY13
FY14
FY15
FY16E
FY17E
Profitability ratios (%)
NIMs
3.6
3.6
3.4
3.4
3.3
3.6
Cost to Income Ratio
7.3
7.4
7.7
7.4
7.7
7.3
RoA
2.7
2.6
2.5
2.4
2.3
2.7
RoE
22.7
22.0
20.5
20.3
19.9
22.7
Asset Quality (%)
Gross NPAs
0.76
0.71
0.69
0.68
0.70
0.76
Net NPAs
-
-
-
-
-
-
Provision Coverage
100.0
100.0
100.0
100.0
100.0
100.0
Per Share Data (`)
EPS
27.9
31.4
34.9
38.0
41.1
27.9
ABVPS (75% cover.)
128.8
161.7
179.1
196.7
215.8
128.8
DPS
11.0
12.5
14.0
15.1
16.1
11.0
Valuation Ratios
PER (x)
45.7
40.7
36.6
33.5
31.1
45.7
P/ABVPS (x)
9.9
7.9
7.1
6.5
5.9
9.9
DuPont Analysis#
NII
3.4
3.4
3.3
3.3
3.2
3.4
(-) Prov. Exp.
0.1
0.1
0.0
0.1
0.1
0.1
Adj. NII
3.4
3.3
3.2
3.2
3.1
3.4
Treasury
0.2
0.2
0.1
0.2
0.1
0.2
Int. Sens. Inc.
3.6
3.5
3.4
3.4
3.3
3.6
Other Inc.
0.5
0.4
0.5
0.4
0.5
0.5
Op. Inc.
4.1
3.9
3.8
3.9
3.7
4.1
Opex
0.3
0.3
0.3
0.3
0.3
0.3
PBT
3.8
3.6
3.5
3.6
3.4
3.8
Taxes
1.1
1.0
1.0
1.1
1.1
1.1
RoA
2.7
2.6
2.5
2.4
2.3
2.7
Leverage
14.4
12.6
11.1
10.9
10.8
14.4
RoE
39.3
33.2
28.1
26.3
24.7
39.3
Note: # Core RoEs excluding income and investments in subsidiaries
October 27, 2015
7
HDFC | 2QFY2016 Result Update
Research Team Tel: 022 - 39357800
DISCLAIMER
Angel Broking Private Limited (hereinafter referred to as “Angel”) is a registered Member of National Stock Exchange of India Limited,
Bombay Stock Exchange Limited and Metropolitan Stock Exchange of India Limited. It is also registered as a Depository Participant with
CDSL and Portfolio Manager with SEBI. It also has registration with AMFI as a Mutual Fund Distributor. Angel Broking Private Limited is
a registered entity with SEBI for Research Analyst in terms of SEBI (Research Analyst) Regulations, 2014 vide registration number
INH000000164. Angel or its associates has not been debarred/ suspended by SEBI or any other regulatory authority for accessing
/dealing in securities Market. Angel or its associates including its relatives/analyst do not hold any financial interest/beneficial
ownership of more than 1% in the company covered by Analyst. Angel or its associates/analyst has not received any compensation /
managed or co-managed public offering of securities of the company covered by Analyst during the past twelve months. Angel/analyst
has not served as an officer, director or employee of company covered by Analyst and has not been engaged in market making activity
of the company covered by Analyst.
This document is solely for the personal information of the recipient, and must not be singularly used as the basis of any investment
decision. Nothing in this document should be construed as investment or financial advice. Each recipient of this document should
make such investigations as they deem necessary to arrive at an independent evaluation of an investment in the securities of the
companies referred to in this document (including the merits and risks involved), and should consult their own advisors to determine
the merits and risks of such an investment.
Reports based on technical and derivative analysis center on studying charts of a stock's price movement, outstanding positions and
trading volume, as opposed to focusing on a company's fundamentals and, as such, may not match with a report on a company's
fundamentals.
The information in this document has been printed on the basis of publicly available information, internal data and other reliable
sources believed to be true, but we do not represent that it is accurate or complete and it should not be relied on as such, as this
document is for general guidance only. Angel Broking Pvt. Limited or any of its affiliates/ group companies shall not be in any way
responsible for any loss or damage that may arise to any person from any inadvertent error in the information contained in this report.
Angel Broking Pvt. Limited has not independently verified all the information contained within this document. Accordingly, we cannot
testify, nor make any representation or warranty, express or implied, to the accuracy, contents or data contained within this document.
While Angel Broking Pvt. Limited endeavors to update on a reasonable basis the information discussed in this material, there may be
regulatory, compliance, or other reasons that prevent us from doing so.
This document is being supplied to you solely for your information, and its contents, information or data may not be reproduced,
redistributed or passed on, directly or indirectly.
Neither Angel Broking Pvt. Limited, nor its directors, employees or affiliates shall be liable for any loss or damage that may arise from
or in connection with the use of this information.
Note: Please refer to the important ‘Stock Holding Disclosure' report on the Angel website (Research Section). Also, please refer to the
latest update on respective stocks for the disclosure status in respect of those stocks. Angel Broking Pvt. Limited and its affiliates may
have investment positions in the stocks recommended in this report.
Disclosure of Interest Statement
HDFC
1. Analyst ownership of the stock
No
2. Angel and its Group companies ownership of the stock
No
3. Angel and its Group companies' Directors ownership of the stock
No
4. Broking relationship with company covered
No
Note: We have not considered any Exposure below ` 1 lakh for Angel, its Group companies and Directors
Ratings (Based on expected returns
Buy (> 15%)
Accumulate (5% to 15%)
Neutral (-5 to 5%)
over 12 months investment period):
Reduce (-5% to -15%)
Sell (< -15)
October 27, 2015
8