4QFY2017 Result Update | Banking
April 24, 2017
HDFC Bank
ACCUMULATE
CMP
`1,533
Performance Highlights
Target Price
`1,650
Particulars (` cr)
4QFY17
3QFY17
% chg (qoq)
4QFY16
% chg (yoy)
Investment Period
12 Months
NII
9,055
8,309
9.0
7,453
21.5
Pre-prov. profit
7,279
6,609
10.1
5,735
26.9
Stock Info
PAT
3,990
3,865
3.2
3,374
18.3
Source: Company, Angel Research
Sector
Banks
Market Cap (` cr)
392,774
HDFC Bank reported a satisfactory set of results for the quarter. PAT growth
of 18% YoY was backed by renewed momentum in loan growth and
Beta
0.8
improvement in NIM QoQ,with stable asset quality.
52 Week High / Low
1538/1085
Advances growth picked up again during the quarter: After some moderation in
Avg. Daily Volume
136,732
credit growth in Q3, the banks business started picking up in Q4 with 19.4%
Face Value (`)
2
growth. Domestic loan book grew by 23.7%. In Q3 the bank’s loan book growth
BSE Sensex
29,656
had moderated to 13.4%. The slowdown in the loan growth in Q3 was due to
Nifty
9,218
repayment of overseas loans to the tune of $ 2 Bn linked to FCNR deposit. HDFC
bank’s ability to push business growth post domentisation shows the strength in
Reuters Code
HDBK.BO
its business model and we believe it will be able to deliver 18-20% CAGR in loan
Bloomberg Code
HDFCB@IN
book over FY17-19
CASA growth to helped in lower cost of funds and improved NIM during the
Shareholding Pattern (%)
quarter: Deposit growth was strong 17.8% with strong accretion to CASA
base which went up to 48% vs 45.3% QoQ. Strong growth in low cost
Promoters
21.2
deposit helped NIM further expanding to 4.3%. We expect some moderation
MF / Banks / Indian Fls
16.3
in NIM going ahead; however HDFC Bank will continue to have one of the
FII / NRIs / OCBs
53.1
best margins among Indian banks. Overall we expect deposit to report 17%
Indian Public / Others
9.5
CAGR over FY17-19.
No sign of stress in asset quality, a big postive: Asset quality of the bank
remained largely stable with GNPAs at 1.05% and NNPAs at 0.33%.The
Abs.(%)
3m 1yr
3yr
bank has highlighted that there was no divergence observed by RBI for FY16
Sensex
8.3
15.5
29.6
with respect to NPAs. While there was a rise in provisions, part of this can be
HDFCB
22.6
34.0
111.9
attributed to general growth in business and to the Rs 250 cr worth of NPA
which were due in Q3, but the bank had used the RBI’s dispensation and not
accounted that as NPA. However, from pure operational point of view the
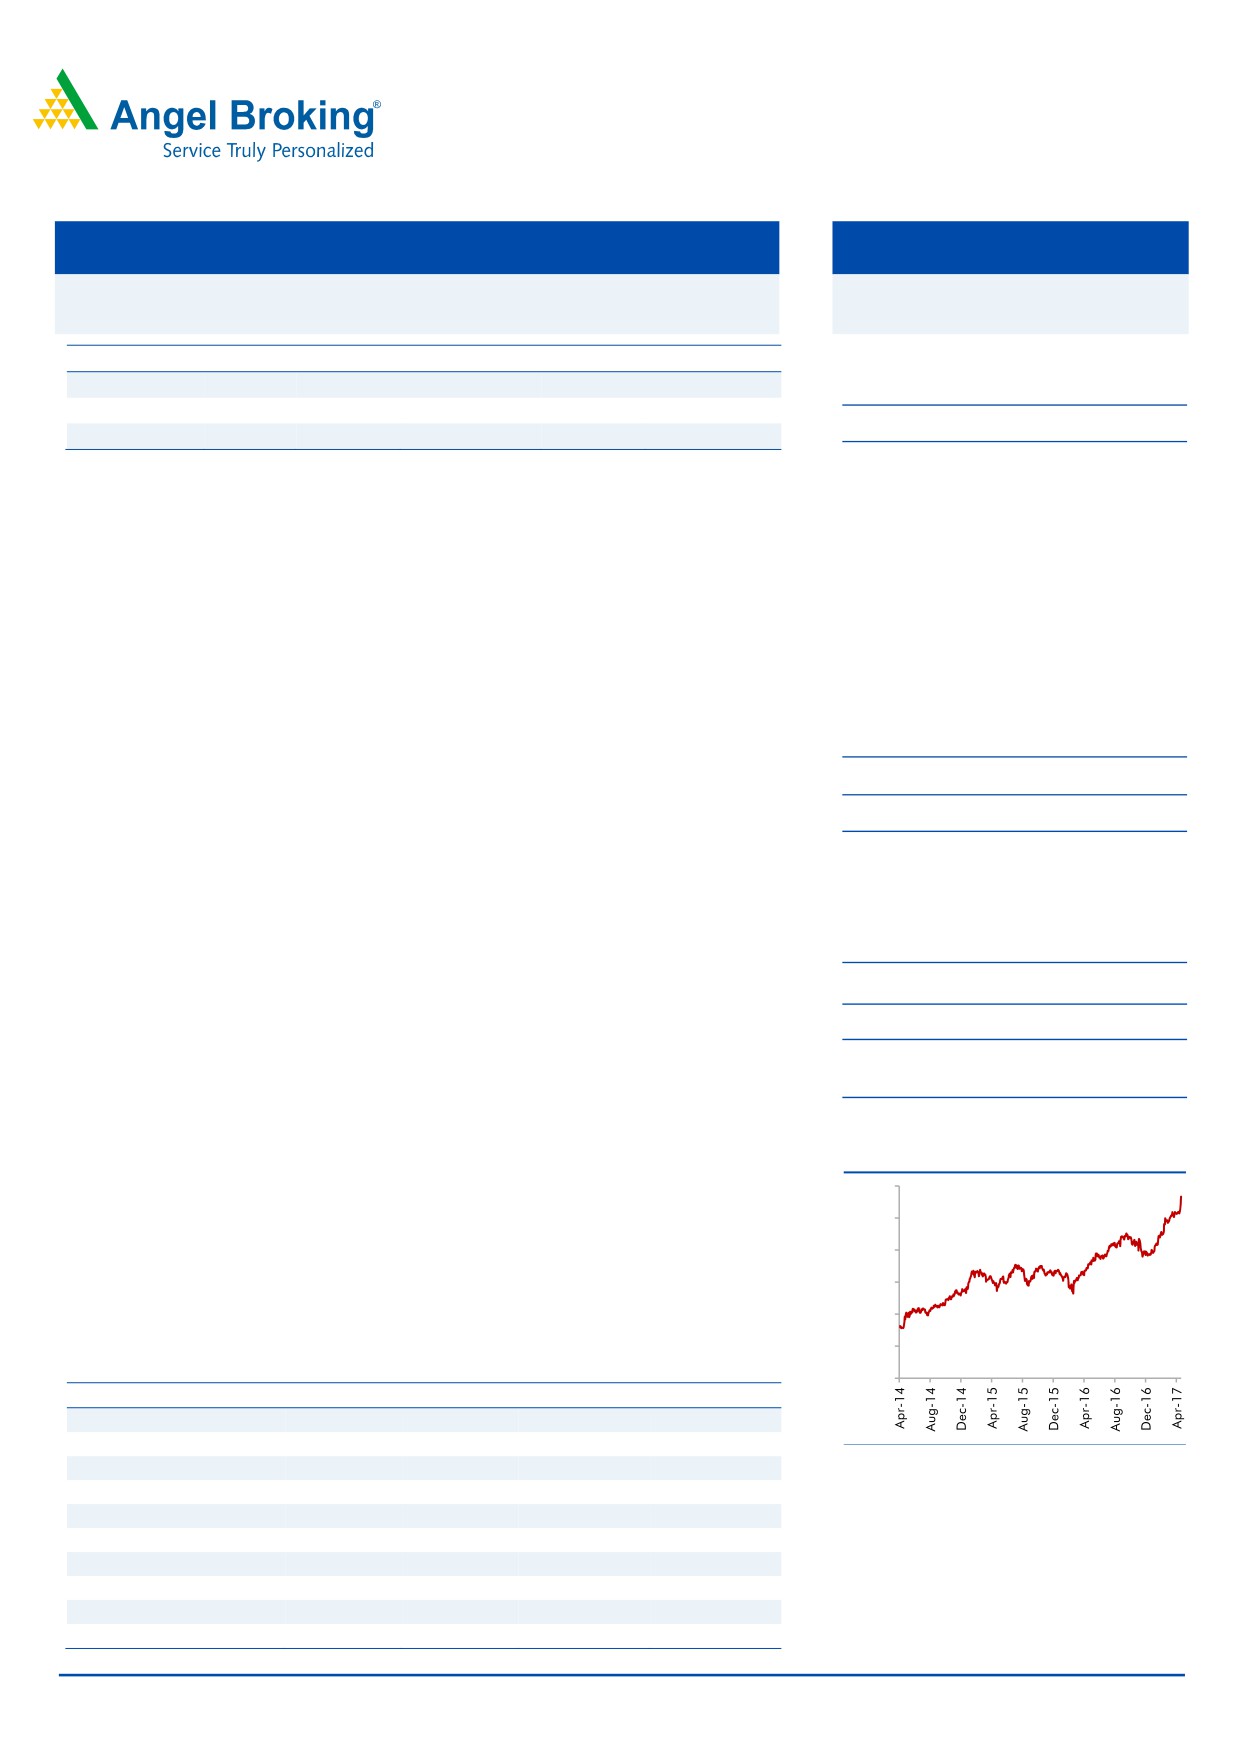
3-year price chart
credit cost of HDFC Bank remains under control.
1,600
Outlook and valuation: After some moderation in business growth HDFC Bank is
1,400
back with strong momentum during the quarter. We believe strong internal
capital generation will drive 20% earnings CAGR over FY17-19, which will be
1,200
backed by stable NIM and moderating credit cost. At the current market price,
1,000
the bank is trading at 3.3x FY2019E ABV. We Maintain ACCUMULATE rating, on
800
the stock, with a target price of `1,650.
600
Key financials (standalone)
400
Y/E March (` cr)
FY2016
FY2017
FY2018E
FY2019E
NII
27,592
33,139
40,298
45,762
% chg
23.6
20.1
21.6
13.6
Source: Company, Angel Research
Net profit
12,296
14,549
17,857
20,971
% chg
21.2
18.3
22.7
17.4
NIM (%)
4.5
4.5
4.5
4.4
EPS (`)
48.6
56.8
69.7
81.8
P/E (x)
31.5
27.0
22.0
18.7
P/ABV (x)
5.4
4.6
4.0
3.3
Siddharth Purohit
RoA (%)
1.9
1.9
1.9
1.9
022 - 3935 7800 Ext: 6872
RoE (%)
18.3
18.3
19.2
19.0
Source: Company, Angel Research; Note: CMP as of April 24, 2017
Please refer to important disclosures at the end of this report
1
HDFC Bank | 4QFY2017 Result Update
Exhibit 1: 4QFY2017 performance (standalone)
Particulars (` cr)
Q1FY16
Q2FY16
Q3FY16
Q4FY16
Q1FY17
Q2FY17
Q3FY17
Q4FY17
% QoQ
% YoY
Interest earned
14,041
14,773
15,411
15,997
16,516
17,070
17,606
18,114
2.9%
13.2%
- on Advances / Bills
10,447
10,948
11,483
11,949
12,471
12,901
13,176
13,507
2.5%
13.0%
- on investments
3,281
3,398
3,651
3,790
3,809
3,818
4,049
4,268
5.4%
12.6%
- on balance with RBI & others
78
175
60
49
40
140
187
165
-11.6%
237.8%
- on others
234
252
217
209
196
211
194
174
-10.2%
-16.9%
Interest Expended
7,652
8,092
8,343
8,543
8,735
9,076
9,297
9,059
-2.6%
6.0%
Net Interest Income
6,389
6,681
7,069
7,453
7,781
7,994
8,309
9,055
9.0%
21.5%
Other income
2,462
2,552
2,872
2,866
2,807
2,901
3,143
3,446
9.7%
20.3%
- Fee & commission income
1,713
1,869
2,005
2,172
1,978
2,104
2,207
2,523
14.3%
16.1%
- Treasury income
126
162
328
116
277
284
399
180
-54.7%
56.2%
- Forex & derivative income
348
320
277
283
315
295
297
357
20.0%
26.1%
Others
275
201
262
295
237
219
240
386
60.9%
30.8%
Operating income
8,851
9,233
9,941
10,319
10,588
10,895
11,452
12,501
9.2%
21.1%
Operating expenses
4,001
4,190
4,205
4,584
4,769
4,870
4,843
5,222
7.8%
13.9%
- Employee expenses
1,359
1,414
1,431
1,498
1,585
1,657
1,689
1,553
-8.1%
3.7%
- Other Opex
2,642
2,776
2,774
3,086
3,184
3,213
3,154
3,669
16.3%
18.9%
Pre-provision Profit
4,850
5,043
5,736
5,735
5,819
6,025
6,609
7,279
10.1%
26.9%
Provisions & Contingencies
728
681
654
662
867
749
716
1,262
76.3%
90.5%
PBT
4,122
4,362
5,082
5,072
4,952
5,276
5,893
6,018
2.1%
18.6%
Provision for Tax
1,426
1,492
1,725
1,698
1,714
1,820
2,028
2,028
0.0%
19.4%
PAT
2,696
2,869
3,357
3,374
3,239
3,455
3,865
3,990
3.2%
18.3%
Effective Tax Rate (%)
34.6
34.2
33.9
33.5
34.6
34.5
34.4
33.7
Source: Company, Angel Research
April 24, 2017
2
HDFC Bank | 4QFY2017 Result Update
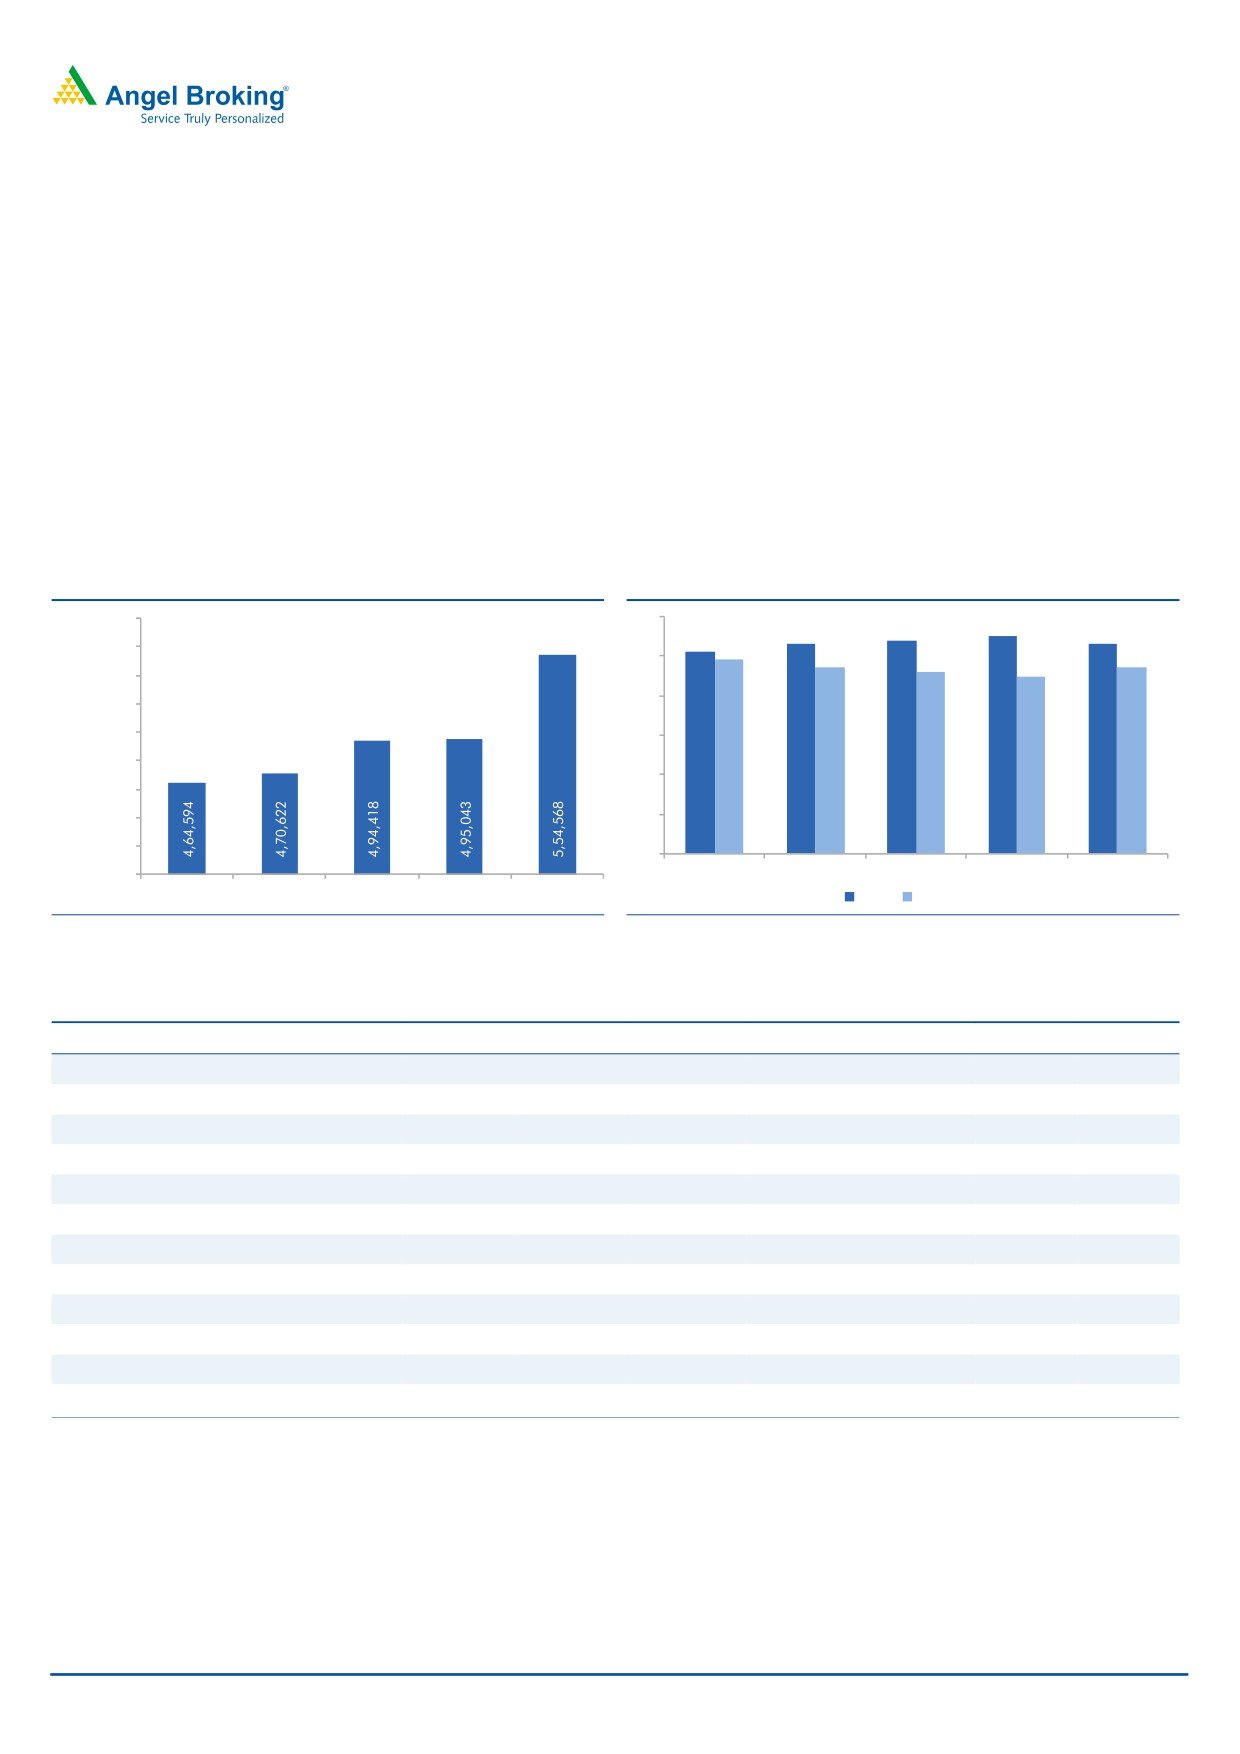
Advances growth picked up again during the quarter: After some moderation in
credit growth in Q3, the banks business started picking up in Q4FY17 with 19.4%
YoY growth, which was backed by 22.1% growth in retail loan book. Within the
retail loan book auto segment reported a healthy growth of 22.4% and personal
loans segment where HDFC bank has a strong market share grew by 34% YoY.
Credit cards another area of focus for the bank also had a healthy growth of
26.7%. Domestic loan book grew by 23.7%. In Q3 the bank’s loan book growth
had moderated to 13.4%, where in the domestic loan book had grown by 17.5%.
The slowdown in the loan growth in Q3 was due to repayment of overseas loans to
the tune of $ 2 Bn linked to FCNR deposit. HDFC bank’s ability to push business
growth post domentisation shows the strength in its business model and we believe
it will be able to deliver 18-20% CAGR in loan book over FY17-19
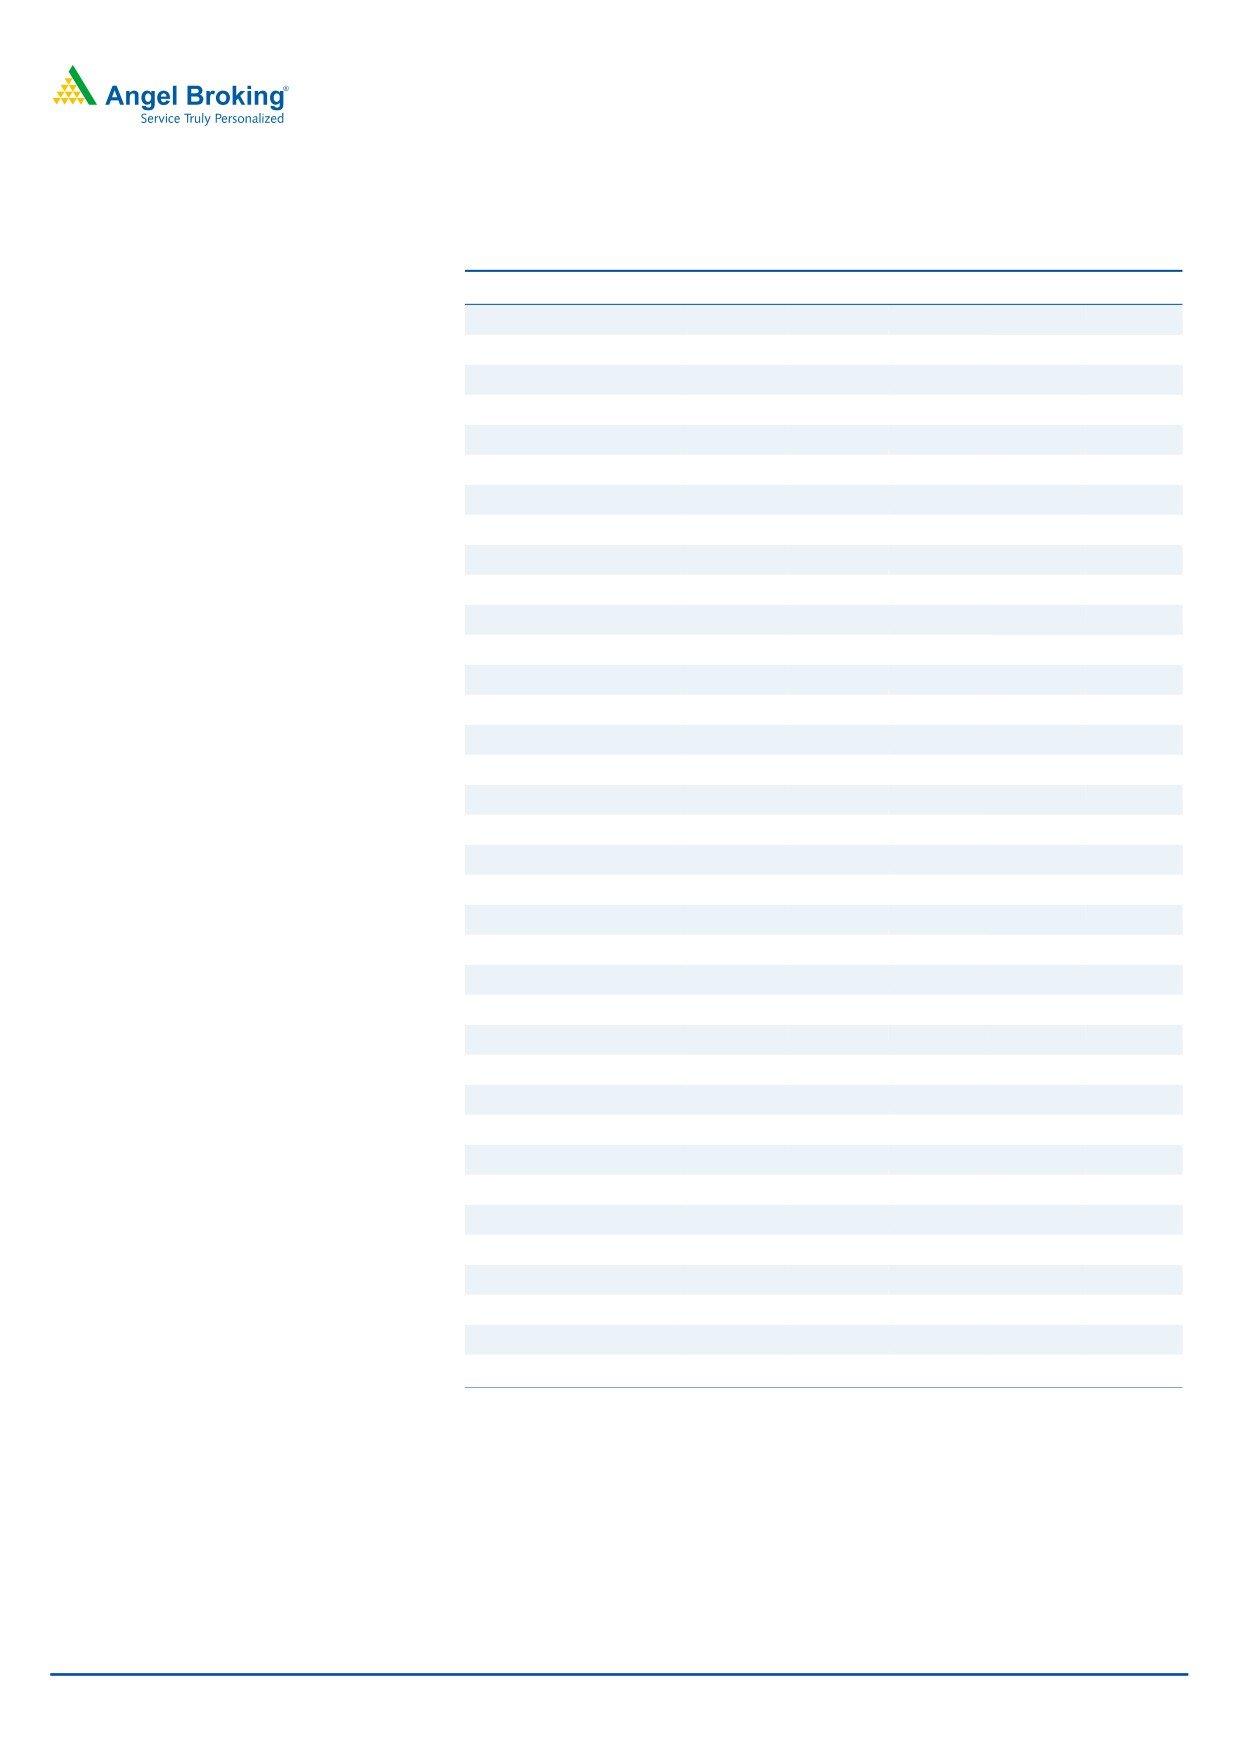
Exhibit 2: Advances growth picked up again (` cr)
Exhibit 3: Retail continues to drive the growth (%)
5,80,000
60
55
53
54
53
51
5,60,000
49
47
47
50
46
45
5,40,000
40
5,20,000
5,00,000
30
4,80,000
20
4,60,000
4,40,000
10
4,20,000
0
4,00,000
Q4FY16
Q1FY17
Q2FY17
Q3FY17
Q4FY17
Q4FY16
Q1FY17
Q2FY17
Q3FY17
Q4FY17
Retail
Wholesale
Source: Company, Angel Research
Source: Company, Angel Research
Exhibit 4: Break Up Of Domestic Retail Book
Break Up Of Domestic Retail Bank ( Rs Cr)
Q4FY16
Q1FY17
Q2FY17
Q3FY17
Q4FY17
% YoY
% QoQ
Auto
57,281
59,561
64,429
65,545
70,099
22.4%
6.9%
Personal Loans
37,704
41,059
45,024
46,826
50,545
34.1%
7.9%
Home Loans
31,860
33,605
33,574
35,423
38,379
20.5%
8.3%
Business Banking
61,089
60,444
65,794
63,582
71,188
16.5%
12.0%
Kisan Gold Card
22,934
22,403
24,881
23,888
26,742
16.6%
11.9%
Credit Cards
20,520
21,255
21,336
23,673
25,995
26.7%
9.8%
CV/CE
30,935
31,461
33,561
34,526
37,937
22.6%
9.9%
Others
14,644
15,151
16,276
16,190
17,803
21.6%
10.0%
Two Wheelers
6,383
6,614
7,118
7,107
7,345
15.1%
3.3%
Gold Loans
4,586
4,876
5,093
4,818
4,925
7.4%
2.2%
Loan Against Securities
1,897
1,886
2,052
2,249
2,798
47.5%
24.4%
Total
2,89,833
2,98,315
3,19,138
3,23,827
3,53,756
22.1%
9.2%
Source: Company, Angel Research
April 24, 2017
3
HDFC Bank | 4QFY2017 Result Update
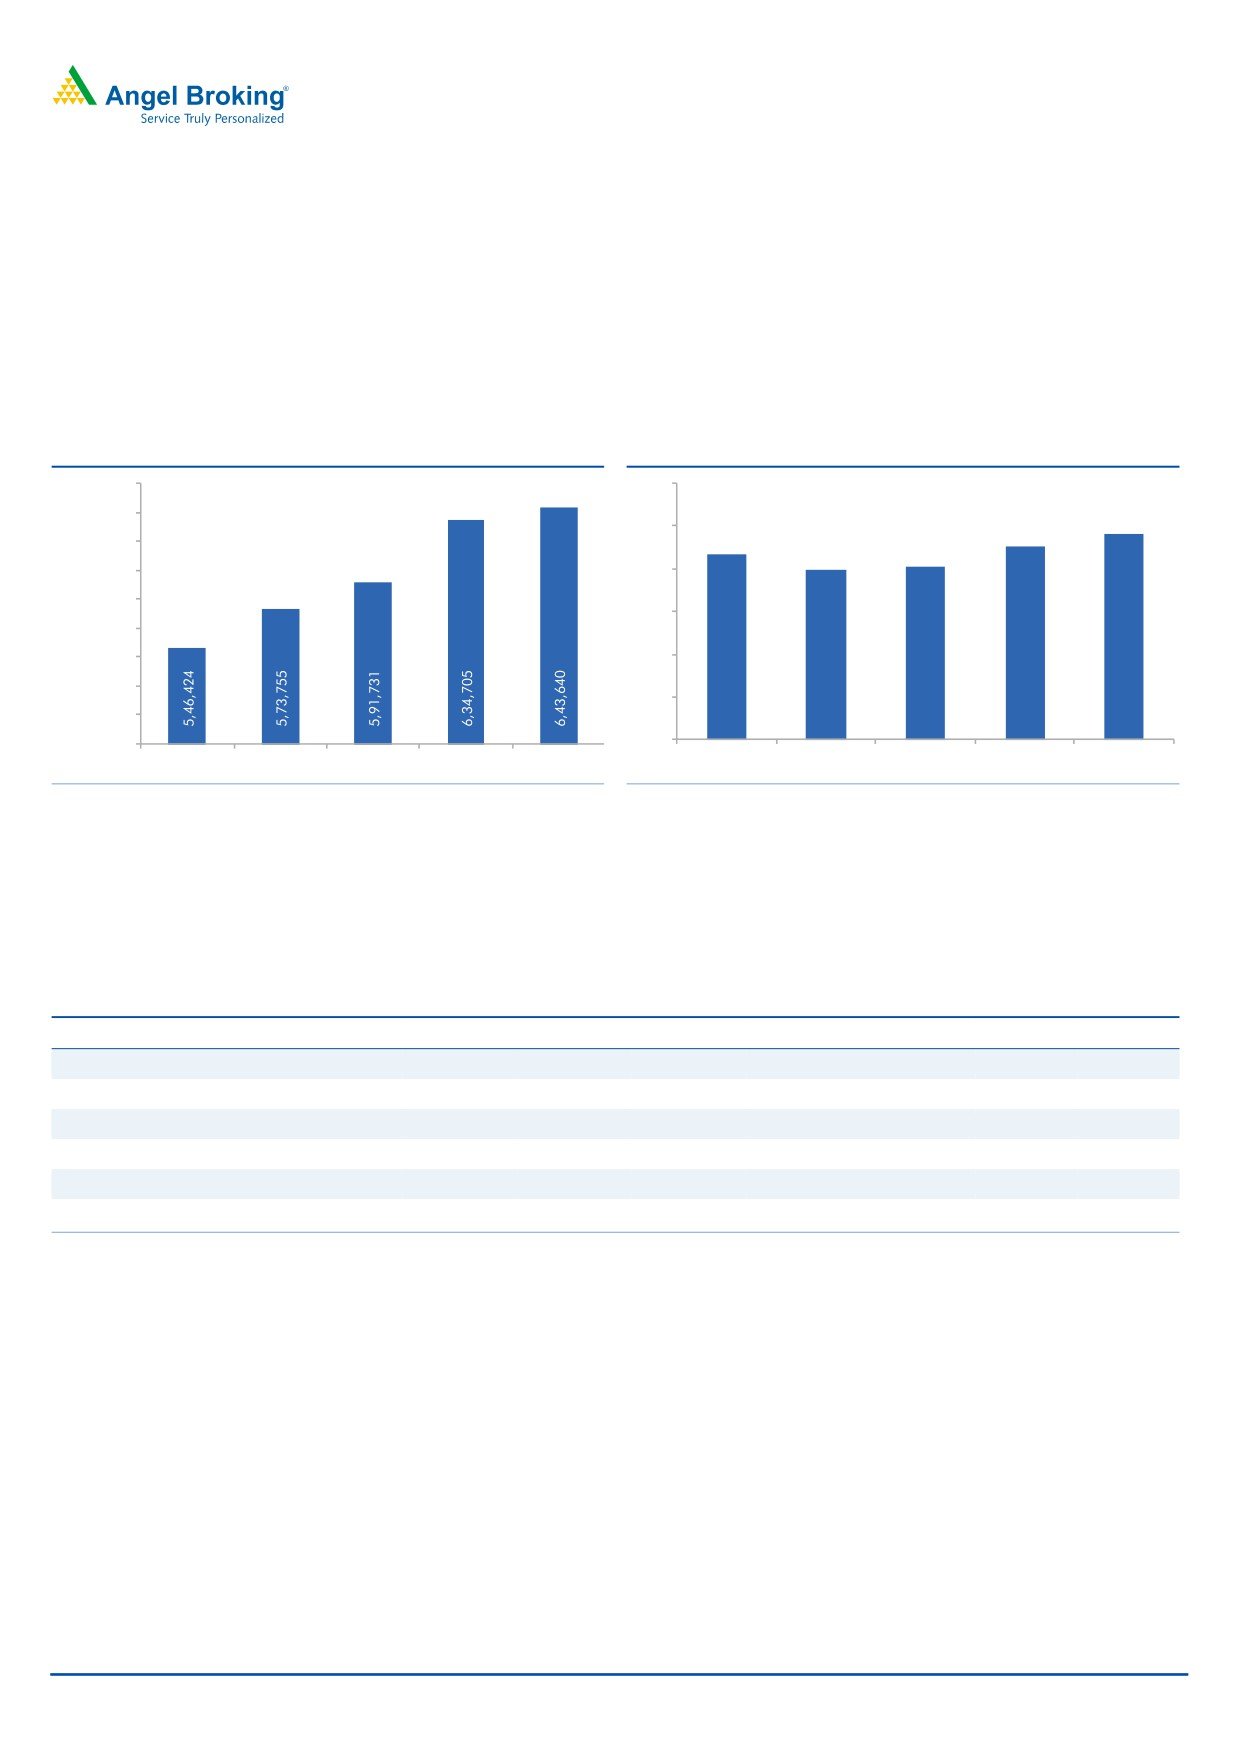
Deposit growth too was strong during the quarter: Deposit growth was strong
17.8% with strong accretion to CASA base which went up to 48% vs 45.3% QoQ.
In absolute terms CASA addition was `21,280 cr growing by 30.8% YoY,7% QoQ.
Strong growth in low cost deposit helped NIM further expanding to 4.3% up 20
bps QoQ. We expect some moderation in NIM going ahead; however HDFC Bank
will continue to have one of the best margins among Indian banks. Overall we
expect deposit to report 17% CAGR over FY17-19.
Exhibit 5: Deposit growth trend (` cr)
Exhibit 6: CASA ratio jumped sharply QoQ again (%)
6,60,000
60.0
6,40,000
48.0
50.0
45.4
6,20,000
43.2
39.9
40.4
6,00,000
40.0
5,80,000
30.0
5,60,000
5,40,000
20.0
5,20,000
10.0
5,00,000
4,80,000
0.0
Q4FY16
Q1FY17
Q2FY17
Q3FY17
Q4FY17
Q4FY16
Q1FY17
Q2FY17
Q3FY17
Q4FY17
Source: Company, Angel Research,
Source: Company, Angel Research
Other income for the bank also picked up during the quarter growing by 20.3%
YoY. Fee income grew by 16.1% YoY and formed 73% of the non operating
income. However, treasury income was lower QoQ. NPA recovery witnessed
improvement QoQ.
Exhibit 7: Other Income Bifurcation
Other Income (` Cr)
Q4FY16
Q1FY17
Q2FY17
Q3FY17
Q4FY17
% YoY
% QoQ
Fees Income
2,172
1,978
2,104
2,207
2,523
16.1%
14.3%
Forex
283
315
295
297
357
26.1%
20.0%
Profit on sale of investments
116
277
284
399
180
56.2%
-54.7%
NPA Recovery
295
237
219
240
386
30.8%
60.9%
Other Income
2,866
2,807
2,901
3,143
3,446
20.3%
9.7%
Fee Income as % of Other Income
76%
70%
73%
70%
73%
Source: Company, Angel Research
April 24, 2017
4
HDFC Bank | 4QFY2017 Result Update
CASA growth to help in lower cost of funds and stable NIM going ahead: During
the quarter HDFC bank witnessed sharp surge in its low cost deposit base and
CASA ratio went up by 270 bps QoQ to 48% and this has helped in lower cost of
funds and improvement in NIM. On a sequential basis NIM has expanded from
4.10% to 4.3%. While NIM may not significantly improve from here on, HDFC is
likely to continue to have a strong retail book for many years to come and this
should help it enjoy similar NIM in the coming years.
Exhibit 8: Cost/ Income remains under control
Exhibit 9: NIM got a further push
46.0
4.5
4.40
45.0
4.4
44.7
45.0
44.4
4.4
4.30
4.30
4.3
44.0
4.3
4.20
43.0
4.2
42.3
4.2
4.10
41.8
42.0
4.1
4.1
41.0
4.0
40.0
4.0
Q4FY16
Q1FY17
Q2FY17
Q3FY17
Q4FY17
Q4FY16
Q1FY17
Q2FY17
Q3FY17
Q4FY17
Cost / Income
%
NIM %
Source: Company, Angel Research
Source: Company, Angel Research
No sign of stress on asset quality: Asset quality of the bank remained largely
stable with GNPAs at 1.05% and NNPAs at 0.33%.The bank has highlighted
that there was no divergence observed by RBI for FY16 with respect to NPAs.
While there was a rise in provisions part of this can be attributed to general
growth in business and to the `250 cr worth of NPA which were due in Q3,
but the bank had used the RBI’s dispensation and not accounted that as NPA.
However, from pure operational point of view the credit cost of HDFC Bank
remains under control. We have factored in credit cost of 60 bps for FY18 and
FY19 in our model. HDFC Banks historical track record and ability to sail
through economic down turn without compromising on its credit quality gives
us comfort that credit cost will not materially rise in the near term.
Exhibit 10: GNPAs & NNPAs trend
1.20
1.04
1.05
1.05
1.02
0.95
0.97
1.00
0.91
0.94
0.80
0.60
0.40
0.32
0.32
0.33
0.29
0.30
0.27
0.28
0.25
0.20
0.00
Q1FY16
Q2FY16
Q3FY16
Q4FY16
Q1FY17
Q2FY17
Q3FY17
Q4FY17
GNPAs (%) NNPAs (%)
Source: Company, Angel Research
April 24, 2017
5
HDFC Bank | 4QFY2017 Result Update
Outlook & Valuation
After some moderation in business growth HDFC Bank is back with strong
momentum during the quarter. We believe strong internal capital generation will
drive 20% earnings CAGR over FY17-19, which will be backed by stable NIM and
moderating credit cost. HDFC Bank has always traded at a premium to other
banks in India, because of its best in class asset quality, superior NIM and
sustainable growth. We believe the bank will continue to attract premium
valuations going ahead as well. At the current market price, the bank is trading at
3.3x FY2019E ABV. We Maintain ACCUMULATE rating, on the stock, with a target
price of `1,650.
Company Background
HDFC Bank is the second-largest private sector bank in India with a pan-India
network of over 4,715 branches and nearly 12,260 ATMs. HDFC has been a
leader in the retail lending space in India and has consistently outpaced the
industry growth rate. Huge and increasing branch network has enabled the bank
in gaining a strong market share in the retail loans in India. This has also ensured
a higher share of low cost deposits (CASA) for the bank. The management has
time and again reiterated that in the retail loan space it will continue to have
strong market share in the coming years as well.
April 24, 2017
6
HDFC Bank | 4QFY2017 Result Update
Income Statement ( Standalone)
Y/E March (` cr)
FY2015
FY2016
FY2017
FY2018E
FY2019E
Net Interest Income
22,329
27,592
33,139
40,298
45,762
- YoY Growth (%)
20.8
23.6
20.1
21.6
13.6
Other Income
8,996
10,752
12,296
14,476
16,957
- YoY Growth (%)
13.6
19.5
14.4
17.7
17.1
Operating Income
31,326
38,343
45,435
54,773
62,719
- YoY Growth (%)
18.6
22.4
18.5
20.6
14.5
Operating Expenses
13,988
16,980
19,703
24,173
27,038
- YoY Growth (%)
16.2
21.4
16.0
22.7
11.9
Pre - Provision Profit
17,338
21,364
25,732
30,600
35,680
- YoY Growth (%)
20.7
23.2
20.4
18.9
16.6
Prov. & Cont.
2,076
2,726
3,593
3,948
4,381
- YoY Growth (%)
30.7
31.3
31.8
9.9
11.0
Profit Before Tax
15,262
18,638
22,139
26,652
31,299
- YoY Growth (%)
19.5
22.1
18.8
20.4
17.4
Prov. for Taxation
5,113
6,342
7,589
8,795
10,329
- as a % of PBT
33.5
34.0
34.3
33.0
33.0
PAT
10,150
12,296
14,549
17,857
20,971
- YoY Growth (%)
19.7
21.2
18.3
22.7
17.4
Balance Sheet ( Standalone)
Y/E March (` cr)
FY2015
FY2016
FY2017
FY2018E
FY2019E
Share Capital
501
506
513
513
513
Reserves & Surplus
61,508
72,172
85,502
99,311
1,20,282
Net Worth
62,009
72,678
86,014
99,824
1,20,794
Deposits
4,50,796
5,46,424
6,43,640
7,52,967
8,74,876
- Growth (%)
22.7
21.2
17.8
17.0
16.2
Borrowings
45,214
53,018
74,029
82,826
96,236
Other Liab & Prov.
32,484
36,725
56,709
60,237
69,990
Total Liabilities
5,90,503
7,08,846
8,60,392
9,95,855
11,61,897
Cash balances
27,510
30,058
37,897
43,672
48,118
Bank balances
8,821
8,861
11,055
12,800
13,998
Investments
1,51,642
1,63,886
2,14,463
2,48,479
2,88,709
Advances
3,65,495
4,64,594
5,54,568
6,61,303
7,73,631
- Growth (%)
20.6
27.1
19.4
19.2
17.0
Fixed Assets
3,122
3,343
3,627
4,668
5,424
Other Assets
33,913
38,104
38,782
24,932
32,017
Total Assets
5,90,503
7,08,846
8,60,392
9,95,855
11,61,897
April 24, 2017
7
HDFC Bank | 4QFY2017 Result Update
Ratio Analysis ( Standalone)
Y/E March
FY15
FY16
FY17
FY18E
FY19E
Profitability Ratios (%)
NIMs
4.4
4.5
4.5
4.5
4.4
Cost to Income Ratio
44.7
44.3
43.4
44.1
43.1
RoA
1.9
1.9
1.9
1.9
1.9
RoE
19.2
18.3
18.3
19.2
19.0
B/S ratios (%)
CASA Ratio
44.0
43.2
48.0
45.0
45.0
Credit/Deposit Ratio
81.1
85.0
86.2
87.8
88.4
CAR
16.8
15.5
14.7
15.4
15.6
- Tier I
13.7
13.2
12.9
13.7
14.2
Asset Quality (%)
Gross NPAs
0.9
0.9
1.0
1.1
1.1
Net NPAs
0.2
0.3
0.3
0.3
0.3
Slippages
1.6
1.6
1.5
1.5
1.0
Loan Loss Prov./Avg. Assets
0.6
0.6
0.6
0.6
0.6
Provision Coverage
74
70
74
69
69
Per Share Data (`)
EPS
40.5
48.6
56.8
69.7
81.8
ABVPS
247
287
336
390
471
DPS
8.0
9.5
11.5
13.5
13.5
Valuation Ratios
PER (x)
37.9
31.5
27.0
22.0
18.7
P/ABVPS (x)
6.3
5.4
4.6
4.0
3.3
Dividend Yield
0.6
0.7
0.8
1.0
1.0
DuPont Analysis (%)
NII
4.1
4.2
4.2
4.3
4.2
Non Interest Income
1.7
1.7
1.6
1.6
1.6
Total Revenues
5.8
5.9
5.8
5.9
5.8
Operating Cost
2.6
2.6
2.5
2.6
2.5
PPP
3.2
3.3
3.3
3.3
3.3
Total Provisions
0.4
0.4
0.5
0.4
0.4
PreTax Profit
2.8
2.9
2.8
2.9
2.9
Tax
0.9
1.0
1.0
0.9
1.0
ROA
1.9
1.9
1.9
1.9
1.9
Leverage
10.3
9.6
9.9
10.0
9.8
RoE (%)
19.2
18.3
18.3
19.2
19.0
April 24, 2017
8
HDFC Bank | 4QFY2017 Result Update
Research Team Tel: 022 - 39357800
DISCLAIMER
Angel Broking Private Limited (hereinafter referred to as “Angel”) is a registered Member of National Stock Exchange of India Limited,
Bombay Stock Exchange Limited and Metropolitan Stock Exchange Limited. It is also registered as a Depository Participant with CDSL
and Portfolio Manager with SEBI. It also has registration with AMFI as a Mutual Fund Distributor. Angel Broking Private Limited is a
registered entity with SEBI for Research Analyst in terms of SEBI (Research Analyst) Regulations, 2014 vide registration number
INH000000164. Angel or its associates has not been debarred/ suspended by SEBI or any other regulatory authority for accessing
/dealing in securities Market. Angel or its associates/analyst has not received any compensation / managed or co-managed public
offering of securities of the company covered by Analyst during the past twelve months.
This document is solely for the personal information of the recipient, and must not be singularly used as the basis of any investment
decision. Nothing in this document should be construed as investment or financial advice. Each recipient of this document should
make such investigations as they deem necessary to arrive at an independent evaluation of an investment in the securities of the
companies referred to in this document (including the merits and risks involved), and should consult their own advisors to determine
the merits and risks of such an investment.
Reports based on technical and derivative analysis center on studying charts of a stock's price movement, outstanding positions and
trading volume, as opposed to focusing on a company's fundamentals and, as such, may not match with a report on a company's
fundamentals. Investors are advised to refer the Fundamental and Technical Research Reports available on our website to evaluate the
contrary view, if any.
The information in this document has been printed on the basis of publicly available information, internal data and other reliable
sources believed to be true, but we do not represent that it is accurate or complete and it should not be relied on as such, as this
document is for general guidance only. Angel Broking Pvt. Limited or any of its affiliates/ group companies shall not be in any way
responsible for any loss or damage that may arise to any person from any inadvertent error in the information contained in this report.
Angel Broking Pvt. Limited has not independently verified all the information contained within this document. Accordingly, we cannot
testify, nor make any representation or warranty, express or implied, to the accuracy, contents or data contained within this document.
While Angel Broking Pvt. Limited endeavors to update on a reasonable basis the information discussed in this material, there may be
regulatory, compliance, or other reasons that prevent us from doing so.
This document is being supplied to you solely for your information, and its contents, information or data may not be reproduced,
redistributed or passed on, directly or indirectly.
Neither Angel Broking Pvt. Limited, nor its directors, employees or affiliates shall be liable for any loss or damage that may arise from
or in connection with the use of this information.
Disclosure of Interest Statement
HDFC Bank
1. Financial interest of research analyst or Angel or his Associate or his relative
No
2. Ownership of 1% or more of the stock by research analyst or Angel or associates or relatives
No
3. Served as an officer, director or employee of the company covered under Research
No
4. Broking relationship with company covered under Research
No
Ratings (Based on expected returns
Buy (> 15%)
Accumulate (5% to 15%)
Neutral (-5 to 5%)
over 12 months investment period):
Reduce (-5% to -15%)
Sell (< -15)
April 24, 2017
9