3QFY2016 Result Update | Banking
January 27, 2016
HDFC Bank
BUY
CMP
`1,040
Performance Highlights
Target Price
`1,262
Particulars (` cr)
3QFY16 2QFY16
% chg (qoq) 3QFY15
% chg (yoy)
Investment Period
12 Months
NII
7,069
6,681
5.8
5,700
24.0
Pre-prov. profit
5,736
5,043
13.7
4,779
20.0
Stock Info
PAT
3,357
2,869
17.0
2,795
20.1
Sector
Banking
Source: Company, Angel Research
Market Cap (` cr)
2,62,230
HDFC Bank continued its trend of delivering consistent earnings performances.
Beta
0.9
For 3QFY2016, it registered a net profit growth of 20.1% yoy, which is in line with
52 Week High / Low
1,127/944
Avg. Daily Volume
13,17,817
our expectation.
Face Value (`)
2
Advances grow strongly; Asset quality top-notch
BSE Sensex
24,486
During 3QFY2016, the loan book grew at a rapid pace, ie by 25.7% yoy. Retail
Nifty
7,436
growth picked further traction; the growth in the retail book was at 30.4% yoy,
Reuters Code
HDBK.BO
Bloomberg Code
HDFCB@IN
which took the total contribution of retail as a proportion of total advances book
to 49%. Corporate credit growth rate, at 20.7% yoy, stood well above that of the
industry.
Shareholding Pattern (%)
Current and Savings account deposits continued with their momentum, registering
Promoters
21.5
a spurt of 29.7% yoy and 20.6% yoy respectively leading to a qoq push in the
MF / Banks / Indian Fls
43.6
CASA ratio to 40.0%. Fixed deposits grew at 28.5% yoy, faster than the growth in
FII / NRIs / OCBs
18.7
the total CASA deposits (at 23.7% yoy).
Indian Public / Others
16.2
The bank’s non-interest income (excluding treasury) grew by 12.1% yoy, while fee
income grew at 11.0% yoy. The NIM came in as a surprise at 4.29%.
The asset quality continued to remain healthy with the Gross NPA rate at 0.97%,
Abs. (%)
3m 1yr
3yr
increasing marginally by 6bp qoq in a challenging macro environment. The Net
Sensex
(10.5)
(16.4)
21.8
NPA ratio stood at 0.29% as against 0.25% in 2QFY2016. The Provision
HDFC Bank
(5.5)
(0.3)
56.5
Coverage Ratio (PCR) stood at 70.4% vs 72.9% in the sequential previous quarter.
Outlook and valuation: Credit and deposit growth beat the industry growth rate,
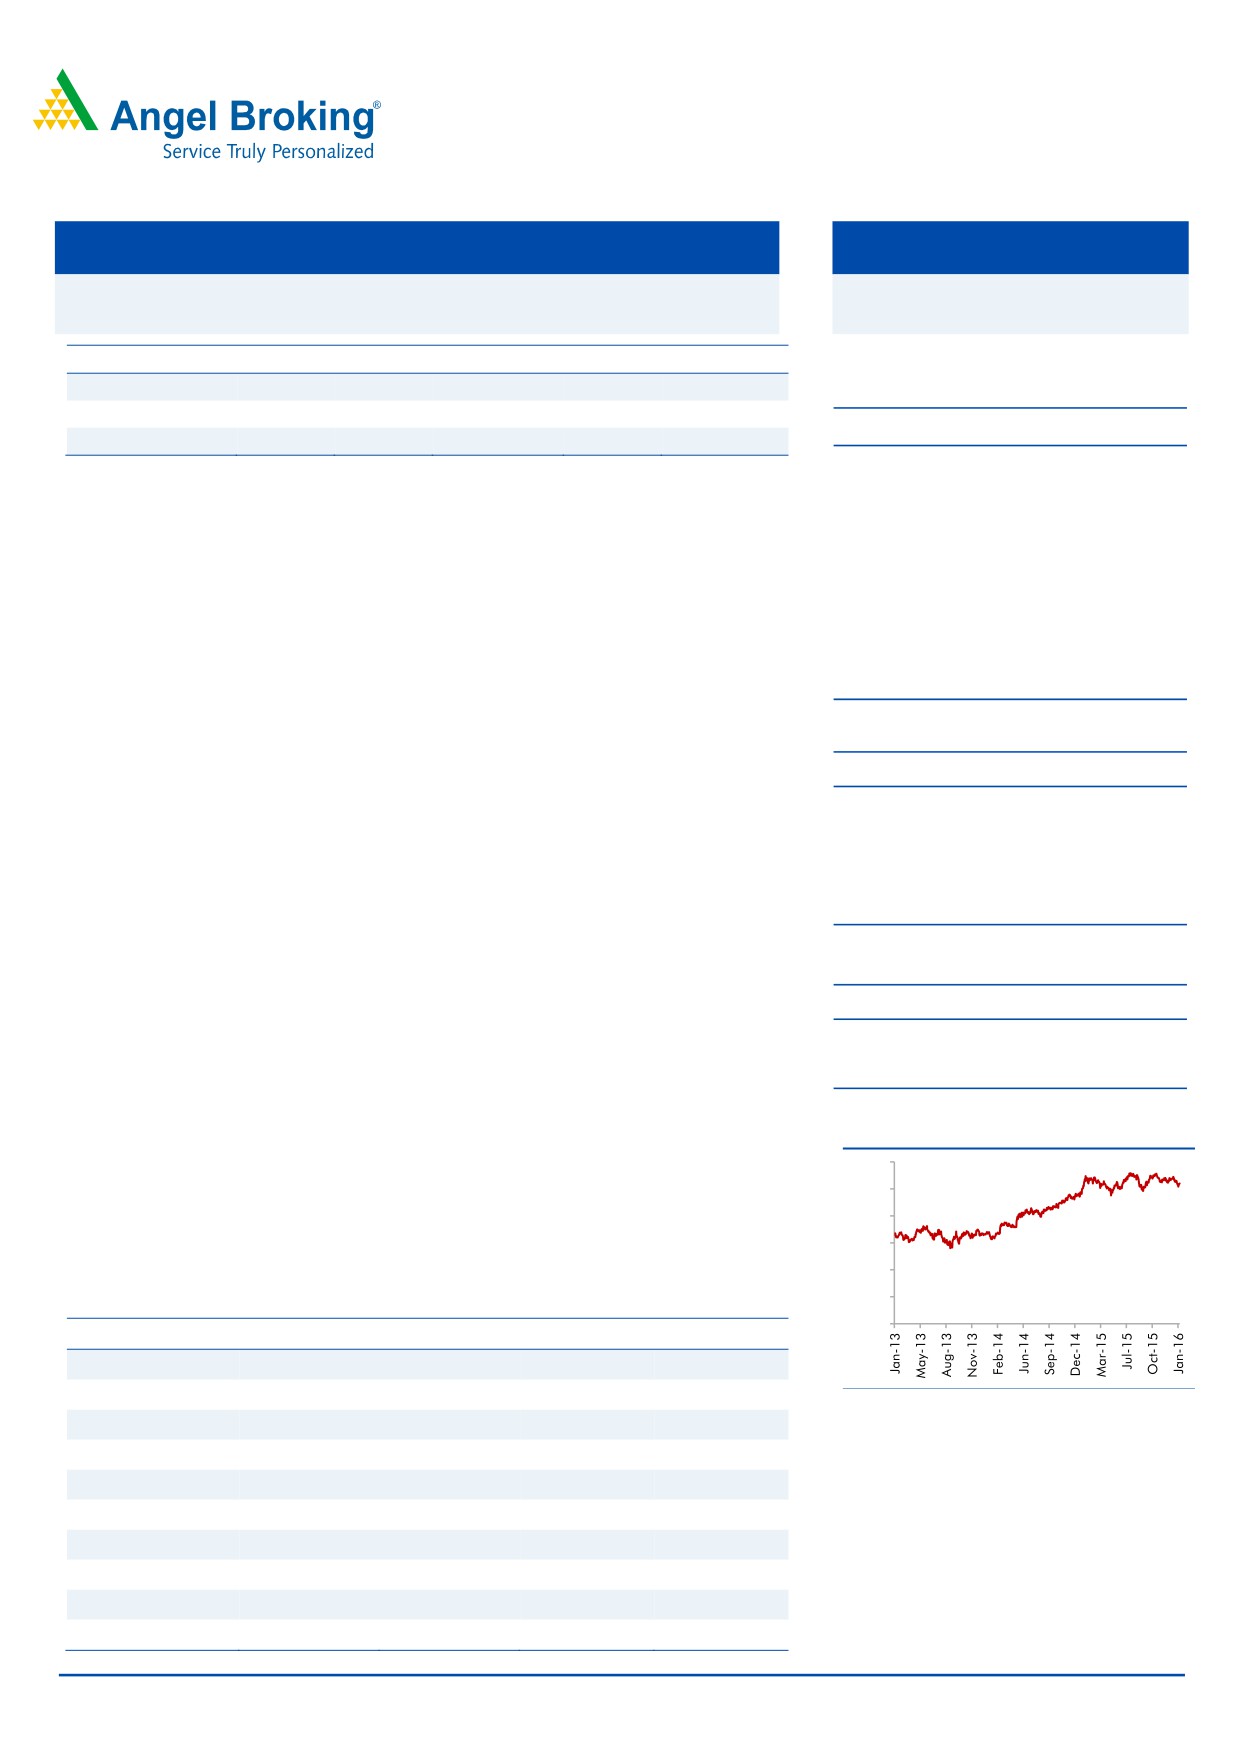
3-year price chart
driven by strong retail business, healthy CASA and continued network expansion.
1,200
This provides strong visibility for a robust 20% earnings trajectory, coupled with
1,000
high quality of earnings. This in our view justifies a premium valuation multiple. At
800
the current market price, the bank is trading at
3.1x FY2017E ABV. We
600
recommend a Buy rating on the stock, with a target price of `1,262.
400
200
Key financials (standalone)
0
Y/E March (` cr)
FY2014
FY2015
FY2016E
FY2017E
NII
18,483
22,396
27,415
33,929
% chg
16.9
21.2
22.4
23.8
Source: Company, Angel Research
Net profit
8,478
10,216
12,363
15,302
% chg
26.0
20.5
21.0
23.8
NIM (%)
4.4
4.3
4.3
4.3
EPS (`)
35.3
40.8
49.3
61.0
Vaibhav Agrawal
P/E (x)
29.4
25.5
21.1
17.0
022 - 3935 7800 Ext: 6808
P/ABV (x)
5.7
4.2
3.6
3.1
RoA (%)
1.9
1.9
1.9
1.9
Chintan Shah
RoE (%)
21.3
19.4
18.5
19.7
022 - 4000 3600 Ext: 6828
Source: Company, Angel Research; Note: CMP as of January 25, 2016
Please refer to important disclosures at the end of this report
1
HDFC Bank | 3QFY2016 Result Update
Exhibit 1: 3QFY2016 performance (standalone)
Particulars (` cr)
3QFY16
2QFY16
% chg (qoq)
3QFY15
% chg (yoy)
FY2015
FY2014
% chg
Interest earned
15,411
14,773
4.3
12,396
24.3
48,470
41,136
17.8
- on Advances / Bills
11,483
10,948
4.9
9,543
20.3
37,181
31,687
17.3
- on investments
3,651
3,398
7.5
2,696
35.5
10,277
9,037
13.7
- on balance with RBI & others
60
175
(66.0)
138
(56.9)
517
356
45.3
- on others
217
252
(13.9)
19
1,034.5
495
56
787.0
Interest Expended
8,343
8,092
3.1
6,696
24.6
26,074
22,653
15.1
Net Interest Income
7,069
6,681
5.8
5,700
24.0
22,396
18,483
21.2
Other income
2,872
2,552
12.6
2,535
13.3
8,996
7,920
13.6
Other income excl. treasury
2,544
2,389
6.5
2,269
12.1
8,415
7,809
7.8
- Fee & commission income
2,005
1,869
7.3
1,807
11.0
6,584
5,735
14.8
- Treasury income
328
162
101.9
266
23.5
582
110
426.9
- Forex & derivative income
277
320
(13.2)
253
9.5
1,028
1,401
(26.6)
Operating income
9,941
9,233
7.7
8,235
20.7
31,392
26,402
18.9
Operating expenses
4,205
4,190
0.4
3,456
21.7
13,988
12,042
16.2
- Employee expenses
1,431
1,414
1.2
1,133
26.4
4,751
4,179
13.7
- Other Opex
2,774
2,776
(0.1)
2,324
19.4
9,237
7,863
17.5
Pre-provision Profit
5,736
5,043
13.7
4,779
20.0
17,404
14,360
21.2
Provisions & Contingencies
654
681
(4.0)
560
16.7
2,076
1,588
30.7
PBT
5,082
4,362
16.5
4,218
20.5
15,329
12,772
20.0
Provision for Tax
1,725
1,492
15.6
1,424
21.2
5,113
4,294
19.1
PAT
3,357
2,869
17.0
2,795
20.1
10,216
8,478
20.5
Effective Tax Rate (%)
33.9
34.2
(26)bp
33.8
20bp
33.4
33.6
(26)bp
Source: Company, Angel Research
January 27, 2016
2
HDFC Bank | 3QFY2016 Result Update
Exhibit 2: 3QFY2016 performance analysis
Particulars
3QFY16
2QFY16
% chg (qoq) 3QFY15
% chg (yoy)
Balance sheet
Advances (` cr)
4,36,364
4,18,541
4.3
3,47,088
25.7
Deposits (` cr)
5,23,997
5,06,909
3.4
4,14,128
26.5
Credit-to-Deposit Ratio (%)
83.3
82.6
71bp
83.8
(54)bp
Current deposits (` cr)
74,044
69,811
6.1
57,105
29.7
Saving deposits (` cr)
1,35,432
1,31,522
3.0
1,12,284
20.6
CASA deposits (` cr)
2,09,476
2,01,333
4.0
1,69,389
23.7
CASA ratio (%)
40.0
39.7
26bp
40.9
(93)bp
CAR (%)
15.9
15.5
40bp
15.7
20bp
Tier 1 CAR (%)
13.2
12.8
40bp
12.0
123bp
Profitability Ratios (%)
Reported NIM
4.3
4.2
10bp
4.4
(10)bp
Cost-to-income ratio
42.3
45.4
(308)bp
42.0
33bp
Asset quality
Gross NPAs (` cr)
4,255
3,828
11.2
3,468
22.7
Gross NPAs (%)
0.97
0.91
6bp
1.0
(2)bp
Net NPAs (` cr)
1,261
1,038
21.5
904
39.5
Net NPAs (%)
0.3
0.3
4bp
0.3
3bp
Provision Coverage Ratio (%)
70.4
72.9
(252)bp
73.9
(357)bp
Source: Company, Angel Research
Advances growth above industry
During 3QFY2016, the loan book grew at a rapid pace, ie by 25.7% yoy. Retail
growth picked further traction; the growth in the retail book was at 30.4% yoy,
which took the total contribution of retail as a proportion of total advances book to
49%. Corporate credit growth rate, at 20.7% yoy, stood well above that of the
industry.
Current and Savings account deposits continued with their momentum, registering
a spurt of 29.7% yoy and 20.6% yoy respectively leading to a qoq push in the
CASA ratio to 40.0%. Fixed deposits grew at 28.5% yoy, faster than the growth in
the total CASA deposits (at 23.7% yoy).
Home loan advances rose by 42.3% yoy, witnessing the highest growth among
retail advances, followed by personal loans which grew by 41.4% yoy. The spurt in
home loan advances was mainly due to some pick-up in housing demand and
also on account of the bank taking a higher proportion of loan origination on its
own books from HDFC.
January 27, 2016
3
HDFC Bank | 3QFY2016 Result Update
Exhibit 3: Home loans/Personal loans aid Retail loan book growth
Particulars (` cr)
3QFY16
2QFY16
% chg (qoq) 3QFY15
% chg (yoy)
% to total
Auto Loans
49,755
46,009
8.1
40,014
24.3
23.2
CVCE
14,950
14,799
1.0
13,212
13.2
7.0
Two Wheelers
5,213
4,730
10.2
3,959
31.7
2.4
Personal Loans
35,071
31,881
10.0
24,804
41.4
16.3
Business Banking
26,936
27,288
(1.3)
21,340
26.2
12.5
Loans Against Secu.
1,129
1,078
4.7
1,194
(5.4)
0.5
Credit Cards
19,689
18,000
9.4
15,364
28.2
9.2
Home loans
28,419
28,483
(0.2)
19,977
42.3
13.2
Others
33,710
32,187
4.7
24,970
35.0
15.7
Retail Advances
2,14,872
2,04,455
5.1
1,64,834
30.4
100.0
Source: Company, Angel Research
NIM fairly strong at 4.3%: Non-interest income growth slows
down
The bank’s non-interest income (excluding treasury) grew by 12.1% yoy, while fee
income grew at 11.0% yoy. The NIM came in as a surprise at 4.29%.
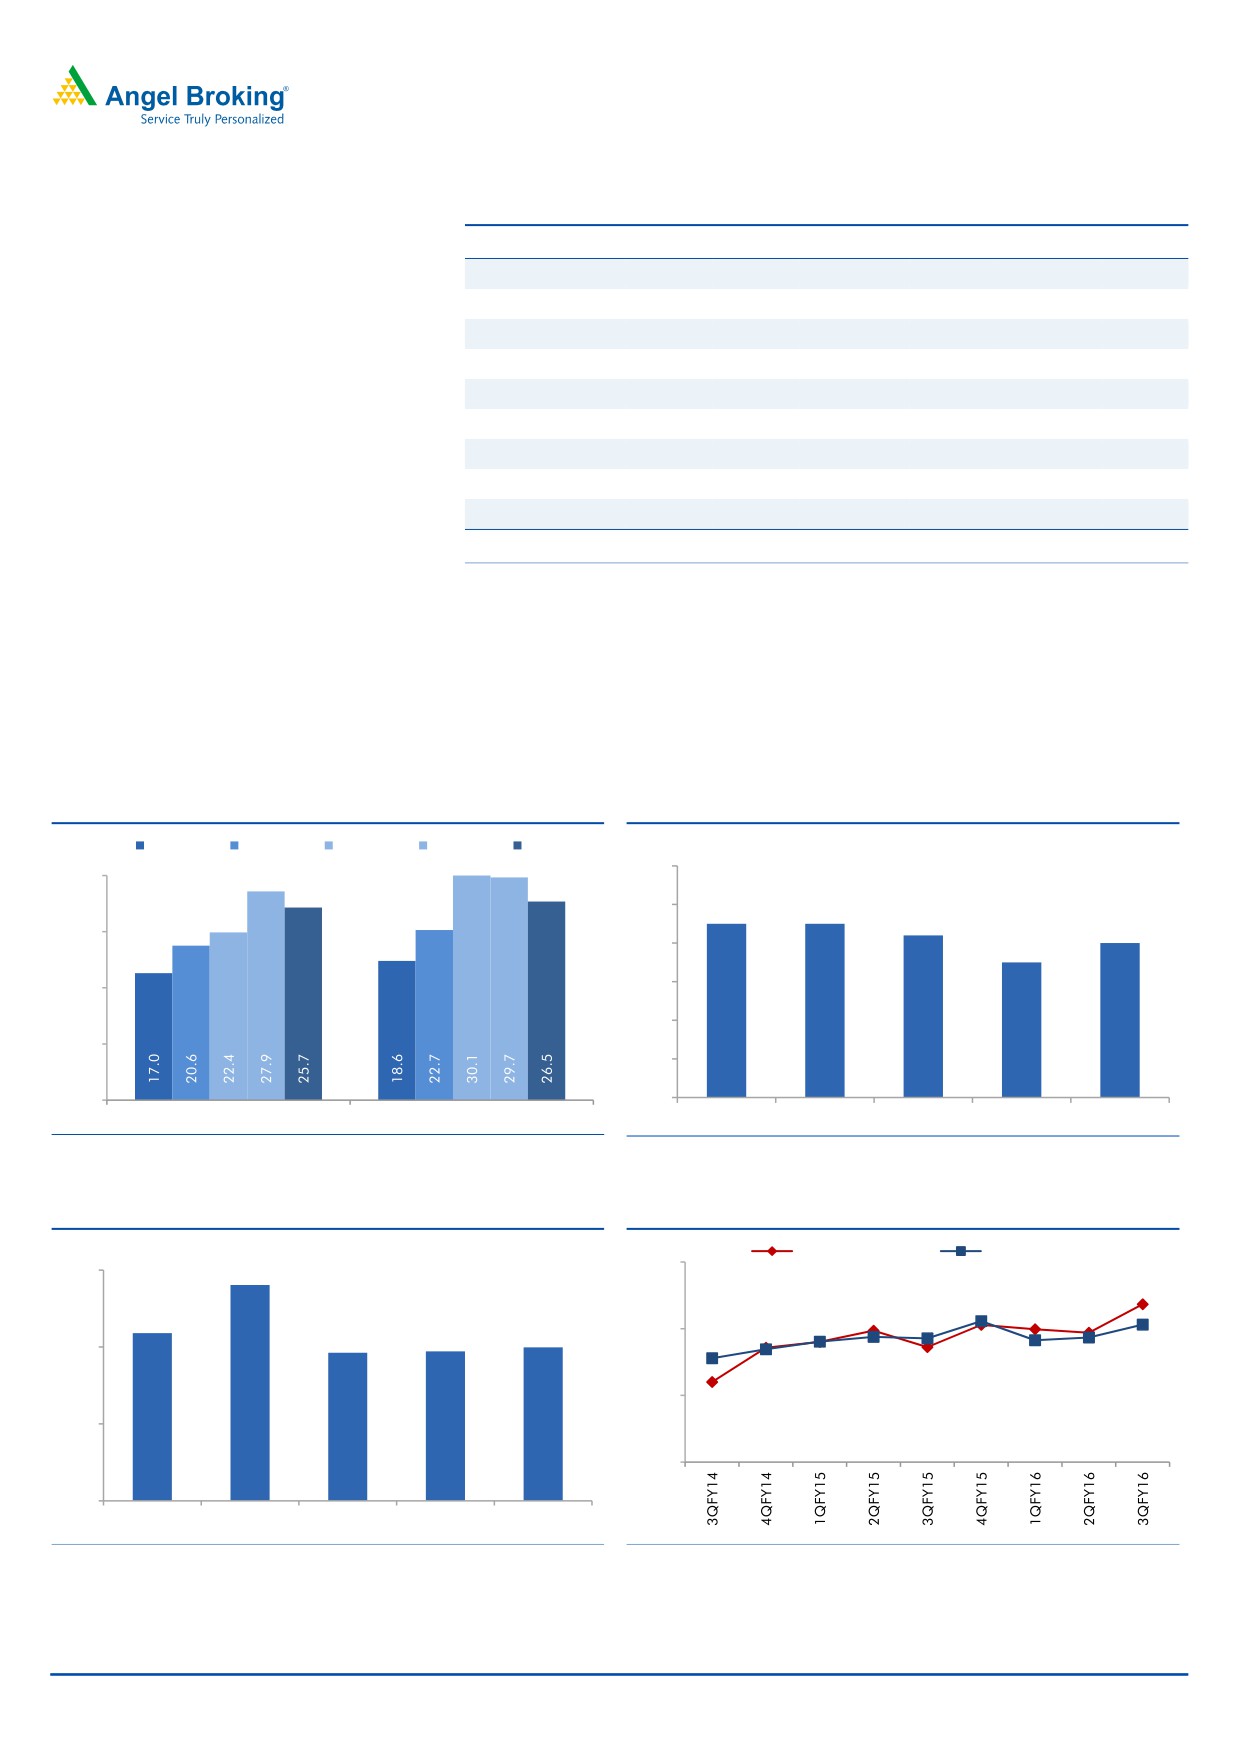
Exhibit 4: Advances growth above industry
Exhibit 5: Reported NIM at 4.3%
3QFY15
4QFY15
1QFY16
2QFY16
3QFY16
(%)
(%)
4.7
30.0
4.5
4.40
4.40
4.34
4.30
22.5
4.3
4.20
4.1
15.0
3.9
7.5
3.7
-
3.5
Advances
Deposits
3QFY15
4QFY15
1QFY16
2QFY16
3QFY16
Source: Company, Angel Research
Source: Company, Angel Research
Exhibit 6: CASA ratio increases marginally qoq
Exhibit 7: Trends in CASA growth
(%)
CASA growth (%)
SA growth (%)
30.0
45.0
44.0
23.7
40.9
40.0
20.0
39.6
39.7
15.6
40.0
20.6
10.0
12.0
35.0
-
30.0
3QFY15
4QFY15
1QFY16
2QFY16
3QFY16
Source: Company, Angel Research, Note: *adjusting for FCNR (B) deposits
Source: Company, Angel Research
January 27, 2016
4
HDFC Bank | 3QFY2016 Result Update
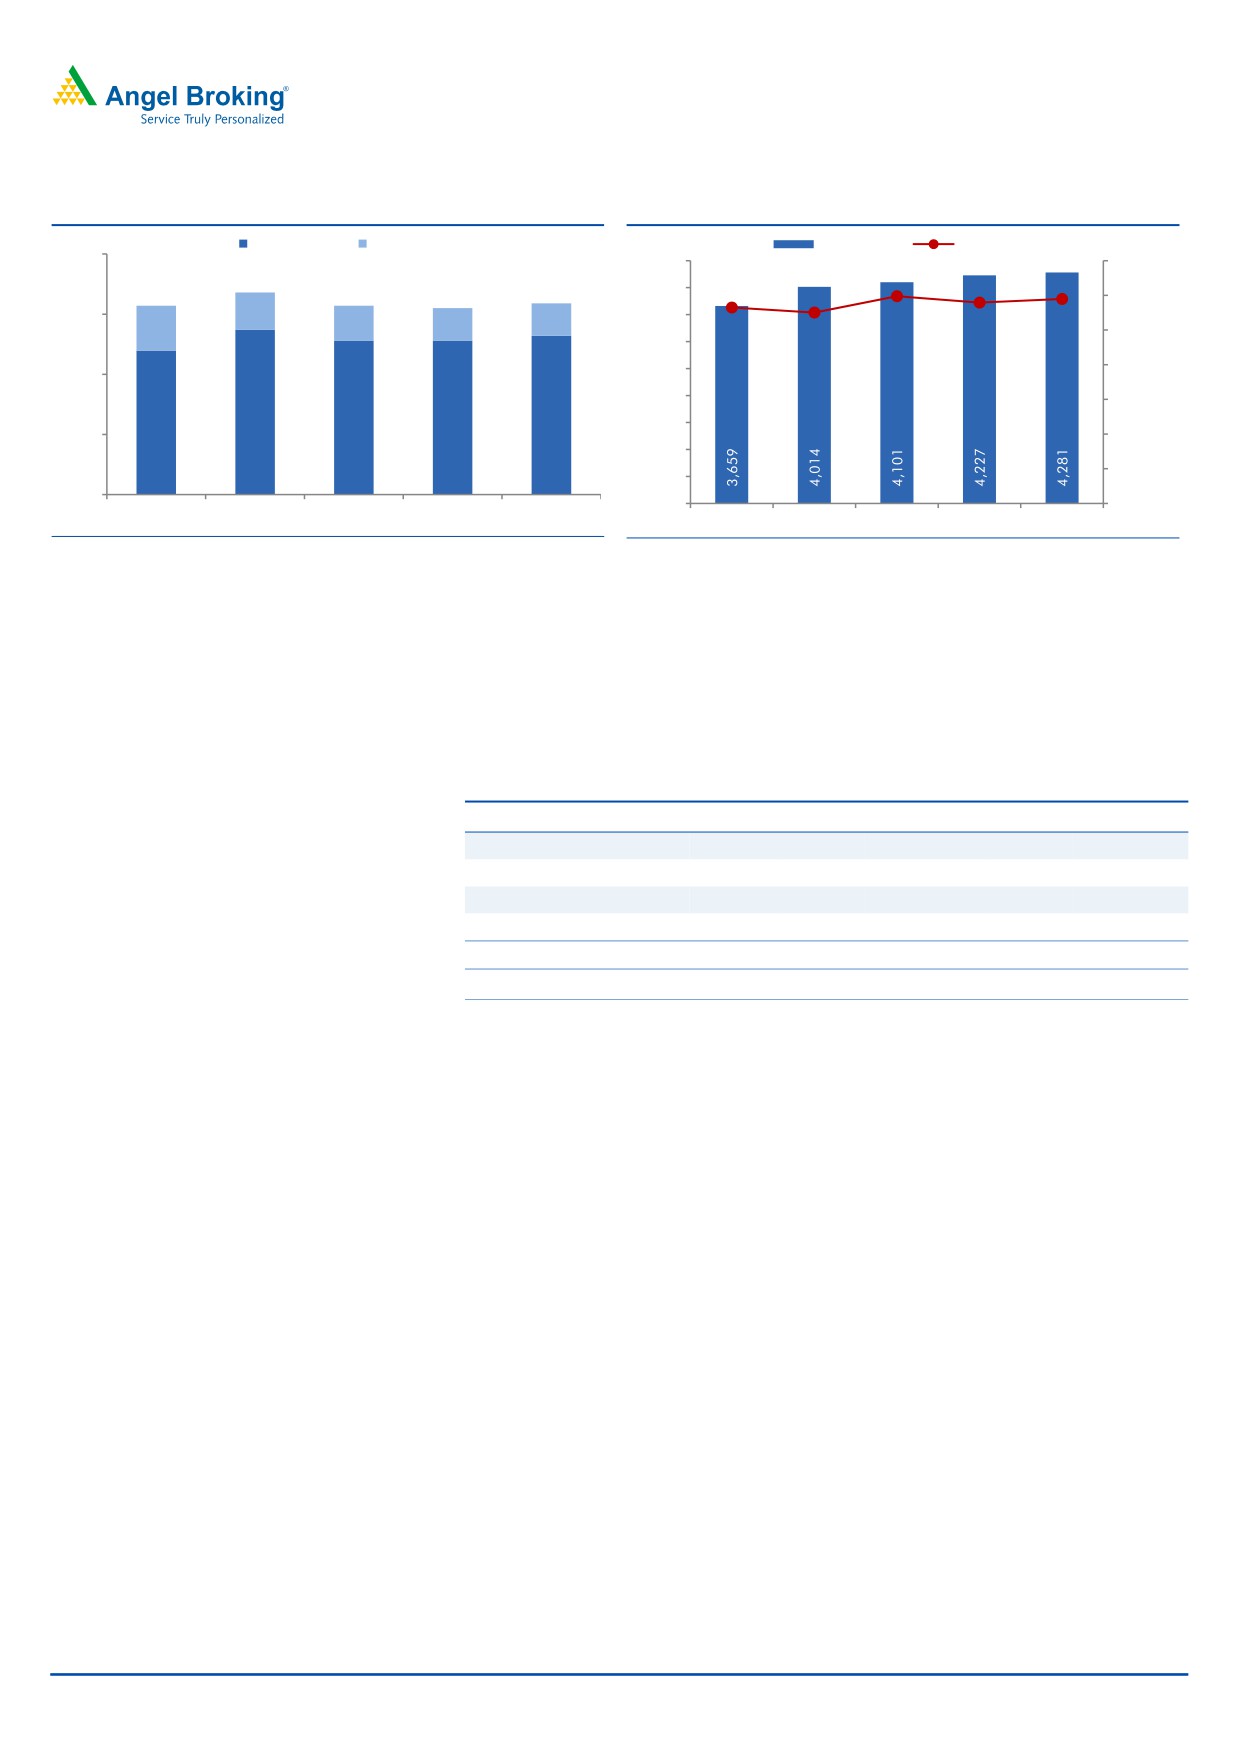
Exhibit 8: Capital adequacy remains healthy
Exhibit 9: Branch expansion continues
Tier-I CAR (%)
Tier-II CAR (%)
Branches
ATMs (RHS)
20.0
4,500
11,843
13,500
16.8
11,962
11,686
15.7
15.7
15.9
11,473
11,256
15.5
4,000
12,000
15.0
3.1
3,500
2.9
2.7
2.7
3.7
10,500
3,000
2,500
9,000
10.0
2,000
7,500
13.7
12.8
12.8
13.2
12.0
1,500
5.0
6,000
1,000
4,500
500
-
-
3,000
3QFY15
4QFY15
1QFY16
2QFY16
3QFY16
3QFY15
4QFY15
1QFY16
2QFY16
3QFY16
Source: Company, Angel Research Note *as per Basel III **including profits
Source: Company, Angel Research
Fee growth was sluggish on some slowdown in TPD fees owing to a change in the
mix of products and due to some regulatory changes like commission up-fronting.
Also, certain fees were waived off as a festive season incentive to customers, which
also impacted fee growth. Despite slow growth in other income, the cost to income
ratio was at 43.7%.
Exhibit 10: Non-interest income (excl. treasury)
Particulars (` cr)
3QFY16 2QFY16
% chg (qoq) 3QFY15
% chg (yoy)
Fees & Commission
2,005
1,869
7.3
1,807
11.0
Treasury Income
328
162
101.9
266
23.5
Forex Income & Others
277
320
(13.2)
253
9.5
Other
262
201
30.5
210
25.1
Other income
2,872
2,552
12.6
2,535
13.3
Other income excl. treasury
2,544
2,389
6.5
2,269
12.1
Source: Company, Angel Research
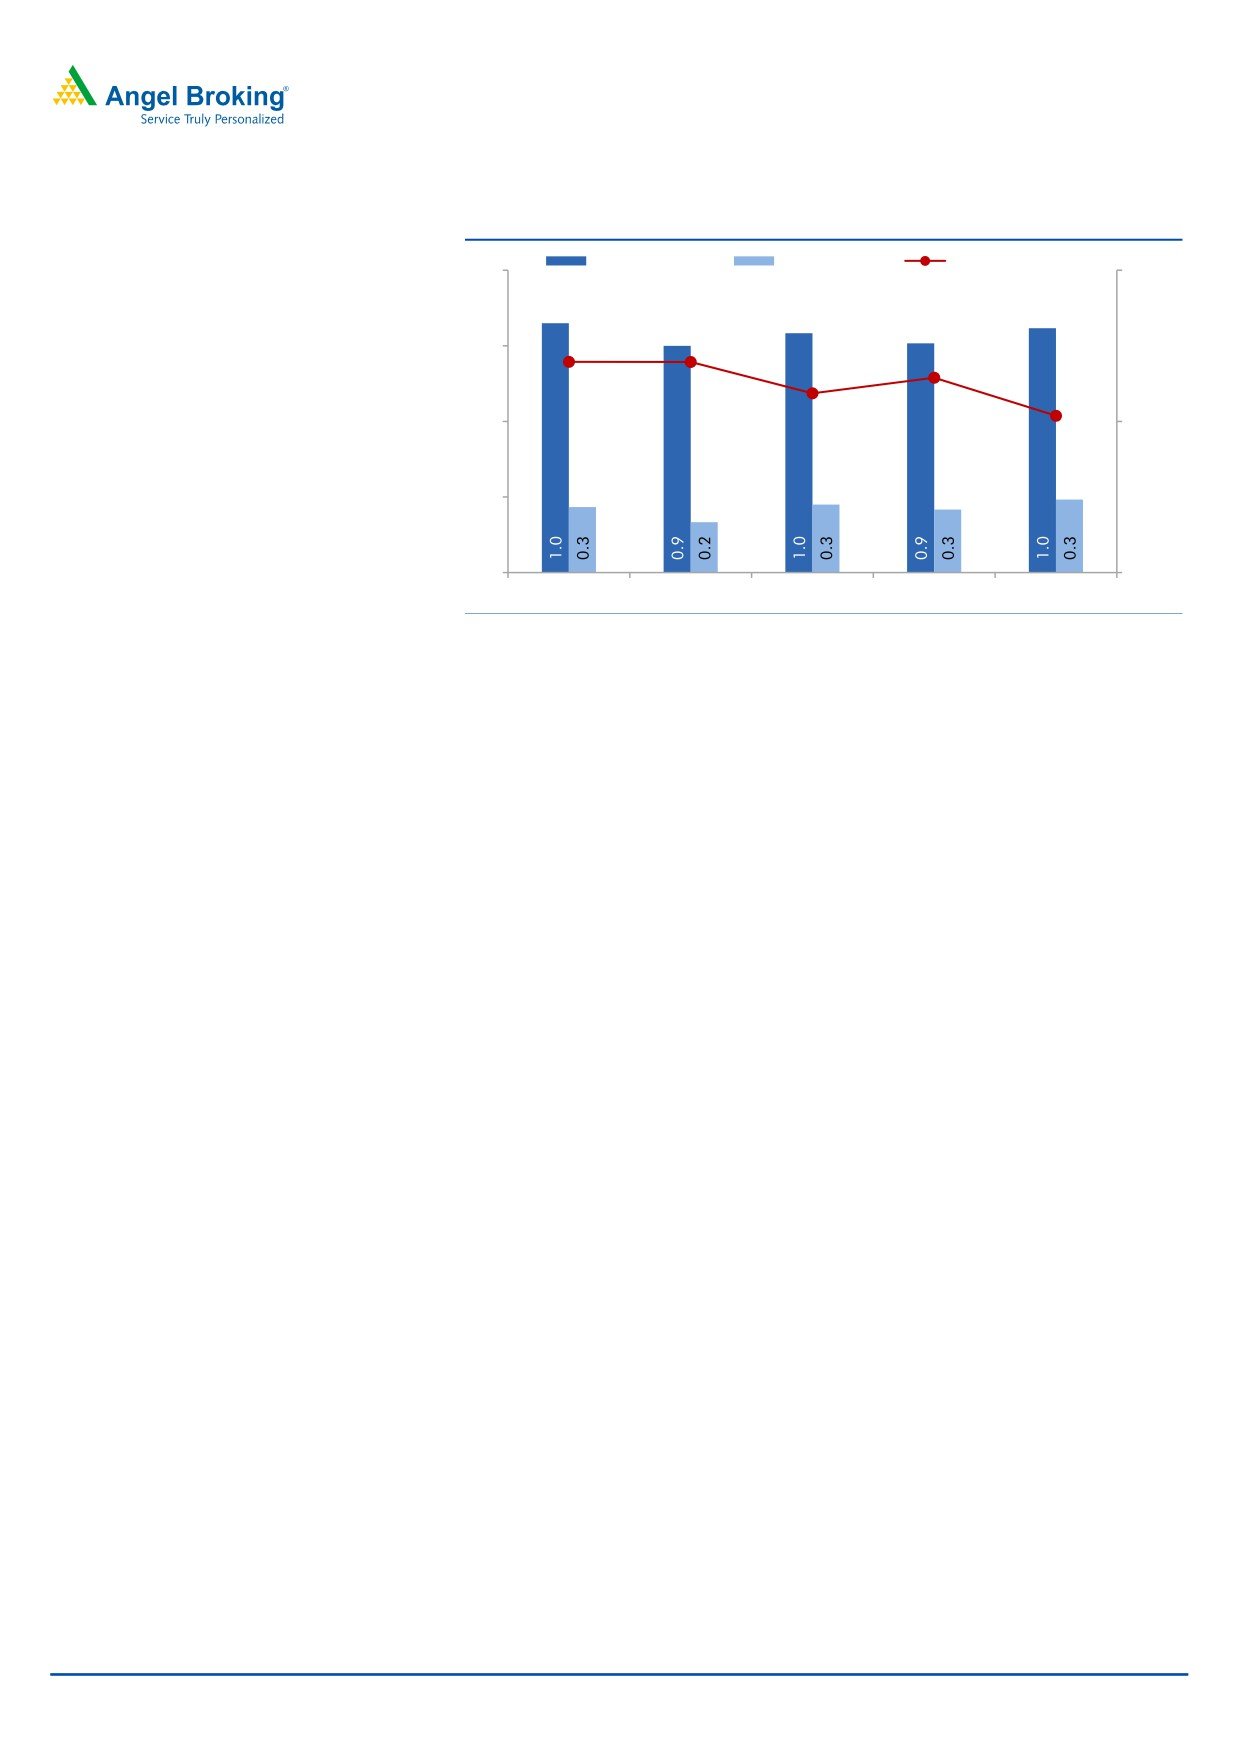
Asset quality remains top-notch
The asset quality continued to remain healthy with the Gross NPA rate at 0.97%,
increasing marginally by 6bp qoq in a challenging macro environment. The Net
NPA ratio stood at 0.29% as against 0.25% in 2QFY2016. The Provision Coverage
Ratio (PCR) stood at 70.4% vs 72.9% in the sequential previous quarter.
Total restructured loans were stable at 0.1% of gross advances as of December 31,
2015 (as against 0.1% as of December 31, 2014). Also, currently the bank does
not have any SDR asset or 5/25 refinancing.
January 27, 2016
5
HDFC Bank | 3QFY2016 Result Update
Exhibit 11: Asset quality remains top-notch
Gross NPAs (%)
Net NPAs (%)
PCR (Calc, %, RHS)
1.2
80.0
73.9
73.9
72.9
0.9
71.9
70.4
0.6
70.0
0.3
0.0
60.0
3QFY15
4QFY15
1QFY16
2QFY16
3QFY16
Source: Company, Angel Research
January 27, 2016
6
HDFC Bank | 3QFY2016 Result Update
Outlook & Valuation
We believe HDFC Bank is among the most competitive banks in the sector, with an
A-list Management at the helm of affairs, which has one of the best track records
in the industry. We believe the bank is well positioned for high qualitative growth,
with strong CAR, and top-notch asset quality. The bank’s credit and deposit growth
for the quarter under review was above industry (driven by strong retail business),
and enjoys healthy CASA. The bank is continuously expanding its branch network.
Credit and deposit growth beat the industry growth rate, driven by strong retail
business, healthy CASA and continued network expansion. This provides strong
visibility for a robust 20% earnings trajectory, coupled with high quality of
earnings. This in our view justifies a premium valuation multiple. At the current
market price, the bank is trading at 3.1x FY2017E ABV. We recommend a Buy
rating on the stock, with a target price of `1,262.
Exhibit 12: Recommendation summary
CMP
Tgt. Price
Upside
FY2017E
FY2017E
FY2017E
FY15-17E
FY2017E
FY2017E
Company
Reco.
(`)
(`)
(%)
P/ABV (x)
Tgt. P/ABV (x)
P/E (x)
EPS CAGR (%)
RoA (%)
RoE (%)
HDFCBk
Buy
1,040
1,262
21.4
3.1
3.8
17.0
22.4
1.9
19.7
ICICIBk*
Buy
236
304
28.7
1.6
1.7
9.7
13.4
1.6
14.7
YesBk
Buy
677
825
21.8
1.8
2.2
9.7
20.5
1.6
19.6
AxisBk
Buy
420
531
26.4
1.7
2.2
9.7
18.4
1.8
18.9
SBI*
Buy
183
237
29.3
0.9
1.0
7.5
17.8
0.7
12.7
FedBk
Neutral
47
-
-
0.9
0.9
8.5
(2.9)
0.9
10.8
SIB
Neutral
18
-
-
0.7
0.7
5.6
21.6
0.7
11.6
BOB
Neutral
130
-
-
0.7
0.7
6.1
17.5
0.6
10.6
PNB
Neutral
92
-
-
0.4
0.4
3.4
28.5
0.7
12.0
BOI
Neutral
100
-
-
0.3
0.7
3.0
14.0
0.3
7.6
IndBk
Neutral
93
-
-
0.3
0.3
3.1
19.4
0.6
8.6
Vijaya Bank
Neutral
32
-
-
0.4
0.3
4.8
14.1
0.4
8.8
OBC
Neutral
108
-
-
0.2
0.3
2.4
65.5
0.5
9.4
Allahabad BankNeutral
53
-
-
0.2
0.2
1.9
56.2
0.6
11.9
UnionBk
Neutral
119
-
-
0.3
0.3
3.0
18.1
0.6
11.4
CanBk
Neutral
184
-
-
0.3
0.2
2.6
12.0
0.6
11.2
IDBI#
Neutral
59
-
-
0.4
0.5
4.2
61.6
0.6
9.3
DenaBk
Neutral
36
-
-
0.3
0.4
3.5
45.6
0.4
7.9
Source: Company, Angel Research; Note:*Target multiples=SOTP Target Price/ABV (including subsidiaries), #Without adjusting for SASF
Company Background
HDFC Bank is the second-largest private sector bank in India with a pan-India
network of over 4,200 branches and nearly 11,800 ATMs. The bank is promoted
and 21.6% owned by HDFC, India's largest housing Finance Company. HDFC
Bank has been at the forefront of modern retail banking in India. The bank has
pioneered the transaction banking model in India, which has enabled it to garner
substantial CASA deposits as well as fee income, while the focus on retail lending
(which forms ~49% of total loans) has further helped the bank in consistently
maintaining above-industry margins.
January 27, 2016
7
HDFC Bank | 3QFY2016 Result Update
Income statement
Y/E March (` cr)
FY11
FY12
FY13
FY14
FY15
FY16E
FY17E
Net Interest Income
10,543
12,885
15,811
18,483
22,396
27,415
33,929
- YoY Growth (%)
25.7
22.2
22.7
16.9
21.2
22.4
23.8
Other Income
4,335
5,784
6,853
7,920
8,996
10,894
13,373
- YoY Growth (%)
8.8
33.4
18.5
15.6
13.6
21.1
22.8
Operating Income
14,878
18,668
22,664
26,402
31,392
38,309
47,302
- YoY Growth (%)
20.3
25.5
21.4
16.5
18.9
22.0
23.5
Operating Expenses
7,153
9,278
11,236
12,042
13,988
17,087
21,103
- YoY Growth (%)
20.4
29.7
21.1
7.2
16.2
22.2
23.5
Pre - Provision Profit
7,725
9,391
11,428
14,360
17,404
21,222
26,199
- YoY Growth (%)
20.2
21.6
21.7
25.7
21.2
21.9
23.5
Prov. & Cont.
1,907
1,877
1,677
1,588
2,076
2,315
2,799
- YoY Growth (%)
(10.9)
(1.5)
(10.7)
(5.3)
30.7
11.5
20.9
Profit Before Tax
5,819
7,513
9,751
12,772
15,329
18,906
23,400
- YoY Growth (%)
35.7
29.1
29.8
31.0
20.0
23.3
23.8
Prov. for Taxation
1,892
2,346
3,024
4,294
5,113
6,543
8,098
- as a % of PBT
32.5
31.2
31.0
33.6
33.4
34.6
34.6
PAT
3,926
5,167
6,726
8,478
10,216
12,363
15,302
- YoY Growth (%)
33.2
31.6
30.2
26.0
20.5
21.0
23.8
Balance sheet
Y/E March (` cr)
FY11
FY12
FY13
FY14
FY15
FY16E
FY17E
Share Capital
465
469
476
480
501
501
501
Reserves & Surplus
24,914
29,455
35,738
42,999
61,508
71,087
82,930
Deposits
2,08,586
2,46,706
2,96,247
3,67,337
4,50,796
5,63,495
7,04,368
- Growth (%)
24.6
18.3
20.1
24.0
22.7
25.0
25.0
Borrowings
7,447
13,250
16,963
23,395
29,571
36,354
44,864
Tier 2 Capital
6,947
10,597
16,044
16,044
15,642.80
15,252
14,870
Other Liab. & Prov.
28,993
37,432
34,864
41,344
32,484
40,401
49,750
Total Liabilities
2,77,353
3,37,910
4,00,332
4,91,600
5,90,503
7,27,090
8,97,284
Cash Balances
25,101
14,991
14,627
25,346
27,511
28,175
35,218
Bank Balances
4,568
5,947
12,653
14,238
8,821
14,542
17,946
Investments
70,929
97,483
1,11,614
1,20,951
1,66,460
2,03,919
2,48,657
Advances
1,59,983
1,95,420
2,39,721
3,03,000
3,65,495
4,53,214
5,61,985
- Growth (%)
27.1
22.2
22.7
26.4
20.6
24.0
24.0
Fixed Assets
2,171
2,347
2,703
3,028
3,122
3,728
4,463
Other Assets
14,601
21,722
19,014
25,036
19,095
23,512
29,015
Total Assets
2,77,353
3,37,910
4,00,332
4,91,600
5,90,503
7,27,090
8,97,284
- Growth (%)
24.7
21.8
18.5
22.8
20.1
23.1
23.4
January 27, 2016
8
HDFC Bank | 3QFY2016 Result Update
Ratio Analysis (standalone)
Y/E March
FY11
FY12
FY13 FY14
FY15
FY16E
FY17E
Profitability ratios (%)
NIMs
4.4
4.5
4.6
4.4
4.3
4.3
4.3
Cost to Income Ratio
48.1
49.7
49.6
45.6
44.6
44.6
44.6
RoA
1.6
1.7
1.8
1.9
1.9
1.9
1.9
RoE
16.7
18.7
20.3
21.3
19.4
18.5
19.7
B/S ratios (%)
CASA Ratio
52.7
48.4
47.4
44.8
44.0
42.6
41.9
Credit/Deposit Ratio
76.7
79.2
80.9
82.5
81.1
80.4
79.8
CAR
16.2
16.5
16.8
16.1
17.1
15.6
14.3
- Tier I
12.2
11.6
11.1
11.8
13.6
12.8
12.0
Asset Quality (%)
Gross NPAs
1.0
1.0
1.0
1.0
0.9
0.8
0.7
Net NPAs
0.2
0.2
0.2
0.3
0.2
0.2
0.2
Slippages
1.1
1.0
1.0
2.0
1.9
1.7
1.7
Loan Loss Prov. /Avg. Assets
0.3
0.4
0.3
0.4
0.4
0.3
0.3
Provision Coverage
82.5
82.3
79.3
73.6
73.9
73.4
70.3
Per Share Data (`)
EPS
16.9
22.0
28.3
35.3
40.8
49.3
61.0
ABVPS (75% cover.)
109.1
127.5
152.2
181.0
247.2
285.4
332.2
DPS
3.3
4.3
5.5
6.9
6.9
9.5
11.8
Valuation Ratios
PER (x)
61.6
47.2
36.8
29.4
25.5
21.1
17.0
P/ABVPS (x)
9.5
8.2
6.8
5.7
4.2
3.6
3.1
Dividend Yield
0.3
0.4
0.5
0.7
0.7
0.9
1.1
DuPont Analysis
NII
4.2
4.2
4.3
4.1
4.1
4.2
4.2
(-) Prov. Exp.
0.8
0.6
0.5
0.4
0.4
0.4
0.3
Adj. NII
3.5
3.6
3.8
3.8
3.8
3.8
3.8
Treasury
(0.0)
(0.0)
0.0
0.0
0.1
0.1
0.1
Int. Sens. Inc.
3.4
3.5
3.9
3.8
3.9
3.9
3.9
Other Inc.
1.8
1.9
1.8
1.8
1.5
1.5
1.5
Op. Inc.
5.2
5.5
5.7
5.6
5.4
5.5
5.5
Opex
2.9
3.0
3.0
2.7
2.6
2.6
2.6
PBT
2.3
2.4
2.6
2.9
2.8
2.9
2.9
Taxes
0.8
0.8
0.8
1.0
0.9
1.0
1.0
RoA
1.6
1.7
1.8
1.9
1.9
1.9
1.9
Leverage
10.7
11.1
11.2
11.2
10.3
9.9
10.5
RoE
16.7
18.7
20.3
21.3
19.4
18.5
19.7
Note: FY2013 onwards ratios reflect revised accounting practices
January 27, 2016
9
HDFC Bank | 3QFY2016 Result Update
Research Team Tel: 022 - 39357800
DISCLAIMER
Angel Broking Private Limited (hereinafter referred to as “Angel”) is a registered Member of National Stock Exchange of India Limited,
Bombay Stock Exchange Limited and Metropolitan Stock Exchange of India Limited. It is also registered as a Depository Participant with
CDSL and Portfolio Manager with SEBI. It also has registration with AMFI as a Mutual Fund Distributor. Angel Broking Private Limited is
a registered entity with SEBI for Research Analyst in terms of SEBI (Research Analyst) Regulations, 2014 vide registration number
INH000000164. Angel or its associates has not been debarred/ suspended by SEBI or any other regulatory authority for accessing
/dealing in securities Market. Angel or its associates including its relatives/analyst do not hold any financial interest/beneficial
ownership of more than 1% in the company covered by Analyst. Angel or its associates/analyst has not received any compensation /
managed or co-managed public offering of securities of the company covered by Analyst during the past twelve months. Angel/analyst
has not served as an officer, director or employee of company covered by Analyst and has not been engaged in market making activity
of the company covered by Analyst.
This document is solely for the personal information of the recipient, and must not be singularly used as the basis of any investment
decision. Nothing in this document should be construed as investment or financial advice. Each recipient of this document should
make such investigations as they deem necessary to arrive at an independent evaluation of an investment in the securities of the
companies referred to in this document (including the merits and risks involved), and should consult their own advisors to determine
the merits and risks of such an investment.
Reports based on technical and derivative analysis center on studying charts of a stock's price movement, outstanding positions and
trading volume, as opposed to focusing on a company's fundamentals and, as such, may not match with a report on a company's
fundamentals.
The information in this document has been printed on the basis of publicly available information, internal data and other reliable
sources believed to be true, but we do not represent that it is accurate or complete and it should not be relied on as such, as this
document is for general guidance only. Angel Broking Pvt. Limited or any of its affiliates/ group companies shall not be in any way
responsible for any loss or damage that may arise to any person from any inadvertent error in the information contained in this report.
Angel Broking Pvt. Limited has not independently verified all the information contained within this document. Accordingly, we cannot
testify, nor make any representation or warranty, express or implied, to the accuracy, contents or data contained within this document.
While Angel Broking Pvt. Limited endeavors to update on a reasonable basis the information discussed in this material, there may be
regulatory, compliance, or other reasons that prevent us from doing so.
This document is being supplied to you solely for your information, and its contents, information or data may not be reproduced,
redistributed or passed on, directly or indirectly.
Neither Angel Broking Pvt. Limited, nor its directors, employees or affiliates shall be liable for any loss or damage that may arise from
or in connection with the use of this information.
Note: Please refer to the important ‘Stock Holding Disclosure' report on the Angel website (Research Section). Also, please refer to the
latest update on respective stocks for the disclosure status in respect of those stocks. Angel Broking Pvt. Limited and its affiliates may
have investment positions in the stocks recommended in this report.
Disclosure of Interest Statement
HDFC Bank
1. Analyst ownership of the stock
No
2. Angel and its Group companies ownership of the stock
No
3. Angel and its Group companies' Directors ownership of the stock
No
4. Broking relationship with company covered
No
Note: We have not considered any Exposure below ` 1 lakh for Angel, its Group companies and Directors
Ratings (Based on expected returns
Buy (> 15%)
Accumulate (5% to 15%)
Neutral (-5 to 5%)
over 12 months investment period):
Reduce (-5% to -15%)
Sell (< -15)
January 27, 2016
10