3QFY2016 Result Update | IT
May 17, 2016
HCL Technologies
BUY
CMP
`722
Performance Highlights
Target Price
`1,000
(` cr) - Consl.
3QFY16 2QFY16
% chg (qoq) 3QFY15
% chg (yoy)
Investment Period
12 Months
Net revenue
10,698
10,341
3.4
9,267
15.4
EBIT
2,222
2,072
7.2
1,978
12.3
Stock Info
Adj. EBITDA margin (%)
20.8
20.6
73bp
21.3
(57)bp
Sector
IT
PAT
1,925
1,920
0.3
1,683
14.4
Market Cap (` cr)
101,878
Source: Company, Angel Research
Net Debt (` cr)
(101,878)
After this quarter (3QFY2016), the company has migrated to March year-ending.
Beta
0.7
For 3QFY2016, HCL Technologies (HCL Tech) posted lower than expected
52 Week High / Low
1,048/707
numbers on the top-line as well as the bottom-line front. It reported a top-line
Avg. Daily Volume
144,915
growth of 1.3% QoQ to US$1,587mn V/s US$1,607mn expected. In constant
Face Value (`)
2
currency (CC) terms, the growth was of 1.7% QoQ. On the operating front, the
BSE Sensex
25,490
EBIT margin came in at 20.8%, in line with our expectations. The net profit came
Nifty
7,815
in flat on a QoQ basis at `1,926cr (V/s `1,936cr expected). On the operational
Reuters Code
HCLT.BO
front, the utilization level moved up to 85.6% V/s 84.7% in 2QFY2016, while the
Bloomberg Code
HCLT@IN
attrition rate for IT services came in at 17.3% V/s 16.7% in 2QFY2016. We
maintain our Buy recommendation on the stock with a price target of `1,000.
Shareholding Pattern (%)
Quarterly highlights: The company posted a 1.3% QoQ growth for the quarter to
Promoters
60.4
US$1,587mn (V/s US$1,607mn expected). In rupee terms, the company posted a
MF / Banks / Indian Fls
8.8
sales growth of 3.4% QoQ to `10,698cr (V/s `10,850cr expected) while in CC
FII / NRIs / OCBs
27.5
terms the growth was of 1.7% QoQ. In terms of geographies, the company
Indian Public / Others
3.3
posted 3.7%, (2.4)% and 1.3% QoQ growth in USA, Europe and ROW in CC
terms respectively. In terms of verticals, the company posted a QoQ CC growth of
-1.3%, 0.9%, 6.4%, 7.1%, -1.2%, 4.2% in Financial Services, Manufacturing, Life
Abs.(%)
3m
1yr
3yr
sciences & Healthcare, Public Services, Retail & CPG and Telecommunications,
Sensex
10.9
(5.2)
29.4
Media, Publishing & Entertainment (MPE) respectively. On the operating front, the
HCL Tech
(9.5)
(21.1)
90.7
EBIT margin came in at 20.8%, in line with our expectation. The net profit grew
0.3% QoQ to `1,926cr (V/s `1,936cr expected).
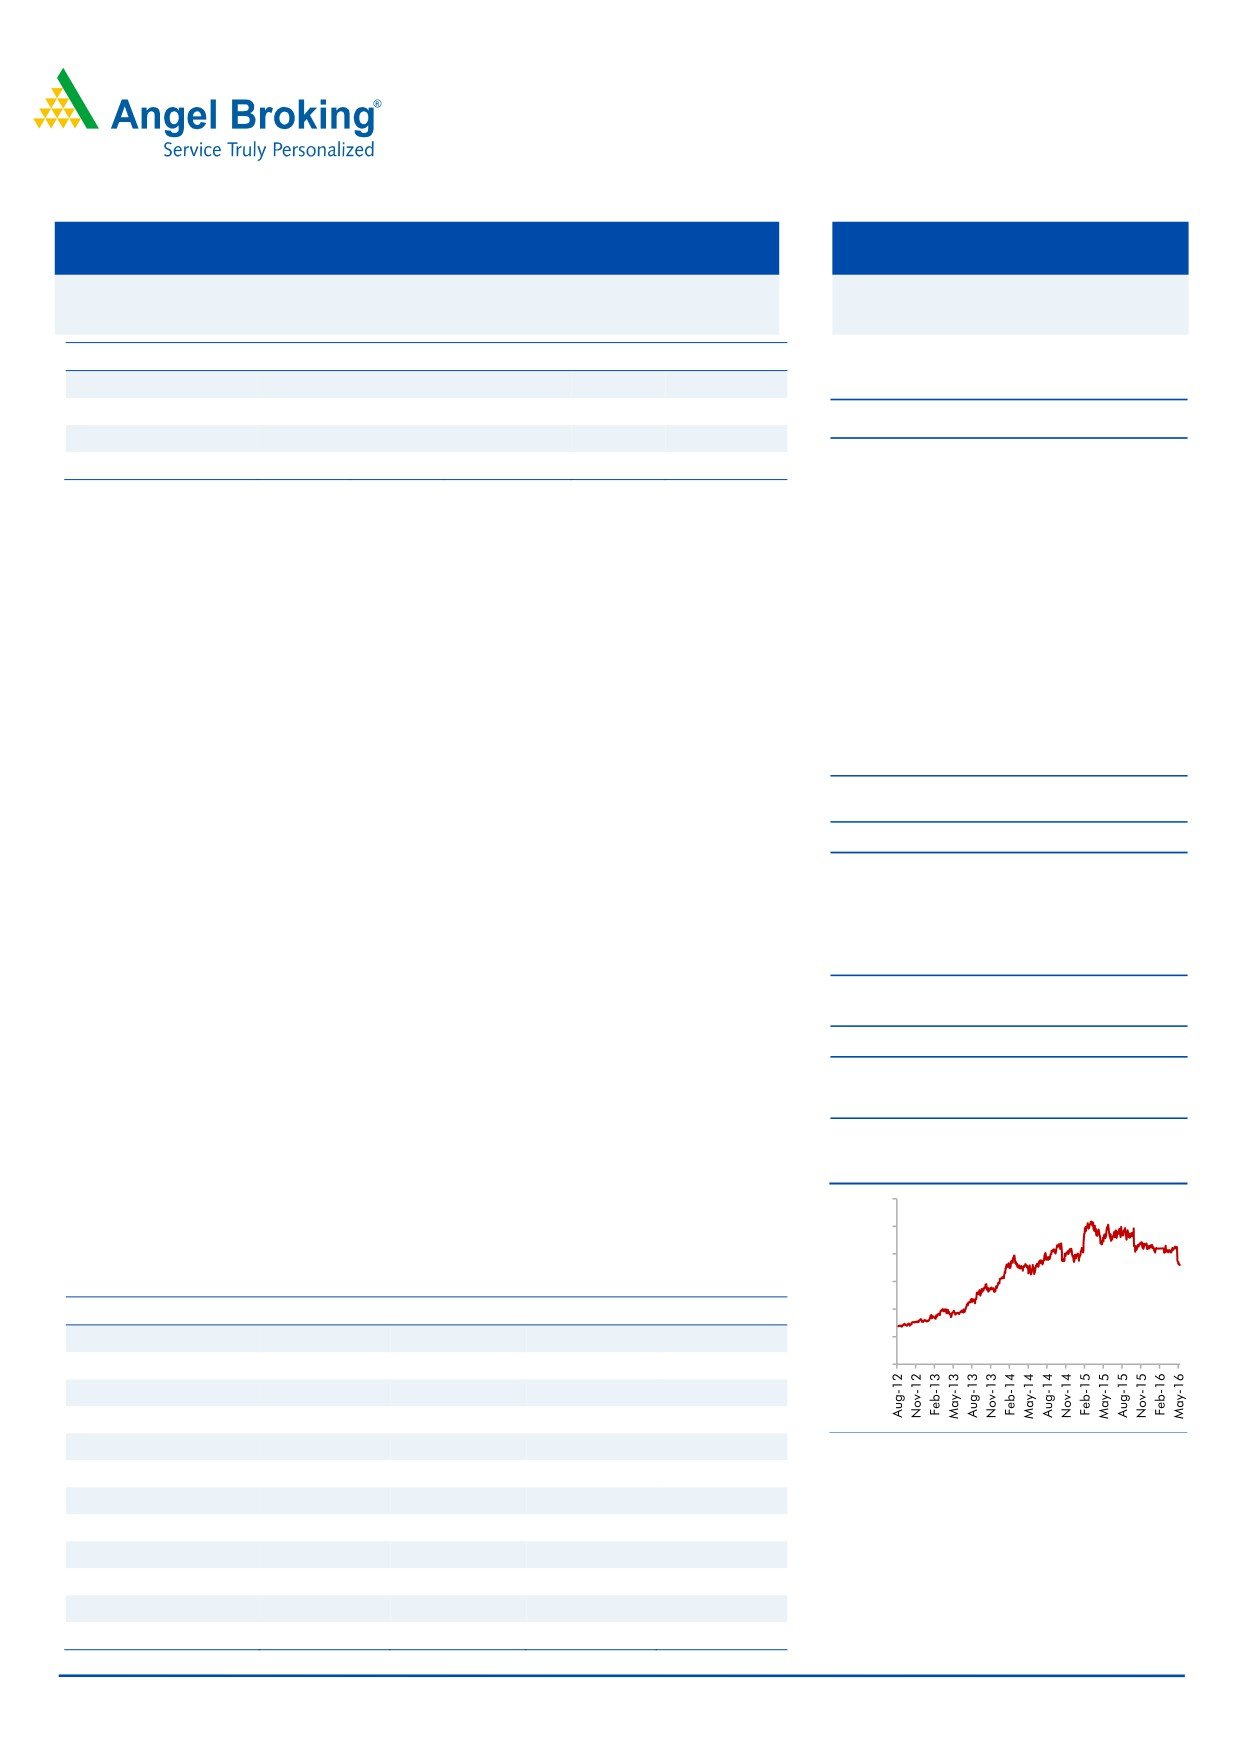
3-year price chart
Outlook and valuation: We expect HCL Tech to post a USD and INR revenue
1,200.0
CAGR of 12.5% and 15.5%, respectively, over FY2015-18E. On back of strong
1,000.0
order book and given the attractive valuations, we recommend a Buy on the stock.
800.0
Key financials (Consolidated, US GAAP)
600.0
Y/E March (` cr)
FY2015
FY2016
FY2017E
FY2018E
400.0
Net sales
37,061
30,781
49,242
57,168
200.0
% chg
12.6
(16.9)
60.0
16.1
0.0
Net profit
7,253
5,643
7,862
9,037
% chg
17.2
(22.2)
39.3
14.9
EBITDA margin (%)
23.5
21.5
20.5
20.5
Source: Company, Angel Research
EPS (`)
51.4
40.0
55.7
64.1
P/E (x)
14.0
18.0
12.9
11.2
P/BV (x)
4.1
3.6
2.6
2.0
RoE (%)
29.3
20.1
20.3
17.9
RoCE (%)
23.1
15.6
17.2
15.9
Sarabjit kour Nangra
EV/Sales (x)
2.4
2.9
1.6
1.2
+91 22 3935 7800 Ext: 6806
EV/EBITDA (x)
10.4
13.7
7.7
5.6
Source: Company, Angel Research; Note: CMP as of May 13, 2016
Please refer to important disclosures at the end of this report
1
HCL Technologies | 3QFY2016 Result Update
Exhibit 1: 3QFY2016 performance (Consolidated, US GAAP)
Y/E March (` cr)
3QFY16
2QFY16
% chg (qoq)
3QFY15
% chg (yoy)
FY16
FY15
% chg(yoy)
Net revenue
10,698
10,341
3.4
9,267
15.4
40,913
35,708
14.6
Cost of revenue
6,961
6,768
2.9
5,997
16.1
26,901
22,583
19.1
Gross profit
3,737
3,573
4.6
3,270
14.3
14,012
13,125
6.8
SG&A expense
1,358
1,348
0.7
1,179
15.2
5,217
4,308
21.1
EBITDA
2,378
2,225
6.9
2,091
13.7
8,795
8,817
(0.2)
Dep. and amortization
157
153
2.6
113
38.9
569
504
12.9
EBIT
2,222
2,072
7.2
1,978
12.3
8,226
8,313
(1.0)
Other income
200
355
(43.7)
179
11.7
1,009
856
PBT
2,422
2,427
(0.2)
2,157
12.3
9,235
9,169
0.7
Income tax
497
508
(2.2)
473
5.1
1,883
1,864
1.0
PAT
1,925
1,920
0.3
1,683
14.4
7,352
7,305
0.6
Forex gain/(loss)
-
0
-
-
-
-
-
Adjusted PAT
1,925
1,920
0.3
1,683
14.4
7,352
7,305
0.6
EPS
13.6
13.6
0.3
11.9
14.4
52.3
52.0
0.6
Gross margin (%)
34.9
34.6
38bp
35.3
(35)bp
34.2
36.8
(251)bp
EBITDA margin (%)
22.2
21.5
71bp
22.6
(34)bp
21.5
24.7
(320)bp
EBIT margin (%)
20.8
20.0
73bp
21.3
(57)bp
20.1
23.3
(317)bp
PAT margin (%)
18.0
18.6
(57)bp
18.2
(17)bp
18.0
20.5
(249)bp
Source: Company, Angel Research, Note-FY2016 is a 12month results for meaningful comparison, From FY2017, the company has become a March
ending company
Exhibit 2: 3QFY2016 - Actual Vs Angel estimates
(` cr)
Actual
Estimate
Variation (%)
Net revenue
10,698
10,850
(1.4)
EBITDA margin (%)
20.8
20.7
10bp
PAT
1,925
1,936
(0.6)
Source: Company, Angel Research
Sales lower than expected
The company posted a 1.3% QoQ growth for the quarter to US$1,587mn (V/s
US$1,607mn expected). In rupee terms, the company posted a sales growth of
3.5% QoQ to `10,698cr (V/s `10,850cr expected) while in CC terms the growth
was of 1.7% QoQ. In terms of geographies, the company posted 3.7 %,(2.4)% and
1.3% QoQ growth in USA, Europe and ROW in CC terms respectively. In terms of
verticals, the company posted a QoQ CC growth of (1.3%), 0.9%, 6.4%, 7.1%,
(1.2%),
4.2% in Financial Services, Manufacturing, Life sciences & Healthcare,
Public Services, Retail & CPG and Telecommunications, Media, Publishing &
Entertainment (MPE) respectively.
The company signed 7 transformational deals during the quarter with TCV of more
than US$2bn, taking the number of transformational engagements during the nine
month financial year to 25 with TCV of more than US$4bn. These wins were
broad-based across service lines and industry verticals, led by the company’s next-
generation offerings - BEYONDigital, IoT WoRKS and Next-Gen ITO.
May 17, 2016
2
HCL Technologies | 3QFY2016 Result Update
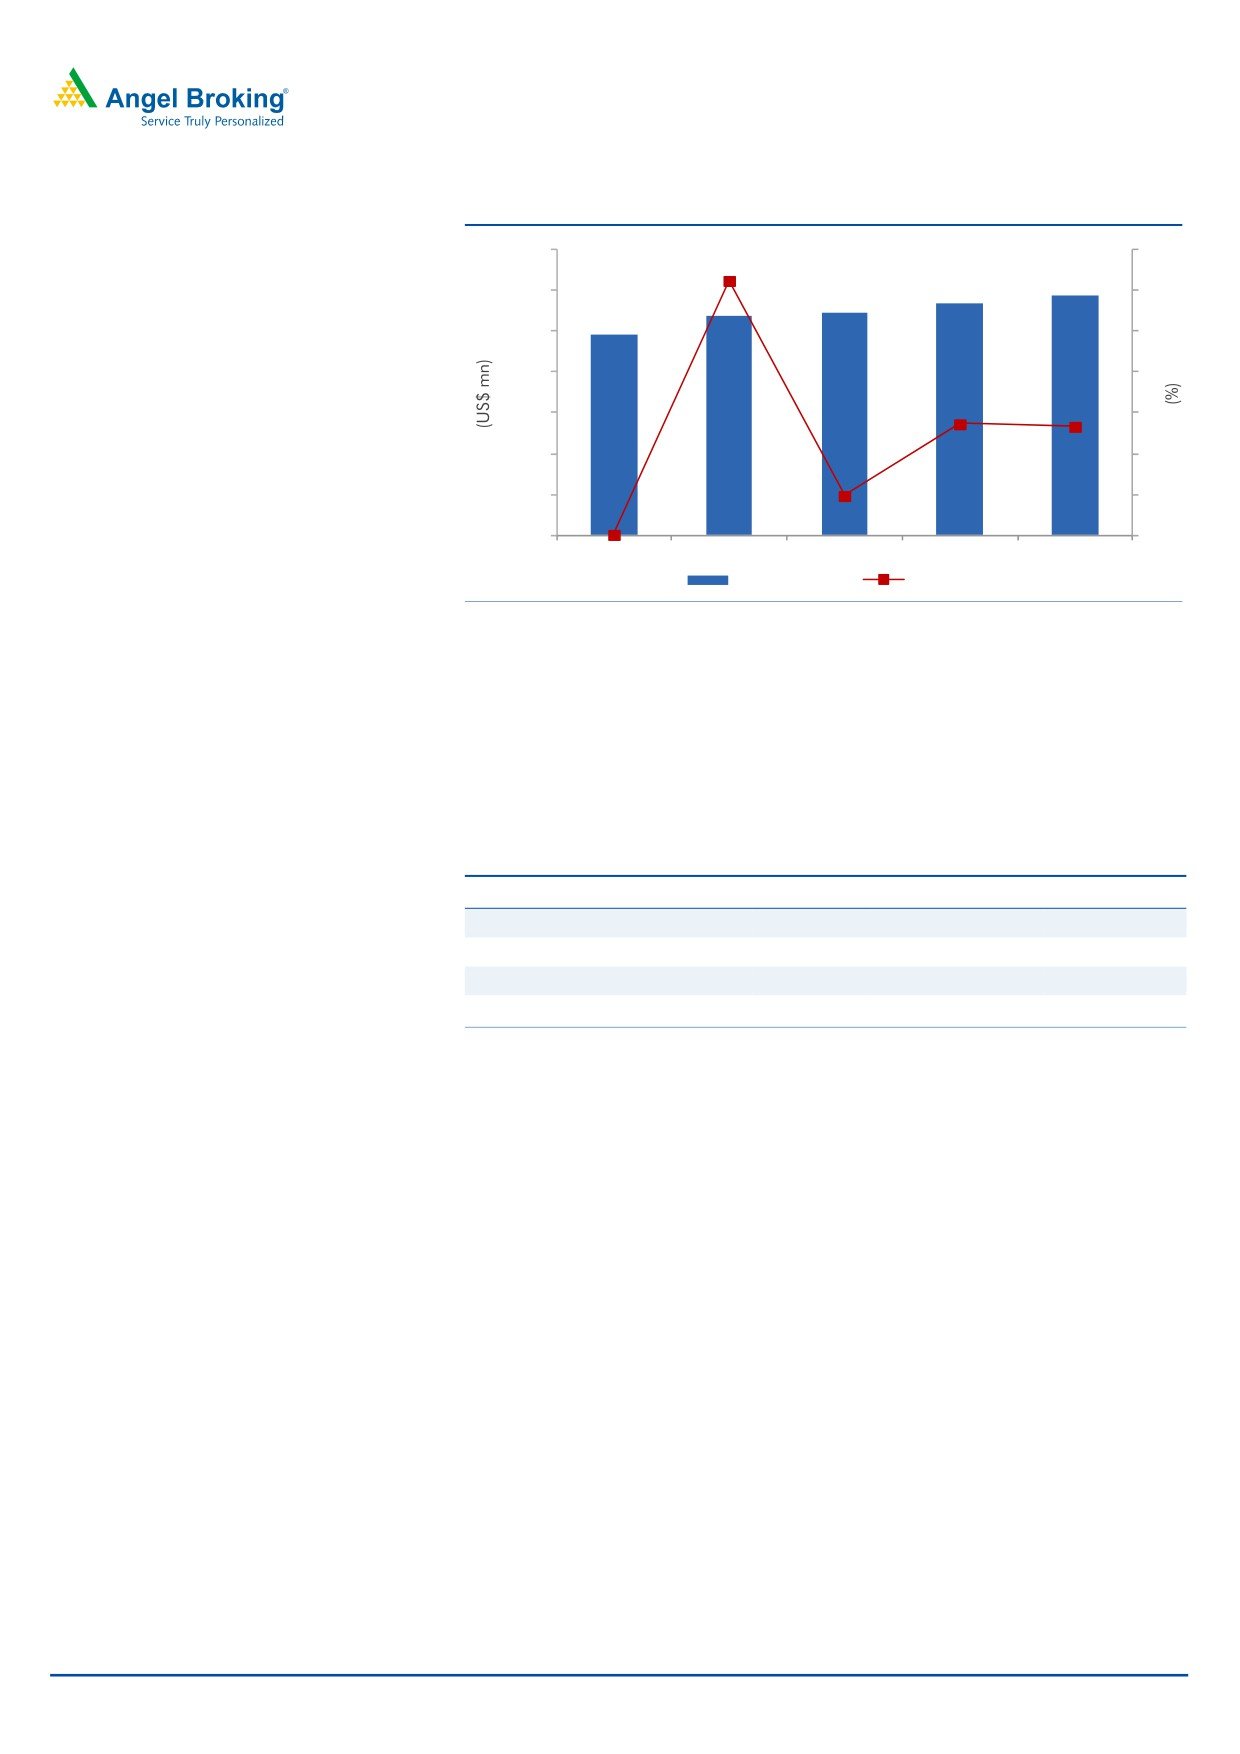
Exhibit 3: Revenue growth trend
1,700
4
3.1
1,600
3
1,500
3
1,400
2
1,300
2
1.4
1.3
1,200
1
1,100
0.5
1
1,491
1,538
1,545
1,566
1,587
1,000
0.0
0
3QFY15
4QFY15
1QFY2016
2QFY2016
3QFY16
Revenue (USD)
qoq growth (%)
Source: Company, Angel Research
In terms of services, the Engineering & R&D services (which constitute 18.6% of
sales) posted a growth
1.9% QoQ (CC), while Application services (which
constitute 40.4% of sales) grew by 0.5% QoQ in CC terms. Infrastructure services,
another important segment of the company, which contributes by around 18.6% to
overall sales, posted a growth of 3.9% QoQ. Business services, which constitute
5.5% of sales, de-grew by 4.1% QoQ on CC basis.
Exhibit 4: Revenue growth trend (Service wise)
% of revenue
% growth CC (qoq)
% growth (yoy)
Application services
40.4
0.5
4.0
Infrastructure services
18.6
3.9
14.0
Business services
5.5
(4.1)
10.1
Engineering and R&D services
18.6
1.9
5.9
Source: Company, Angel Research
Industry segment wise, the company’s Financial Services vertical (contributed
25.9% to revenue) posted a 1.3% QoQ de-growth in CC terms. The Manufacturing
vertical (contributed 31.5% to revenue) posted a 0.9% QoQ growth in CC terms.
Public services; Life sciences & Healthcare; and Telecommunication, Media,
Publishing & Entertainment reported a QoQ growth of 7.1%, 6.4%, and 4.2%, all
in CC terms, respectively. Retail & CPG (contributed 9.5% of the revenue) on the
other hand reported de-growth of 1.2% QoQ in revenue in CC terms, during the
quarter.
May 17, 2016
3
HCL Technologies | 3QFY2016 Result Update
Exhibit 5: Revenue growth trend (Industry wise)
% of revenue
% growth (CC qoq)
% growth (yoy)
Financial services
25.9
(1.3)
4.6
Manufacturing
31.5
0.9
1.1
Life sciences & Healthcare
12.2
6.4
22.6
Public Services
10.6
7.1
16.5
Retail & CPG
9.5
(1.2)
18.5
Telecom, MPE
9.7
4.2
19.2
Source: Company, Angel Research
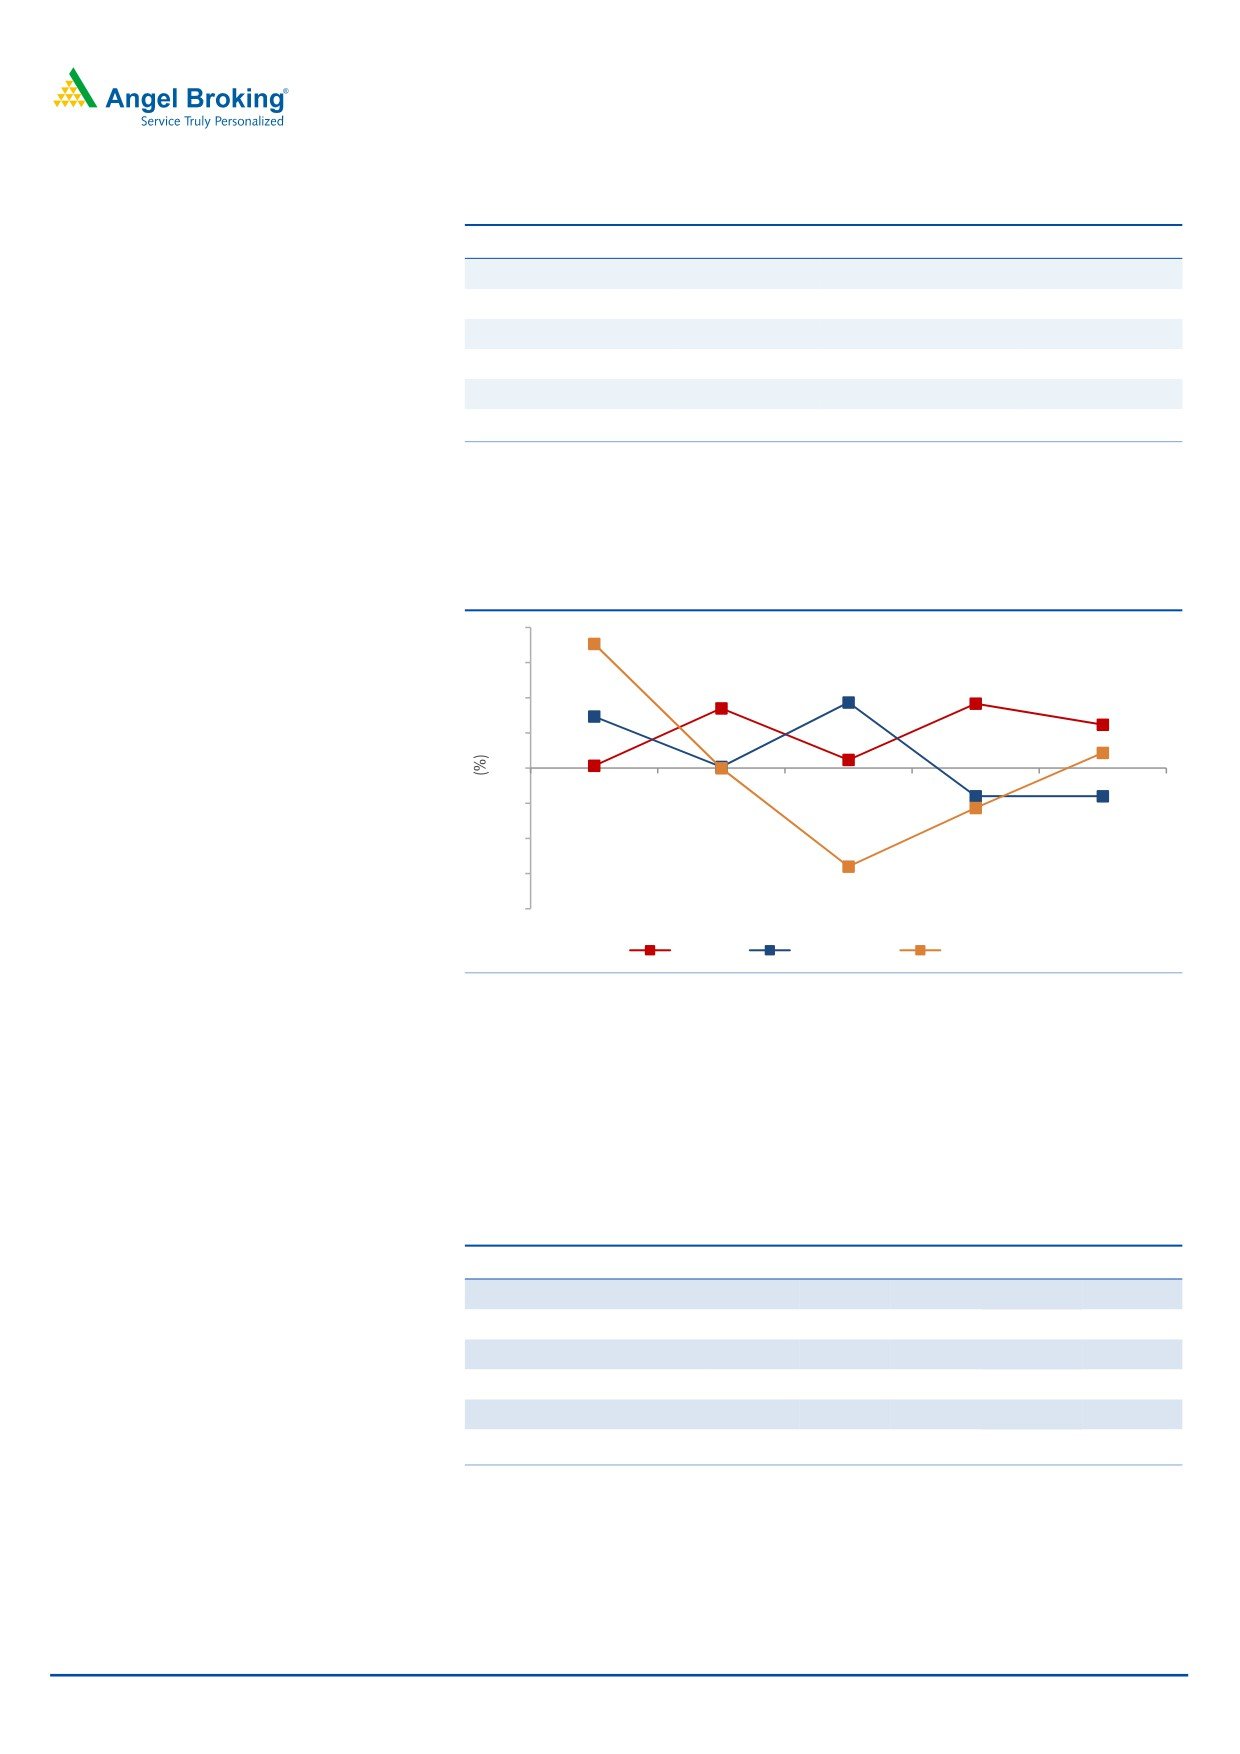
Among geographies, in CC terms, Americas grew by 3.7%, Europe de-grew by
2.4%, while RoW grew by 1.3% on a sequential basis.
Exhibit 6: Revenue growth trend (Geography wise in CC terms)
12
9
10.6
5.6
5.5
4.4
6
5.1
3.7
3
0.7
0.1
0
(0.0)
1.3)
0.2
(3.4)
(3)
(2.4)
(6)
(9)
(8.4)
(12)
3QFY15
4QFY15
1QFY2016
2QFY2016
3QFY16
US
Europe
Rest of the world
Source: Company, Angel Research
Hiring and utilization
During the quarter, the overall headcount of HCL Tech increased by 9,280 to
1,04,896 employees. The attrition rate in IT Services inched up to 17.3% V/s
16.7% in 2QFY2016. The blended utilization level of the company inched up to
85.6% V/s 84.7% in 2QFY2016.
Exhibit 7: Hiring trend
Particulars
3QFY15 4QFY15 1QFY16 2QFY16 3QFY16
Technical
95,190
97,135
96,541
94,652
95,649
Support
8,994
8,972
9,030
9,044
9,247
Total employee base
1,04,184
1,06,107
105,571
103,696
104,896
Gross addition
11,041
9,448
7,889
6,234
9,280
Net addition
3,944
1,923
(1559)
(1875)
1200
Attrition - IT services (LTM) - %
16.2
16.5
16.3
16.7
17.3
Source: Company, Angel Research
May 17, 2016
4
HCL Technologies | 3QFY2016 Result Update
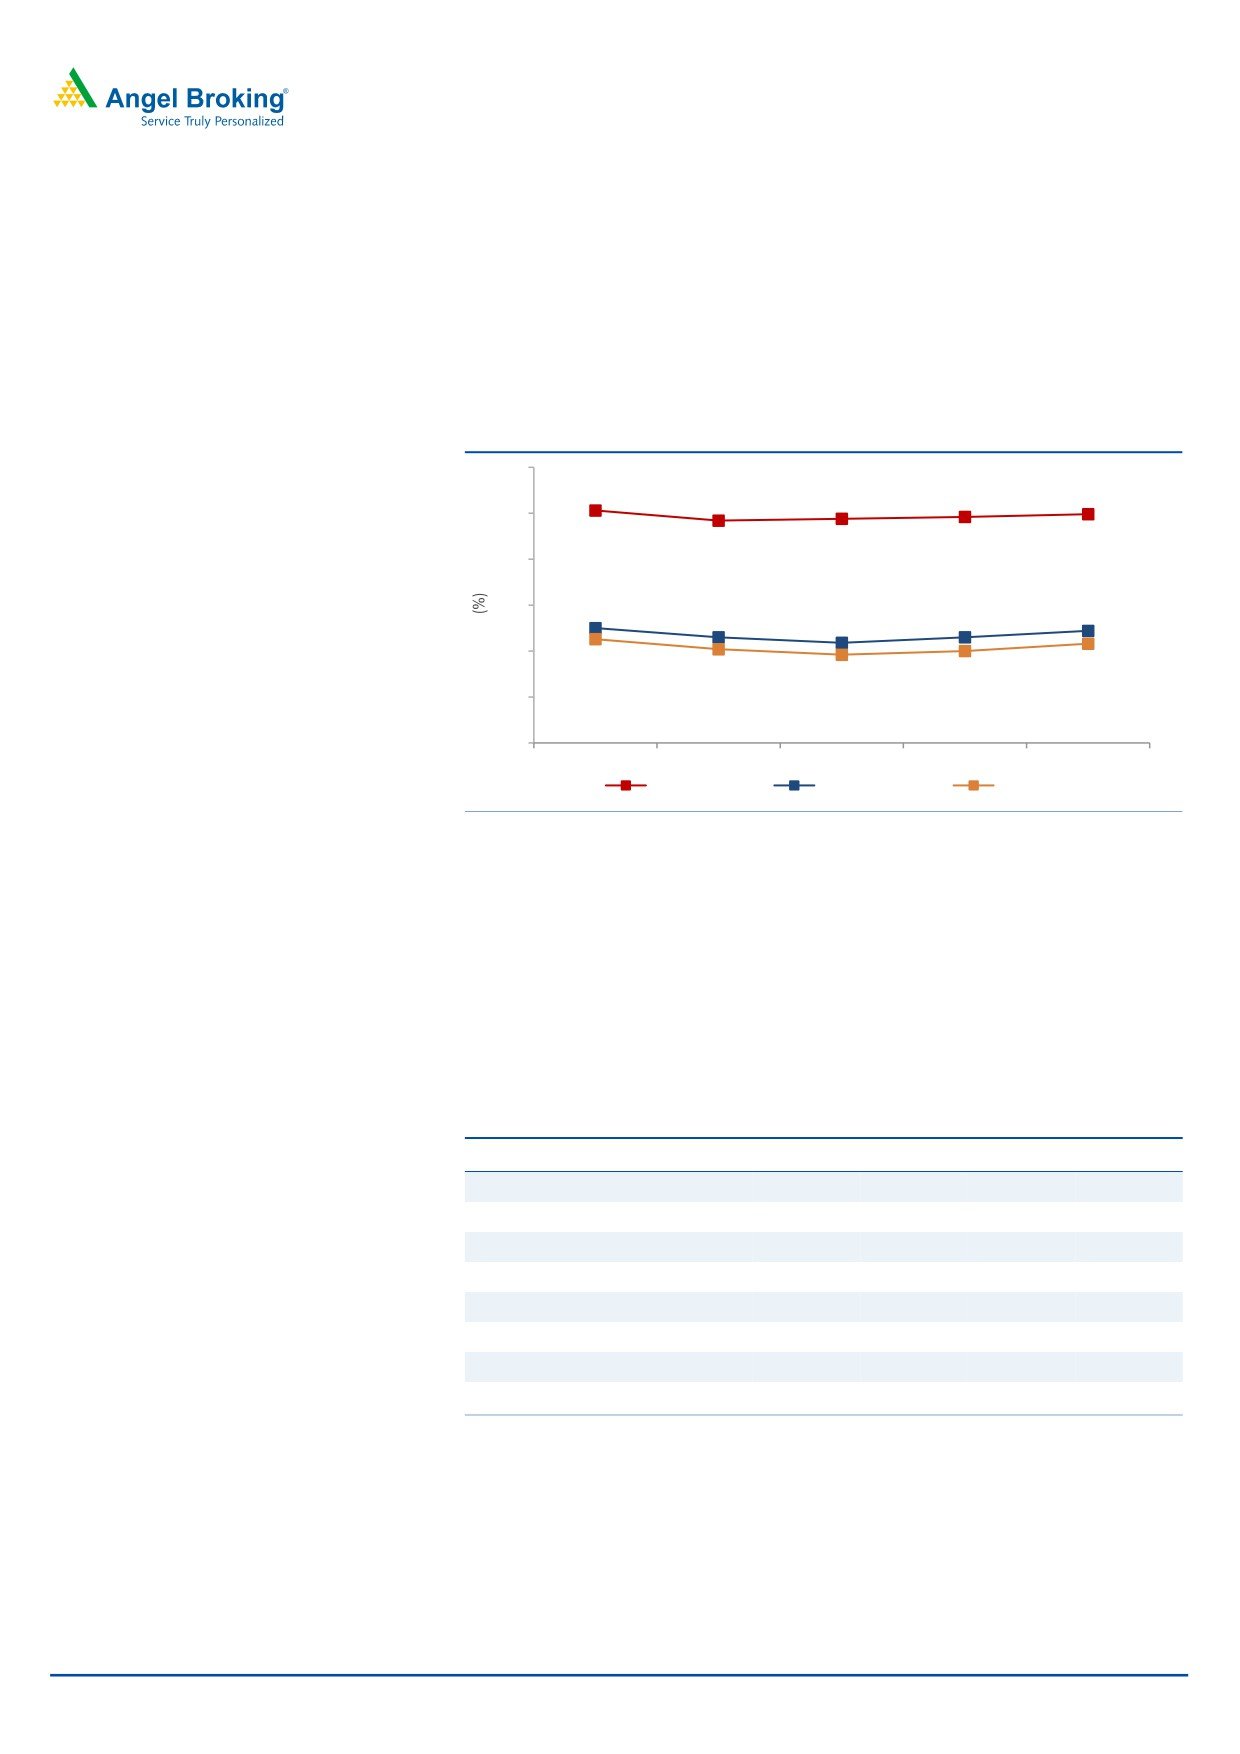
Operating margin in line of expectation
On the operating front, the EBITDA margin came in at 22.2%, an uptick of 71bp
QoQ. The Adj. EBIT margin came in at 20.8% V/s 20.0% in 2QFY2016, an
expansion of 73bp QoQ. Business continuity costs in Chennai were headwinds in
addition to partial wage hikes; these were however offset by depreciation of the
INR and sequential decline in the headcount.
Exhibit 8: Margin profile
40
35.3
34.9
34.2
34.4
34.6
35
30
25
22.5
22.2
21.5
21.5
20.9
20
21.3
20.2
20.8
19.6
20.0
15
10
3QFY15
4QFY15
1QFY16
2QFY16
3QFY16
Gross margin
EBITDA margin
EBIT margin
Source: Company, Angel Research
Client pyramid
HCL Tech signed 7 transformational deals during the quarter with TCV of more
than US$2bn, taking the number of transformational engagements during the nine
month financial year to 25 with TCV of more than US$4bn. These wins were
broad-based across service lines and industry verticals, led by the company’s next-
generation offerings - BEYONDigital, IoT WoRKS and Next-Gen ITO.
Exhibit 9: Client pyramid
Particulars
3QFY15
4QFY15
1QFY16
2QFY16
3QFY16
US$1mn-5mn
262
265
262
267
262
US$5mn-10mn
84
87
91
87
84
US$10mn-20mn
50
51
58
66
49
US$20mn-30mn
35
33
32
32
35
US$30mn-40mn
16
17
19
16
16
US$40mn-50mn
5
6
6
4
5
US$50mn-100mn
10
10
11
12
10
US$100mn plus
7
7
7
7
7
Source: Company, Angel Research
May 17, 2016
5
HCL Technologies | 3QFY2016 Result Update
Investment arguments
Robust outlook: The company’s engineering services has been seeing lumpy
growth over the last few quarters. This is however largely a function of the timing
of large transformational deals. 6-8 of the large deals signed a few quarters ago
will aid the company to continue to post industry leading growth, although the
same is unlikely to be consistent on a sequential basis. Other service areas like
application support & maintenance have been seeing slow growth. Although the
area is well-penetrated, there is potential for churn, and there could likely be entry
of new customers. We expect HCL Tech to post a USD and INR revenue CAGR of
12.5% and 15.5%, respectively, over FY2015-18E (inclusive of the acquisition of
Geometric Software and Volvo deals).
Healthy pipeline: HCL Tech signed 7 transformational deals during the quarter
with TCV of more than US$2bn, taking the number of transformational
engagements during the nine month financial year to 25 with TCV of more than
US$4bn. These wins were broad-based across service lines and industry verticals,
led by our Next-generation offerings - BEYONDigital, IoT WoRKS and Next-Gen
ITO.
Outlook and valuation
On the operating front, HCL Tech’s EBIT margin has been around 20.1% in
FY2016, a dip of 317bp over the previous financial year. With the acquisition of
geometric software and Volvo, we expect the EBIT margin to be under pressure.
We expect the EBIT and PAT to post a 10.0% and 7.6% CAGR, respectively, over
FY2015-18E. At the current market price, the stock is trading at 12.9x FY2017E
and 11.2x FY2018E EPS. We recommend a Buy on the stock with a price target of
`1,038.
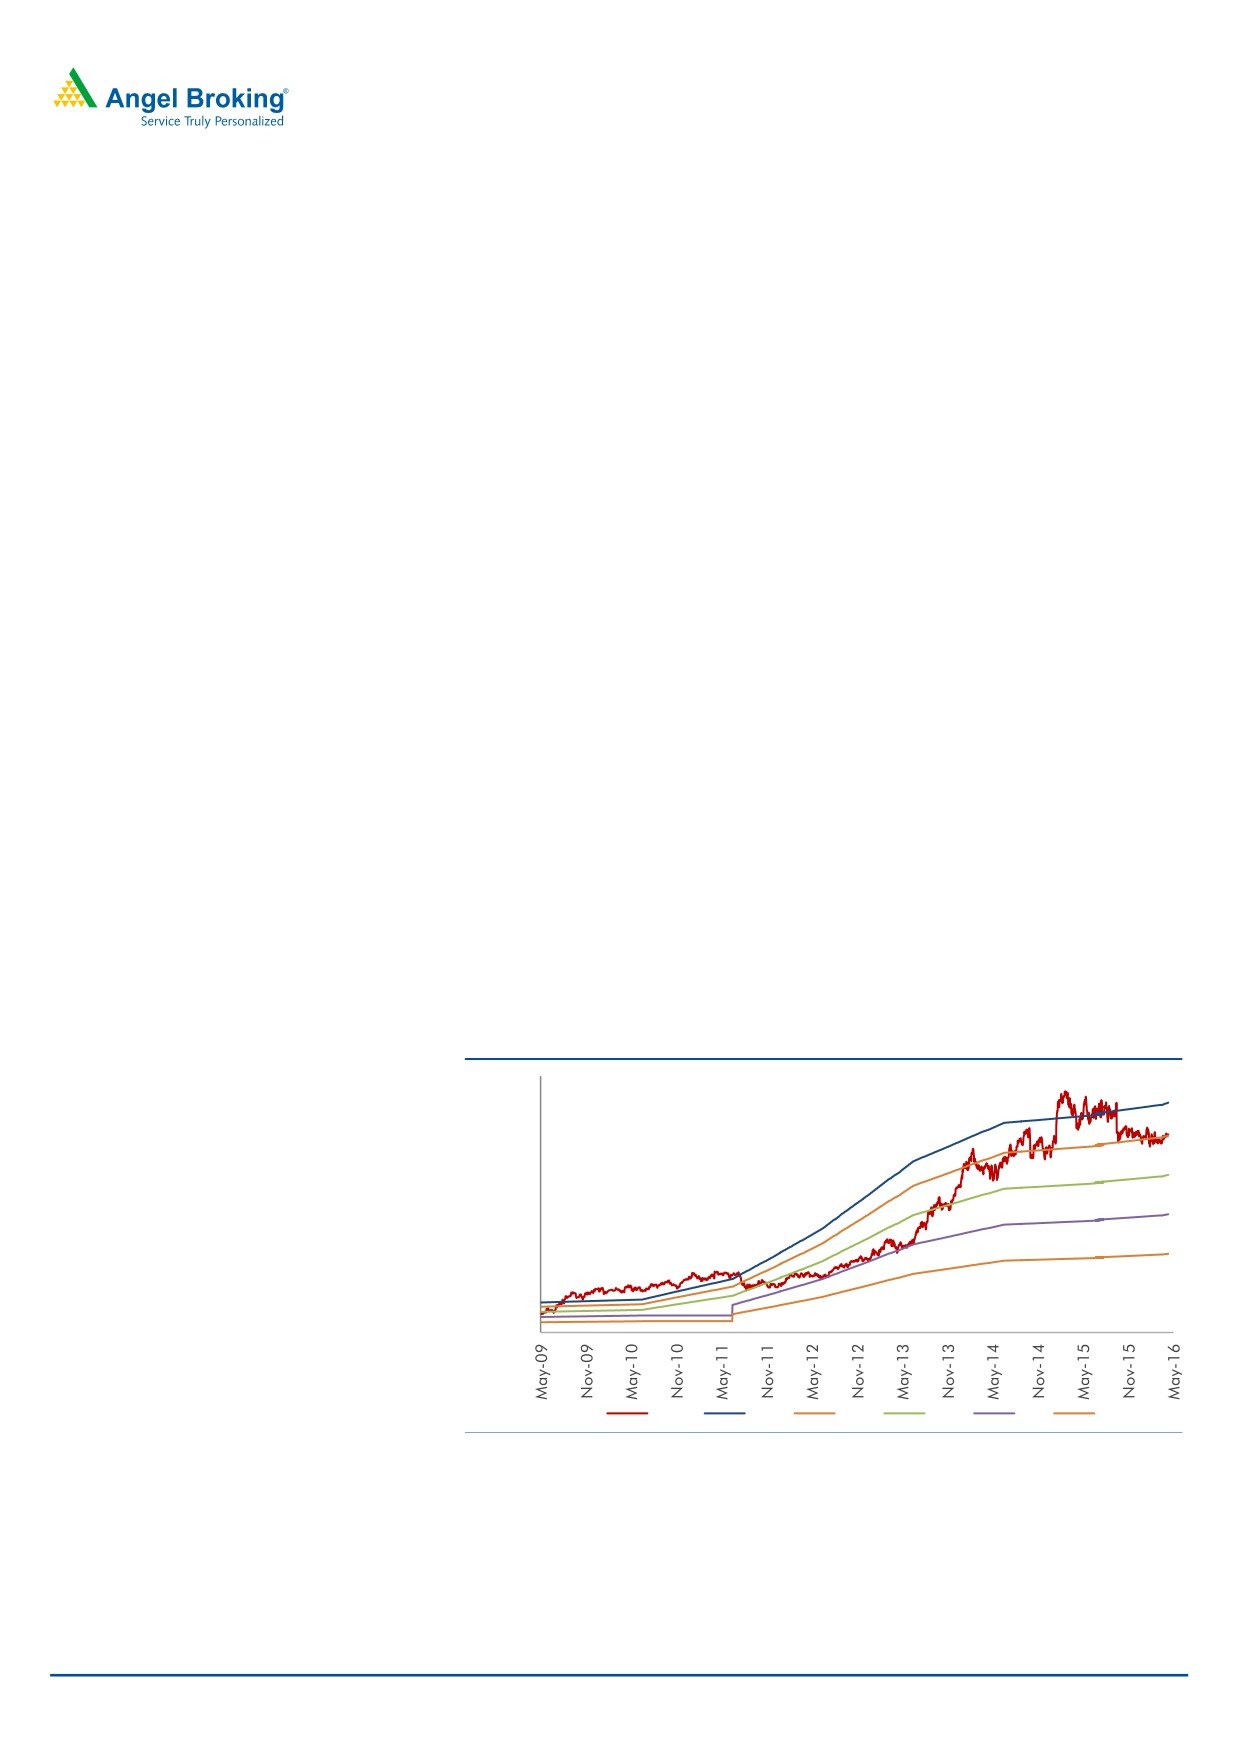
Exhibit 10: One-year forward PE (x) chart
1000.0
800.0
600.0
400.0
200.0
0.0
Price
18x
15x
12x
9x
6x
Source: Company, Angel Research
May 17, 2016
6
HCL Technologies | 3QFY2016 Result Update
Exhibit 11: Recommendation summary
Company
Reco
CMP Tgt Price Upside
FY2017E FY2017E
FY2015-17E
FY2017E
FY2017E
(`)
(`)
(%)
EBITDA (%)
P/E (x)
EPS CAGR (%)
EV/Sales (x)
RoE (%)
HCL Tech
Buy
722
1,000
38.5
20.5
12.9
4.2
1.6
20.3
Infosys
Accumulate
1,207
1,374
13.9
27.5
18.5
10.6
3.4
22.4
TCS
Buy
2,523
3,004
19.0
28.3
17.9
11.8
3.6
34.6
Tech Mahindra Accumulate
478
530
10.8
17.0
14.2
8.0
1.3
19.1
Wipro
Buy
540
680
26.0
23.8
13.3
9.7
1.7
20.0
Source: Company, Angel Research
Company Background
HCL Tech is India's fifth largest IT services company, with over
1,00,000
employees catering to more than 450 clients. The company's service offerings
include Enterprise Application Services (EAS), Custom Applications, Engineering
and Research and Development (ERD) and Infrastructure Management Services
(IMS). In December 2008, HCL Tech acquired UK-based SAP consulting company -
Axon, which now contributes ~10% to its consolidated revenue. Recently, during
3QFY2016, the company acquired Geometric Software.
May 17, 2016
7
HCL Technologies | 3QFY2016 Result Update
Profit and loss statement (Consolidated, US GAAP)
Y/E Mar (` cr)
FY2014
FY2015
FY2016
FY2017E
FY2018E
Net sales
32,908
37,061
30,781
49,242
57,168
Cost of revenues
20,209
23,798
20,235
32,549
37,788
Gross profit
12,699
13,263
10,546
16,693
19,380
% of net sales
38.6
35.8
34.3
33.9
33.9
SG&A expenses
4,070
4,563
3,940
6,598
7,661
% of net sales
12.4
12.3
12.8
13.4
13.4
EBITDA
8,629
8,700
6,606
10,095
11,719
% of net sales
26.2
23.5
21.5
20.5
20.5
Depreciation and amort.
753
451
393
640
740
% of net sales
2.3
1.2
1.3
1.3
1.3
EBIT
7,876
8,249
6,213
9,454
10,979
% of net sales
23.9
22.3
20.2
19.2
19.2
Other income, net
492
912
756
756
756
Profit before tax
8,369
9,161
6,969
10,211
11,736
Provision for tax
1,629
1,908
1,364
2,349
2,699
% of PBT
19.5
20.8
19.6
23.0
23.0
PAT
6,739
7,253
5,605
7,862
9,037
Share from equity invest.
-
-
-
-
-
Forex loss
(549)
-
-
-
-
ESOP charges
25
103
38
38
38
Reported net profit
6,190
7,253
5,643
7,862
9,037
Fully diluted EPS (`)
43.9
51.4
40.0
55.7
64.1
Note: FY2016 Numbers are 9 month figures
May 17, 2016
8
HCL Technologies | 3QFY2016 Result Update
Balance sheet (Consolidated, US GAAP)
Y/E Mar (` cr)
FY2014 FY2015 FY2016 FY2017E FY2018E
Cash and cash equivalent
1,021
1,352
729
6,950
13,473
Account receivables, net
5,684
6,563
7,721
8,504
9,873
Unbilled receivables
2,024
2,923
3,002
2,955
3,430
Deposit with banks
8,370
9,670
10,587
15,587
20,587
Deposit (one year with HDFC ltd)
-
-
-
-
-
Invest. securities, available for sale
609
767
537
2,250
2,250
Other current assets
2,125
2,338
2,410
2,710
3,010
Total current assets
19,833
23,613
24,986
38,956
52,624
Property and equipment, net
3,147
3,820
4,323
4,623
4,923
Intangible assets, net
5,149
5,204
6,419
6,419
6,419
Deposits with HDFC Ltd.
-
-
-
-
-
Fixed deposits with banks
-
-
-
-
-
Investment securities HTM
-
8
160
160
160
Investment in equity investee
16
-
-
-
-
Other assets
2,346
3,066
3,879
4,780
4,780
Total assets
30,490
35,711
39,768
54,939
68,906
Current liabilities
8,197
9,232
9,509
13,199
15,323
Borrowings
751
469
973
973
973
Other liabilities
1,462
1,259
1,264
2,077
2,078
Total liabilities
10,409
10,960
11,745
16,249
18,374
Minority interest
-
-
-
-
Total stockholder equity
20,081
24,751
28,022
38,690
50,532
Total liab. and stock holder equity
30,490
35,711
39,768
54,939
68,906
Note: FY2016 Numbers are 9 month figures
May 17, 2016
9
HCL Technologies | 3QFY2016 Result Update
Cash flow statement (Consolidated, US GAAP)
Y/E Mar (` cr)
FY2014
FY2015
FY2016
FY2017E
FY2018E
Pre tax profit from operations
7,797
7,253
5,643
7,862
9,037
Depreciation
733
451
393
640
740
Expenses (deffered)/written off/others
(584)
(168)
(48)
(48)
(48)
Pre tax cash from operations
7,946
7,536
5,988
8,455
9,729
Other income/prior period ad
572
912
756
756
756
Net cash from operations
8,518
8,448
6,744
9,211
10,485
Tax
(1,547)
(1,908)
(1,364)
(2,349)
(2,699)
Cash profits
6,971
6,540
5,381
6,863
7,786
(Inc)/dec in current assets
(1,749)
(1,991)
(1,309)
(1,036)
(2,144)
Inc/(dec) in current liabilties
1,654
1,035
277
3,690
2,124
Net trade working capital
(95)
(956)
(1,033)
2,654
(20)
Cashflow from operating activities
6,875
5,584
4,348
9,517
7,766
(Inc)/dec in fixed assets
(1,094)
(674)
(503)
(300)
(300)
(Inc)/dec in intangibles
(248)
(55)
(1,215)
-
-
(Inc)/dec in investments
(4,688)
(1,458)
(687)
(6,714)
(5,000)
(Inc)/dec in minority interest
-
-
-
-
-
Inc/(dec) in non current liabilities
(54)
(203)
5
814
-
(Inc)/dec in non current assets
(107)
(214)
(72)
(300)
(300)
Cashflow from investing activities
(6,191)
(2,602)
(2,473)
(6,500)
(5,600)
Inc/(dec) in debt
55
-
-
-
-
Inc/(dec) in equity/premium
-
-
-
-
-
ESOP charges
(25)
(103)
(103)
(103)
(103)
Dividends
(296)
(1,651)
(2,805)
(2,805)
(2,805)
Others
(129)
(208)
2,385
621
7,692
Cashflow from financing activities
(396)
(1,962)
(523)
(2,287)
4,784
Cash generated/(utilised)
289
331
(623)
6,221
6,523
Cash at start of the year
732
1,021
1,352
729
6,950
Cash at end of the year
1,021
1,352
729
6,950
13,473
Note: FY2016 Numbers are 9 month figures
May 17, 2016
10
HCL Technologies | 3QFY2016 Result Update
Key ratios
Y/E Mar
FY2014
FY2015
FY2016
FY2017E
FY2018E
Valuation ratio (x)
P/E (on FDEPS)
16.4
14.0
18.0
12.9
11.2
P/CEPS
14.6
13.2
16.8
11.9
10.4
P/BVPS
5.1
4.1
3.6
2.6
2.0
Dividend yield (%)
1.9
1.9
2.4
2.4
2.4
EV/Sales
2.8
2.4
2.9
1.6
1.2
EV/EBITDA
10.7
10.4
13.7
7.7
5.6
EV/Total assets
3.0
2.5
2.3
1.4
1.0
Per share data (`)
EPS (Fully diluted)
43.9
51.4
40.0
55.7
64.1
Cash EPS
49.2
54.6
42.8
60.3
69.3
Dividend
14.0
14.0
17.0
17.0
17.0
Book value
142
175
199
274
358
Dupont analysis
Tax retention ratio (PAT/PBT)
0.8
0.8
0.8
0.8
0.8
Cost of debt (PBT/EBIT)
1.1
1.1
1.1
1.1
1.1
EBIT margin (EBIT/Sales)
0.2
0.2
0.2
0.2
0.2
Asset turnover ratio (Sales/Assets)
1.1
1.0
0.8
0.9
0.8
Leverage ratio (Assets/Equity)
1.5
1.4
1.4
1.4
1.4
Operating ROE
33.6
29.3
20.0
20.3
17.9
Return ratios (%)
RoCE (pre-tax)
25.8
23.1
15.6
17.2
15.9
Angel RoIC
38.4
34.5
22.4
31.5
33.8
RoE
30.8
29.3
20.1
20.3
17.9
Turnover ratios (x)
Asset turnover (fixed assets)
11.2
10.6
7.6
11.0
12.0
Receivables days
71
68
83
78
68
Note: FY2016 Numbers are 9 month figures
May 17, 2016
11
HCL Technologies | 3QFY2016 Result Update
Research Team Tel: 022 - 39357800
DISCLAIMER
Angel Broking Private Limited (hereinafter referred to as “Angel”) is a registered Member of National Stock Exchange of India Limited,
Bombay Stock Exchange Limited and Metropolitan Stock Exchange of India Limited. It is also registered as a Depository Participant with
CDSL and Portfolio Manager with SEBI. It also has registration with AMFI as a Mutual Fund Distributor. Angel Broking Private Limited is
a registered entity with SEBI for Research Analyst in terms of SEBI (Research Analyst) Regulations, 2014 vide registration number
INH000000164. Angel or its associates has not been debarred/ suspended by SEBI or any other regulatory authority for accessing
/dealing in securities Market. Angel or its associates including its relatives/analyst do not hold any financial interest/beneficial
ownership of more than 1% in the company covered by Analyst. Angel or its associates/analyst has not received any compensation /
managed or co-managed public offering of securities of the company covered by Analyst during the past twelve months. Angel/analyst
has not served as an officer, director or employee of company covered by Analyst and has not been engaged in market making activity
of the company covered by Analyst.
This document is solely for the personal information of the recipient, and must not be singularly used as the basis of any investment
decision. Nothing in this document should be construed as investment or financial advice. Each recipient of this document should
make such investigations as they deem necessary to arrive at an independent evaluation of an investment in the securities of the
companies referred to in this document (including the merits and risks involved), and should consult their own advisors to determine
the merits and risks of such an investment.
Reports based on technical and derivative analysis center on studying charts of a stock's price movement, outstanding positions and
trading volume, as opposed to focusing on a company's fundamentals and, as such, may not match with a report on a company's
fundamentals.
The information in this document has been printed on the basis of publicly available information, internal data and other reliable
sources believed to be true, but we do not represent that it is accurate or complete and it should not be relied on as such, as this
document is for general guidance only. Angel Broking Pvt. Limited or any of its affiliates/ group companies shall not be in any way
responsible for any loss or damage that may arise to any person from any inadvertent error in the information contained in this report.
Angel Broking Pvt. Limited has not independently verified all the information contained within this document. Accordingly, we cannot
testify, nor make any representation or warranty, express or implied, to the accuracy, contents or data contained within this document.
While Angel Broking Pvt. Limited endeavors to update on a reasonable basis the information discussed in this material, there may be
regulatory, compliance, or other reasons that prevent us from doing so.
This document is being supplied to you solely for your information, and its contents, information or data may not be reproduced,
redistributed or passed on, directly or indirectly.
Neither Angel Broking Pvt. Limited, nor its directors, employees or affiliates shall be liable for any loss or damage that may arise from
or in connection with the use of this information.
Note: Please refer to the important ‘Stock Holding Disclosure' report on the Angel website (Research Section). Also, please refer to the
latest update on respective stocks for the disclosure status in respect of those stocks. Angel Broking Pvt. Limited and its affiliates may
have investment positions in the stocks recommended in this report.
Disclosure of Interest Statement
HCL Technologies
1. Analyst ownership of the stock
No
2. Angel and its Group companies ownership of the stock
No
3. Angel and its Group companies' Directors ownership of the stock
No
4. Broking relationship with company covered
No
Note: We have not considered any Exposure below ` 1 lakh for Angel, its Group companies and Directors
Ratings (Based on expected returns
Buy (> 15%)
Accumulate (5% to 15%)
Neutral (-5 to 5%)
over 12 months investment period):
Reduce (-5% to -15%)
Sell (< -15)
May 17, 2016
12