2QFY2016 Result Update | IT
January 27, 2016
HCL Technologies
BUY
CMP
`840
Performance Highlights
Target Price
`1,038
(` cr) - Consl.
2QFY16 1QFY16
% chg (qoq) 2QFY15
% chg (yoy)
Investment Period
12 Months
Net revenue
10,341
10,097
2.4
9,283
11.4
EBIT
2,072
1,979
4.7
2,210
(6.2)
Stock Info
Adj. EBIT margin (%)
20.0
20.6
56bps
23.8
(377)bps
Sector
IT
PAT
1,920
1,823
5.3
1,915
0.3
Market Cap (` cr)
118,376
Source: Company, Angel Research
Net Debt (` cr)
(10,553)
HCL Technologies (HCL Tech) reported better-than-expected results for
Beta
0.6
2QFY2016. It posted a sales growth of 1.4% qoq to US$1,566mn V/s an
52 Week High / Low
1,058/798
expected US$1,568mn. In constant currency (CC) terms, revenue grew 2.1% qoq.
Avg. Daily Volume
175,777
On the operating front, the EBITDA margin came in at 21.5% (V/s an expected
Face Value (`)
2
20.9%) an uptick of 58bp qoq. Consequently, the PAT came in at `1,920cr (V/s
BSE Sensex
24,486
an expected `1,739cr), a growth of 5.3% qoq. On back of a strong order book,
Nifty
7,436
the company expects 2HFY2016 to be better than 1HFY2016. We maintain our
Reuters Code
HCLT.BO
Buy recommendation on the stock with a price target of `1,038.
Bloomberg Code
HCLT@IN
Quarterly highlights: The company has reported better-than-expected results for
the quarter. It posted a sales growth of 1.4% qoq to US$1,566mn V/s an
expected US$1,568mn. In constant currency (CC) terms, revenue grew 2.1% qoq.
Shareholding Pattern (%)
In CC terms, the key geography which drove sales was Americas, which grew
Promoters
60.6
5.5% qoq; while Europe and ROW posted a dip of 2.4% qoq and 3.4% qoq,
MF / Banks / Indian Fls
7.5
respectively. On the operating front, the EBITDA margin came in at 21.5% (V/s an
FII / NRIs / OCBs
28.8
expected 20.9%) an uptick of 58bp qoq. Consequently, the PAT came in at
Indian Public / Others
3.1
`1,920cr (V/s an expected `1,739cr), a growth of 5.3% qoq. On the productivity
front, the blended utilization came in at 84.7% V/s 83.6% in 1QFY2016, while the
attrition rate came in at 6.4% V/s 7.1% in 1QFY2016.
Abs.(%)
3m 1yr
3yr
Sensex
(10.9)
(16.4)
21.8
Outlook and valuation: We expect HCL Tech to post a USD and INR revenue
HCL Tech
(1.6)
2.1
147.0
CAGR of 13.0% and 13.2%, respectively, over FY2015-17E. On back of strong
order book and given the attractive valuations, we recommend a Buy on the
stock.
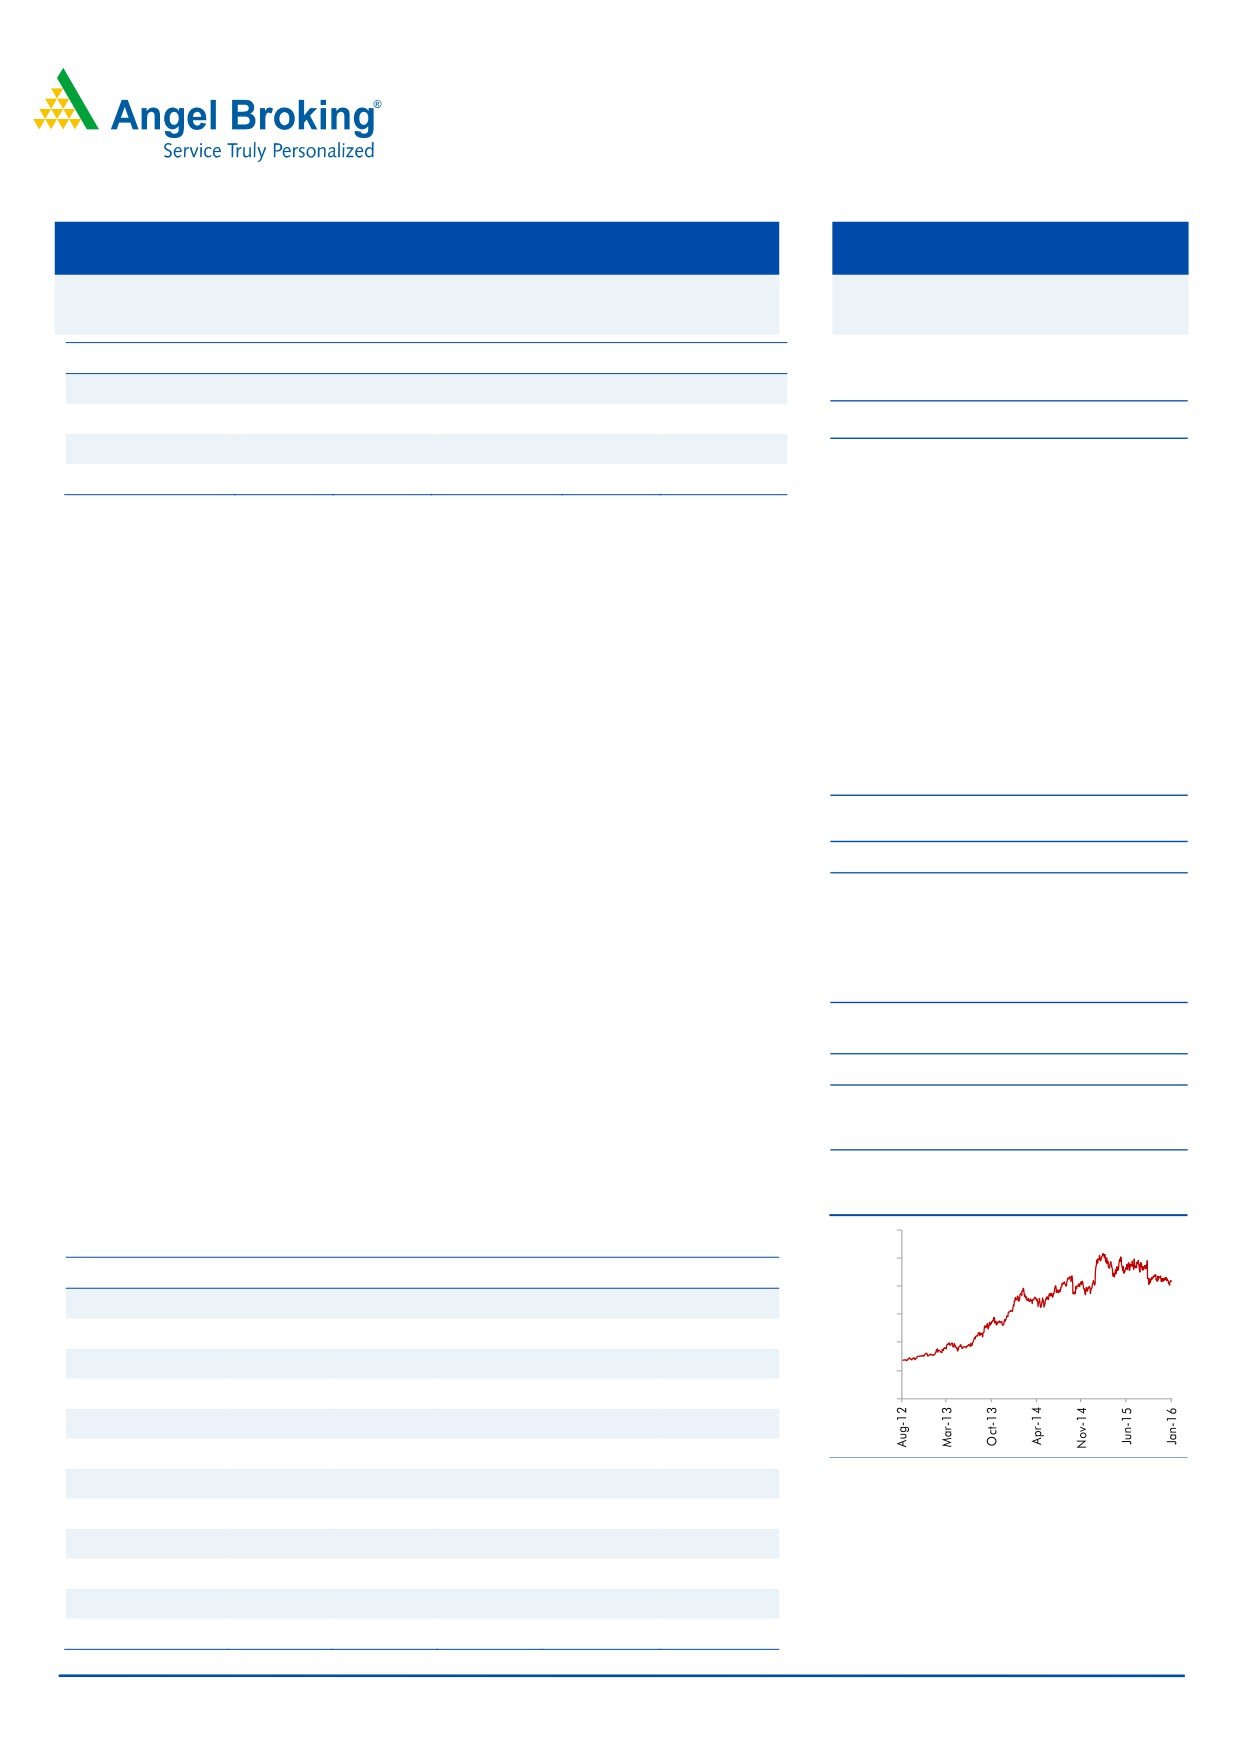
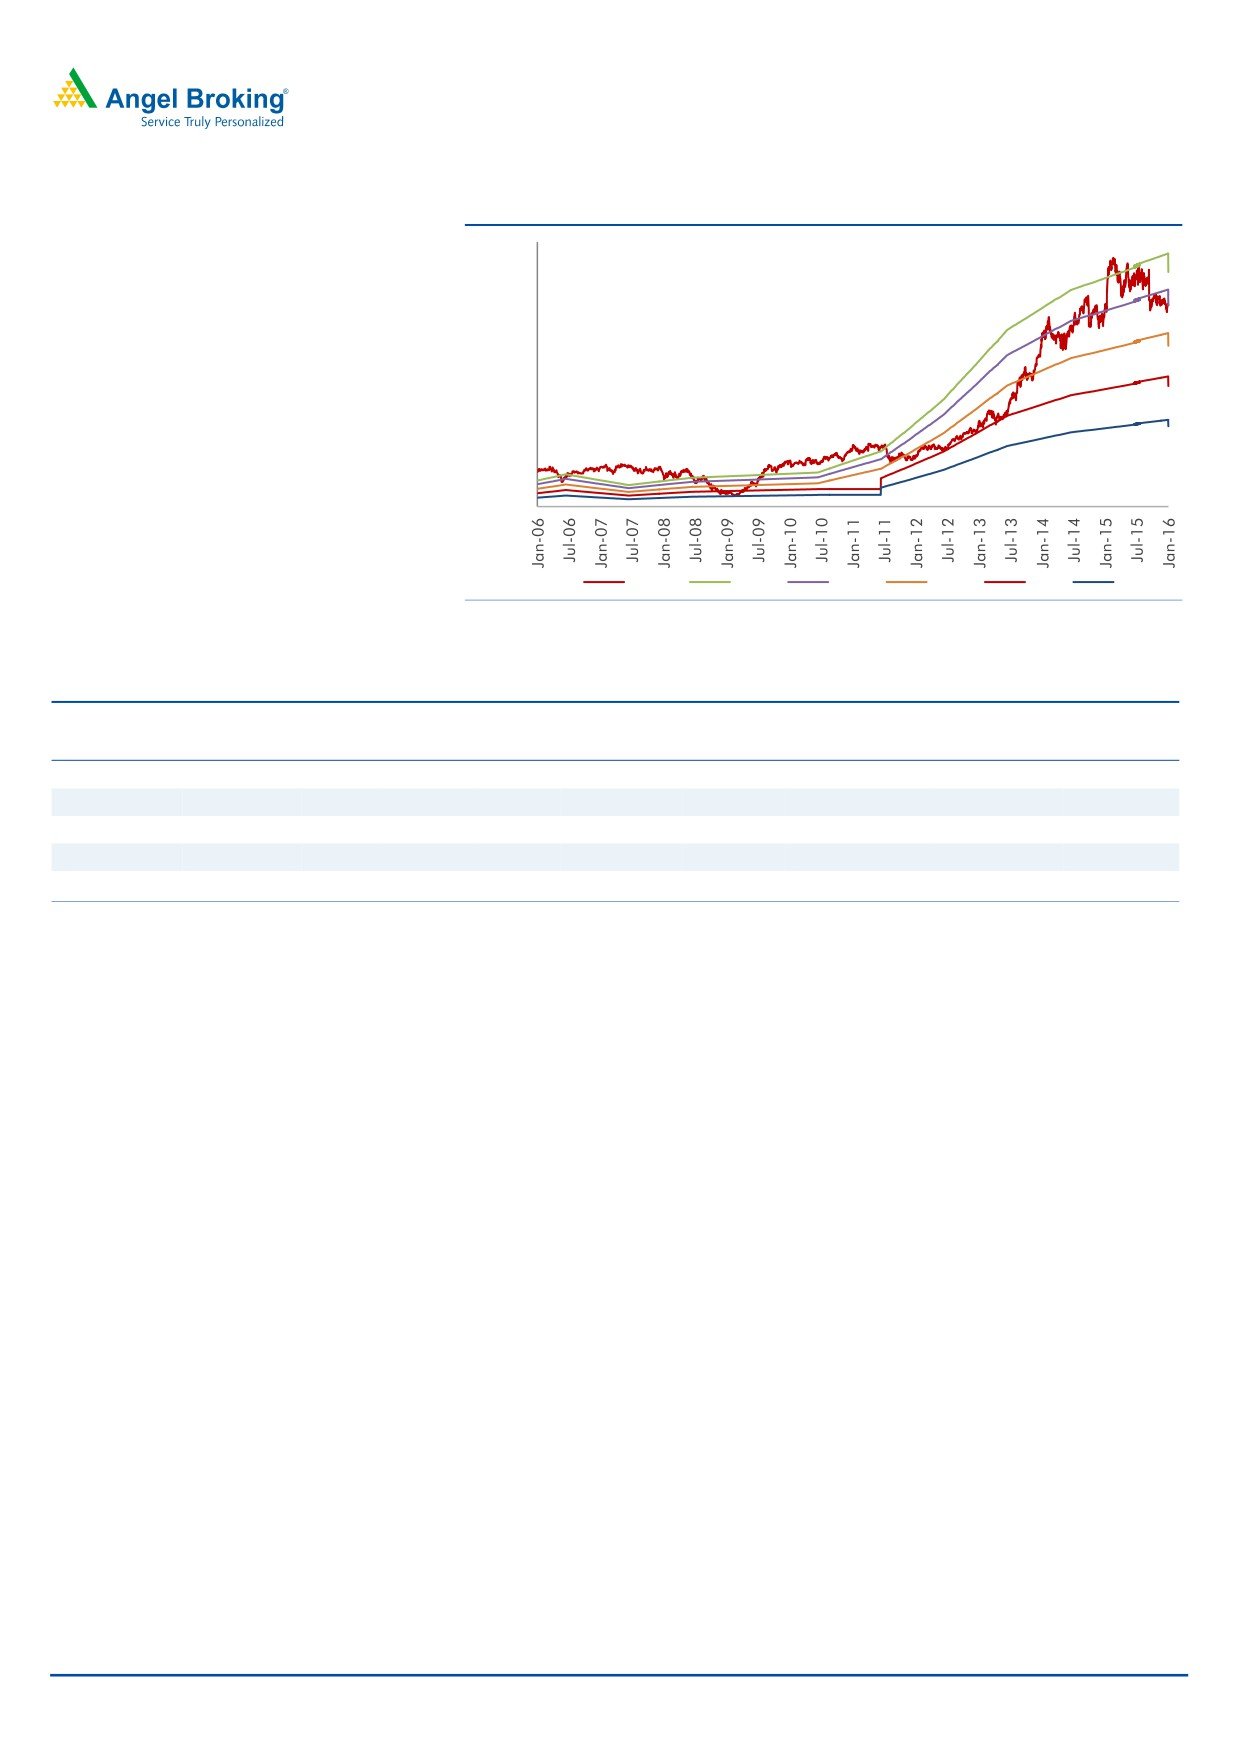
3-year price chart
1,200.0
Key financials (Consolidated, US GAAP)
1,000.0
Y/E June (` cr)
FY2013
FY2014
FY2015
FY2016E
FY2017E
800.0
Net sales
25,770
32,908
37,061
42,038
47,503
600.0
% chg
22.5
27.7
12.6
13.4
13.0
400.0
Net profit
4,082
6,190
7,253
7,216
8,142
200.0
% chg
61.6
51.6
17.2
(0.5)
12.8
0 .0
EBITDA margin (%)
22.6
26.2
23.5
21.2
21.5
EPS (`)
28.9
43.9
51.4
51.1
57.7
Source: Company, Angel Research
P/E (x)
29.0
19.1
16.3
16.4
14.6
P/BV (x)
8.3
5.9
4.8
3.5
2.7
RoE (%)
28.6
30.8
29.3
21.5
18.8
RoCE (%)
22.3
25.8
23.1
17.6
16.3
Sarabjit kour Nangra
EV/Sales (x)
4.4
3.3
2.9
2.3
1.9
+91 22 3935 7800 Ext: 6806
EV/EBITDA (x)
19.6
12.7
12.3
11.0
8.7
Source: Company, Angel Research; Note: CMP as of January 25, 2016
Please refer to important disclosures at the end of this report
1
HCL Technologies | 2QFY2016 Result Update
Exhibit 1: 2QFY2016 performance (Consolidated, US GAAP)
Y/E June (` cr)
2QFY16
1QFY16
% chg (qoq)
2QFY15
% chg (yoy)
1HFY16
1HFY15
% chg(yoy)
Net revenue
10,341
10,097
2.4
9,283
11.4
20,438
18,018
13.4
Cost of revenue
6,768
6,623
2.2
5,849
15.7
13,391
11,371
17.8
Gross profit
3,573
3,474
2.8
3,434
4.0
7,047
6,647
6.0
SG&A expense
1,348
1,360
(0.9)
1,115
20.9
2,708
2,136
26.8
EBITDA
2,225
2,114
5.3
2,319
(4.1)
4,339
4,511
(3.8)
Dep. and amortization
153
135
13.3
109
40.4
288
213
35.2
EBIT
2,072
1,979
4.7
2,210
(6.2)
4,051
4,298
(5.7)
Other income
355
241
47.3
216
64.4
596
559
PBT
2,427
2,220
9.3
2,426
0.0
4,647
4,857
(4.3)
Income tax
508
494
2.8
510
(0.4)
1,002
1,029
(2.6)
PAT
1,920
1,726
11.2
1,915
0.3
3,646
3,828
(4.8)
Forex gain/(loss)
0
0
-
-
-
(38)
-
Adjusted PAT
1,920
1,823
5.3
1,915
0.3
3,646
3,788
(3.7)
EPS
13.6
12.9
5.4
13.6
0.3
25.8
27.0
(4.2)
Gross margin (%)
34.6
34.4
15bp
37.0
(244)bp
34.5
36.9
(241)bp
EBITDA margin (%)
21.5
20.9
58bp
25.0
(346)bp
21.2
25.0
(381)bp
EBIT margin (%)
20.0
19.6
44bp
23.8
(377)bp
19.8
23.9
(403)bp
PAT margin (%)
18.6
18.1
51bp
20.6
(206)bp
17.8
21.0
(318)bp
Source: Company, Angel Research
Exhibit 2: 2QFY2016 - Actual vs Angel estimates
(` cr)
Actual
Estimate
Variation (%)
Net revenue
10,341
10,331
0.1
EBITDA margin (%)
21.5
20.5
102bps
PAT
1,920
1,739
10.4
Source: Company, Angel Research
Inline sales growth
The company has reported better-than-expected results for the quarter. It posted a
sales growth of 1.4% qoq to US$1,566mn V/s an expected US$1,568mn. In
constant currency (CC) terms, revenue grew 2.1% qoq. In rupee terms, revenues
came in at `10,341cr (V/s an expected `10,331cr), a growth of 2.4% qoq.
In CC terms, the key geography that drove sales was Americas, which grew 5.5%
qoq; while Europe and ROW posted a dip of
2.4% qoq and
3.4% qoq,
respectively. Among services, all posted robust growth with the exception of
Engineering and R&D Services which dipped by 1.5% qoq CC; Application
Services, Infrastructure Services and Business Services posted a qoq CC growth of
2.0%, 3.4% and 8.0%, respectively.
Among verticals, Manufacturing and Life sciences & Healthcare were soft; the
former posted a dip of 1.3% qoq CC while the latter posted a flat growth of 0.3%
qoq CC. Other verticals like Financial Services, Public Services, Retail & CPG and
Telecommunications & Media posted a qoq CC growth of 1.9%, 8.4%, 10.3% and
3.4%, respectively.
January 27, 2016
2
HCL Technologies | 2QFY2016 Result Update
Strong client addition continued for the company in CY2015: US$50Mn+ clients
were up by 3, US$30mn+ clients were up by 5, and US$20mn+ clients were up
by 5. Continuing its momentum of deal wins, HCL Tech booked business in excess
of USD 1bn in TCV during the quarter, including 8 transformational deals. The
broad-based business wins, across service lines and industry verticals were driven
by the company’s next-generation offerings. Thus, on back of strong order book,
the company expects 2HFY2016 to be better than 1HFY2016.
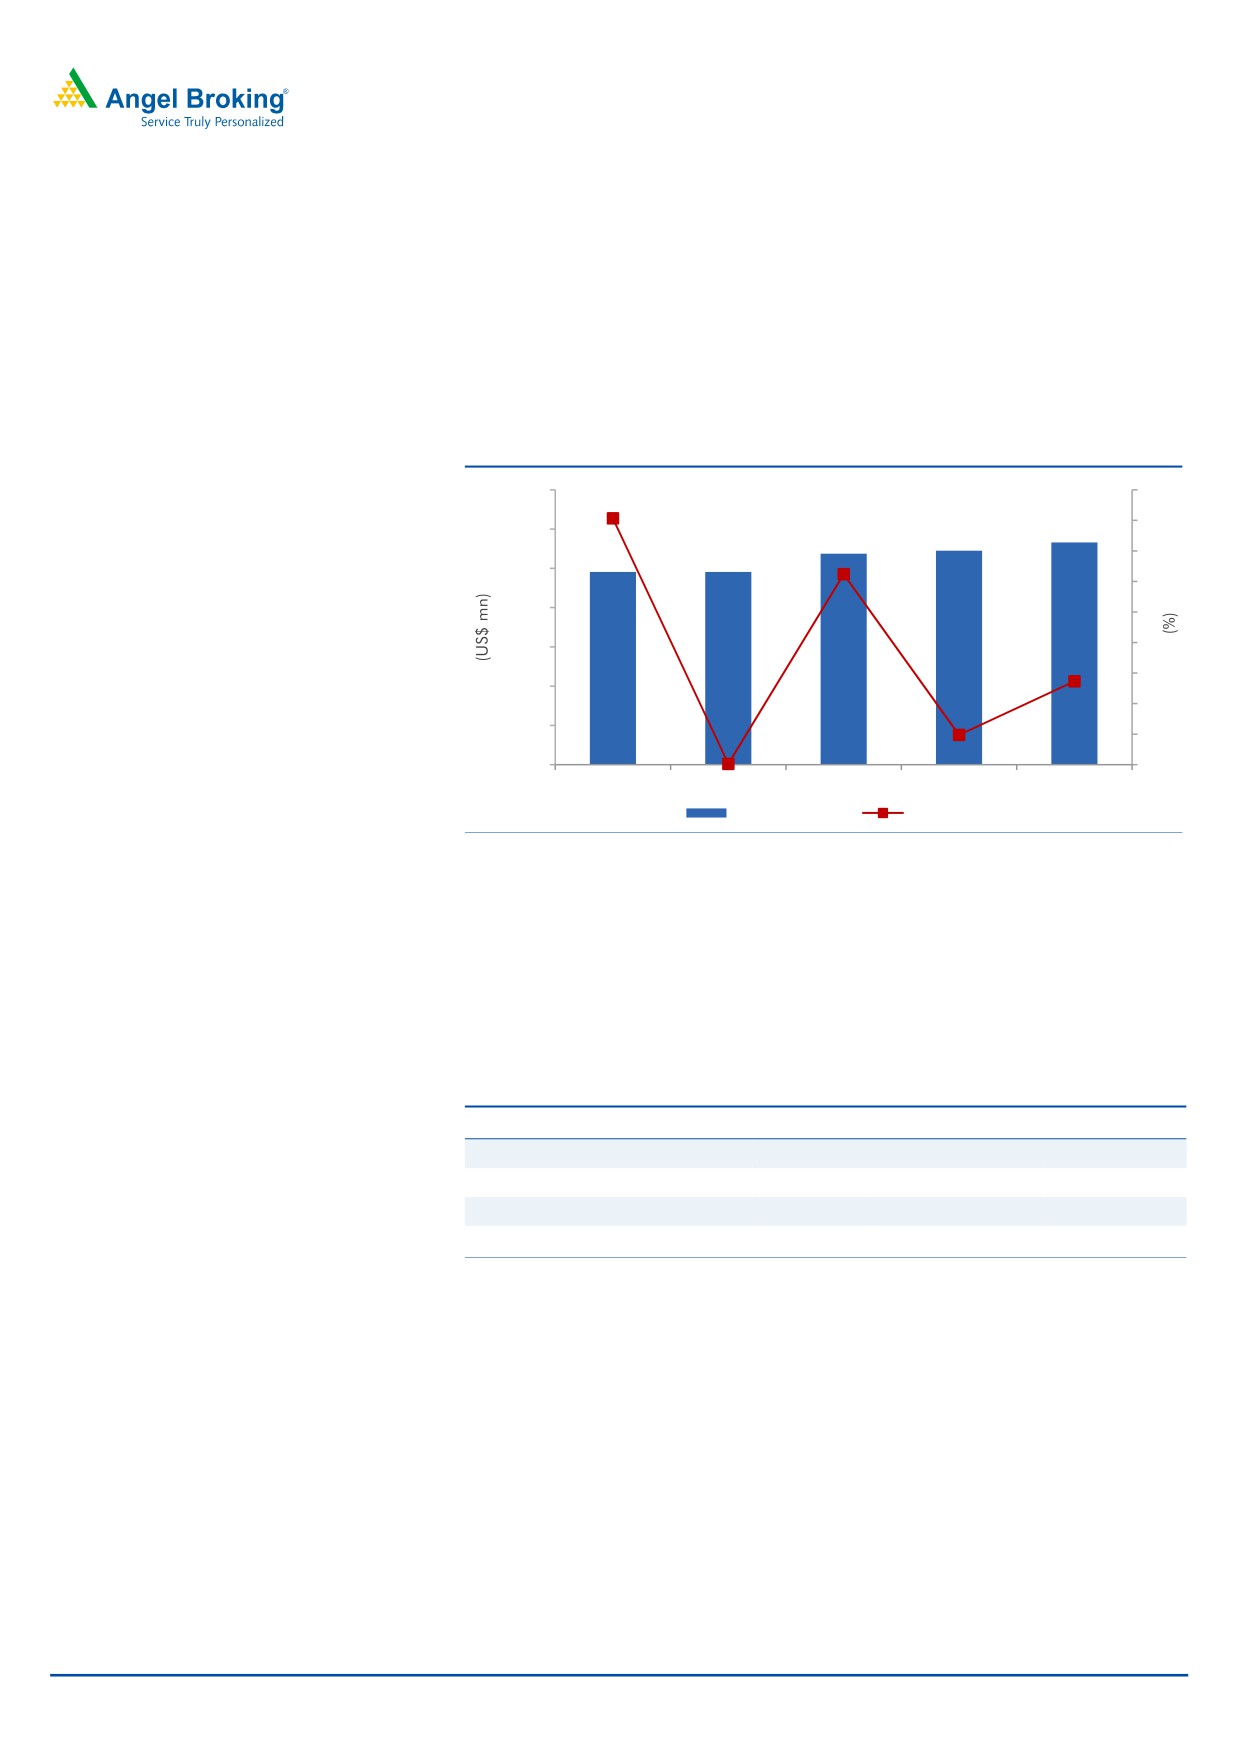
Exhibit 3: Revenue growth trend (USD terms)
1,700
5
4.0
4
1,600
4
1,500
3.1
3
1,400
3
2
1,300
2
1,200
1.4
1
1,100
0.5
1
1,491
1,491
1,538
1,545
1,566
1,000
0.0
0
2QFY15
3QFY15
4QFY15
1QFY2016
2QFY2016
Revenue (USD)
qoq growth (%)
Source: Company, Angel Research
In terms of services, the Engineering & R&D services (which constitute 18.6% of
sales) posted a de-grew 1.5% qoq CC growth, while Application services (which
constitute 40.4% of sales) grew by 2.0% qoq in CC terms. Infrastructure services,
another important segment of the company, which contributes by around 18.6% to
overall sales, posted a growth of 3.4% qoq. Business services, which constituted
5.5% of sales, grew 8.0% qoq on CC basis.
Exhibit 4: Revenue growth trend (Service wise)
% of revenue
% growth CC (qoq)
% growth (yoy)
Application services
40.4
2.0
6.4
Infrastructure services
18.6
3.4
16.4
Business services
5.5
8.0
23.9
Engineering and R&D services
18.6
(1.5)
23.0
Source: Company, Angel Research
Industry segment wise, the company’s Financial Services vertical (contributed
25.9% to revenue) posted a 1.9% qoq growth in CC terms. The Manufacturing
vertical (contributed 31.5% to revenue) posted a 1.3% qoq de-growth in CC terms.
Public services; Life sciences & Healthcare; and Telecommunication, Media,
Publishing & Entertainment reported a qoq growth of 8.4%, 0.3%, and 3.4%, all in
CC terms, respectively. Retail & CPG (contributed 9.5% to revenue) on the other
hand reported a growth of 10.3% qoq in revenue in CC terms, during the quarter.
January 27, 2016
3
HCL Technologies | 2QFY2016 Result Update
Exhibit 5: Revenue growth trend (Industry wise)
% of revenue
% growth (CC qoq)
% growth (yoy)
Financial services
25.9
1.9
10.1
Manufacturing
31.5
(1.3)
12.3
Life sciences & Healthcare
12.2
0.3
27.7
Public Services
10.6
8.4
17.8
Retail & CPG
9.5
10.3
12.6
Telecom, MPE
9.7
3.4
23.6
Source: Company, Angel Research
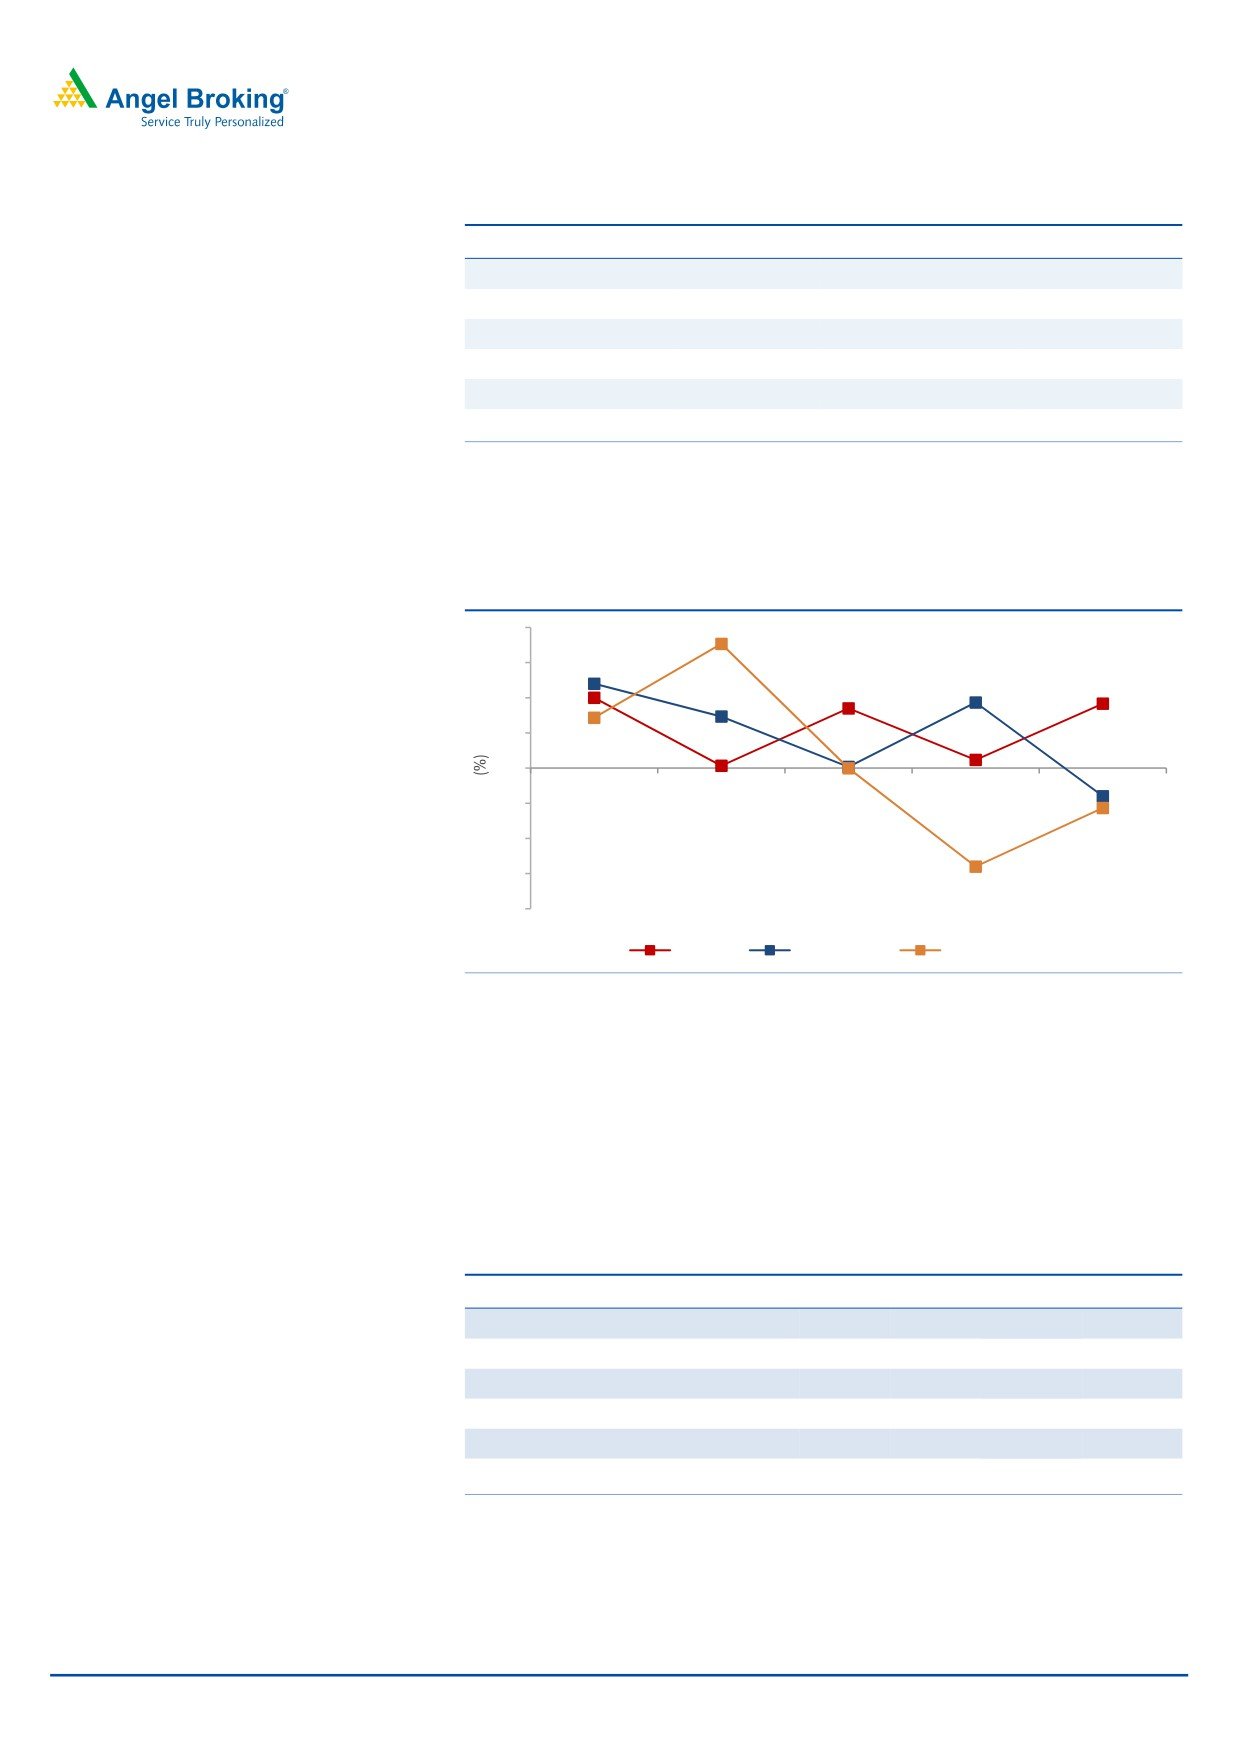
Among geographies, in CC terms, Americas grew by 5.5% qoq, Europe de-grew
by 2.4% qoq, while RoW de-grew by 3.4% qoq on a sequential basis.
Exhibit 6: Revenue growth trend (Geography wise in CC terms)
12
10.6
9
7.2
5.1
6
4.4
5.5
6.0
3
5.6
4.3
0.1
0.7
0
(2.4)
0.2
(0.0)
(3)
(3.4)
(6)
(8.4)
(9)
(12)
2QFY15
3QFY15
4QFY15
1QFY2016
2QFY2016
US
Europe
Rest of the world
Source: Company, Angel Research
Hiring and utilization
During the quarter, the overall headcount of HCL Tech decreased by 7,889 to
1,03,696 employees. Gross addition during the quarter was of 6,234 employees.
The attrition rate in IT Services inched up to 16.7% vs 16.3% in 1QFY2016. The
blended utilization level of the company inched up to 84.7% V/s 83.6% in
1QFY2016.
Exhibit 7: Hiring trend
Particulars
2QFY15 3QFY15 4QFY15 1QFY16 2QFY16
Technical
91,595
95,190
97,135
96,541
94,652
Support
8,645
8,994
8,972
9,030
9,044
Total employee base
1,00,240
1,04,184
1,06,107
105,571
103,696
Gross addition
11,734
11,041
9,448
7,889
6,234
Net addition
4,718
3,944
1,923
(1559)
(1875)
Attrition - IT services (LTM) - %
16.4
16.2
16.5
16.3
16.7
Source: Company, Angel Research
January 27, 2016
4
HCL Technologies | 2QFY2016 Result Update
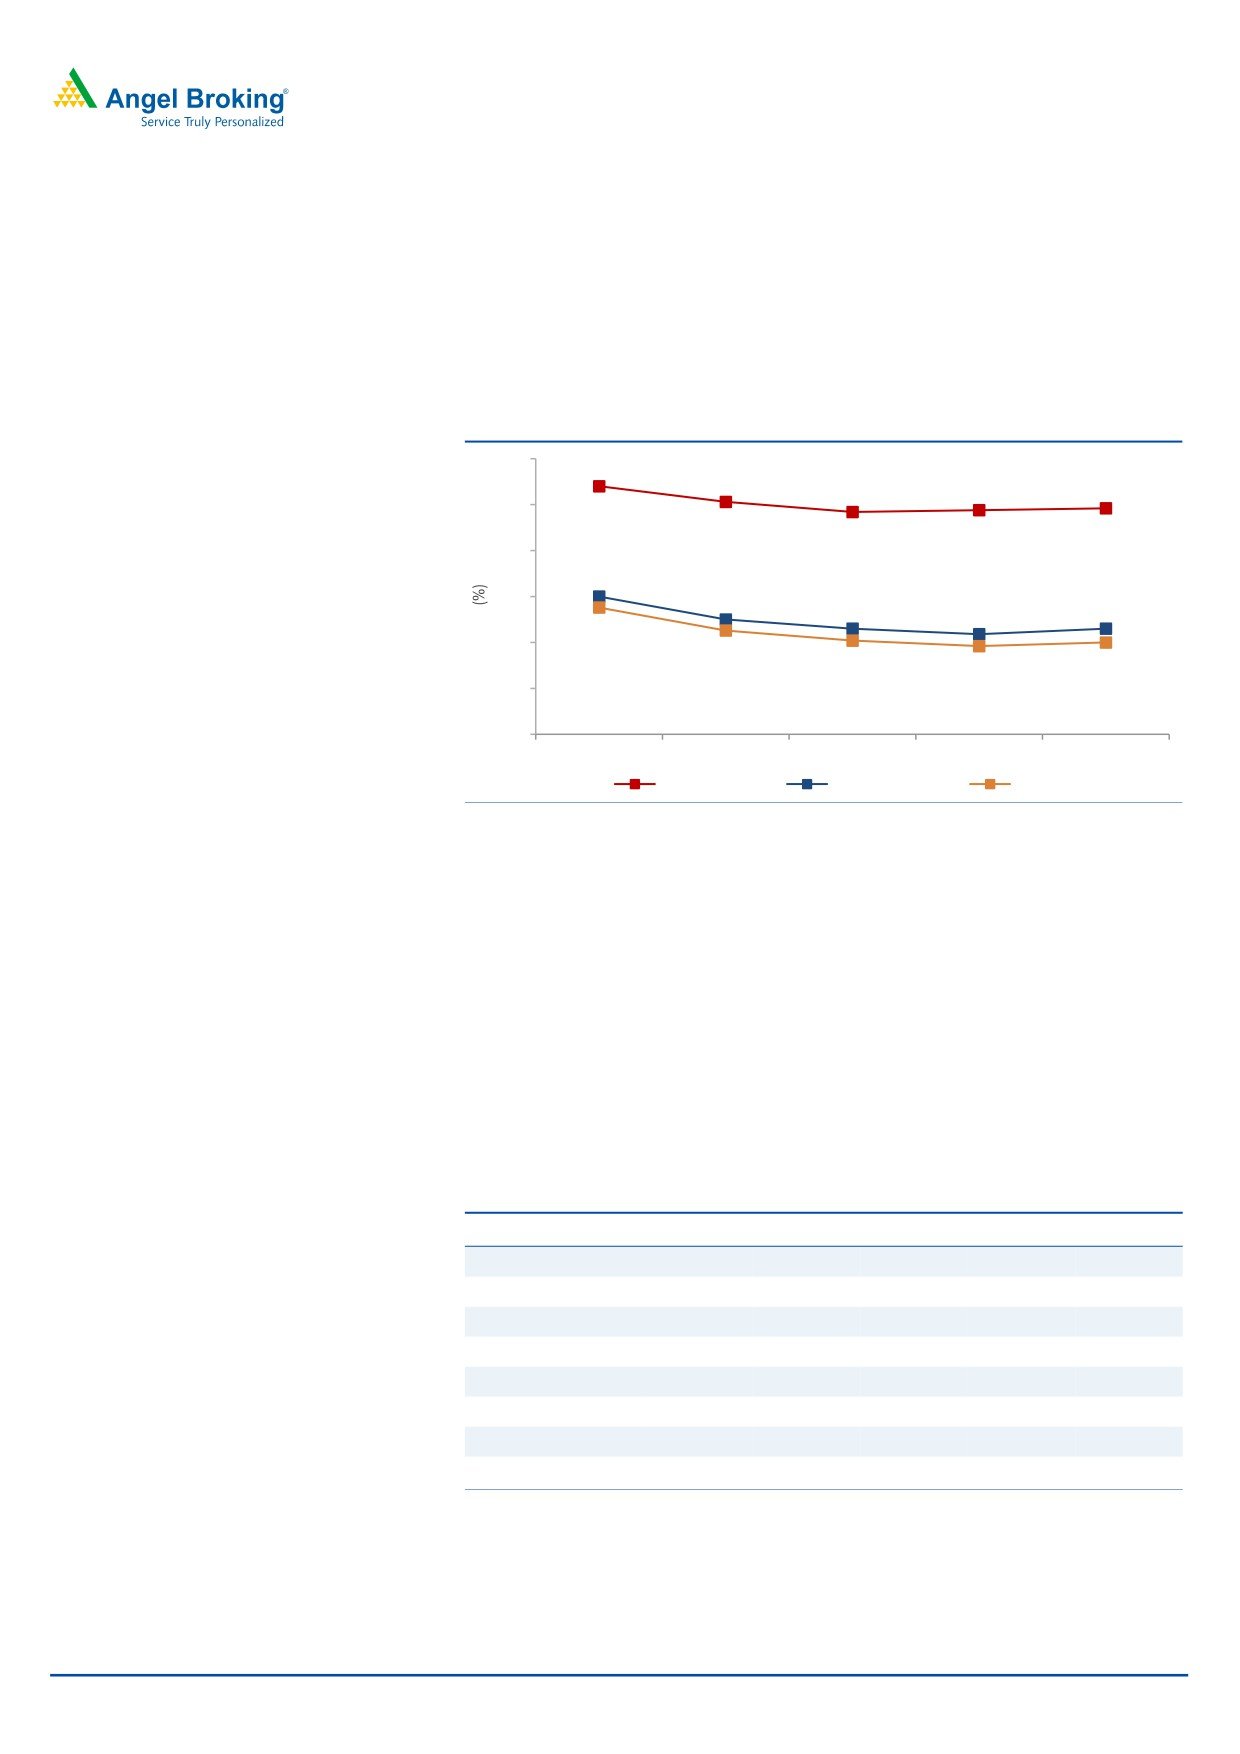
Operating margins above expectation
On the operating front, the EBITDA margin came in at 21.5% (V/s an expected
20.9%) an uptick of 58bps qoq. The Adj. EBIT margin came in at 20.0% V/s 20.6%
in 1QFY2016, a dip of 60bp qoq. While business continuity costs in Chennai were
headwinds in addition to partial wage hikes, these were however offset by
depreciation of the INR and sequential decline in the headcount.
Exhibit 8: Margin profile
40
37.0
35.3
34.2
34.4
34.6
35
30
25.0
25
22.5
21.5
21.5
20.9
23.8
20
21.3
20.2
19.6
20.0
15
10
2QFY15
3QFY15
4QFY15
1QFY16
2QFY16
Gross margin
EBITDA margin
EBIT margin
Source: Company, Angel Research
Client pyramid
Strong client addition continued for the company in CY2015: US$50Mn+ clients
were up by 3, US$30mn+ clients were up by 5, and US$20mn+ clients were up
by 5. Continuing its momentum of deal wins, HCL Tech booked business in excess
of USD 1bn in TCV during the quarter, including 8 transformational deals.
The broad-based business wins, across service lines and industry verticals were
driven by the company’s next-generation offerings. Thus, on back of strong order
book, the company expects 2HFY2016 to be better than 1HFY2016.
Exhibit 9: Client pyramid
Particulars
2QFY15
3QFY15
4QFY15
1QFY16
2QFY16
US$1mn-5mn
245
262
265
262
267
US$5mn-10mn
84
84
87
91
87
US$10mn-20mn
52
50
51
58
66
US$20mn-30mn
32
35
33
32
32
US$30mn-40mn
15
16
17
19
16
US$40mn-50mn
6
5
6
6
4
US$50mn-100mn
9
10
10
11
12
US$100mn plus
7
7
7
7
7
Source: Company, Angel Research
January 27, 2016
5
HCL Technologies | 2QFY2016 Result Update
Investment arguments
Robust outlook: The Management indicated that the deal pipeline across other
service lines also remains healthy and the same has been partly demonstrated in
the company’s last one year performance. Verticals such as financial services,
public services, life sciences & healthcare along with retail & CPG have proved to
be the company’s growth drivers. Geography wise, continental Europe has proved
to be a strong spender vis-à-vis its peers. We expect HCL Tech to post a USD and
INR revenue CAGR of 13.0% and 13.2%, respectively, over FY2015-17E and
remain watchful of the company’s performance in the core software services
business.
Healthy pipeline: In terms of order flow in FY2015, HCL Tech has signed 58
transformational engagements during FY2014-15 with US$5bn+ of TCV. These
bookings saw significant momentum driven by Next-gen ITO, Engineering Services
Outsourcing, Digital, and Modern Apps deals, each of which had a component of
new technology constructs like Digitalization, Cloud etc. These engagements
reflected a broad-based spread across verticals, service lines and geographies. We
believe that sustaining the run-rate of large deal wins is a healthy sign and should
translate into better revenue visibility for the company in FY2016.
Continuing its momentum of deal wins, HCL Tech booked business in excess of
USD 1 bn in TCV in 2QFY2016, including 8 transformational deals. The broad-
based business wins, across service lines and industry verticals were driven by the
company’s next-generation offerings. Thus, on back of strong order book, the
company expects 2HFY2016 to be better than 1HFY2016.
Outlook and valuation
On the operating front, HCL Tech’s EBIT margin has been around 22.3% in
FY2015, a dip of 185bp over the previous financial year. Going ahead, the
Management expects EBIT margins to sustain at 21-22%, driven by moving work
offshore and efficiency-led gains. We expect the EBIT and PAT to post a 7.7% and
6.0% CAGR, respectively, over FY2015-17E. At the current market price, the stock
is trading at 16.4x FY2016E and 14.6x FY2017E EPS. We recommend a Buy on
the stock with a price target of `1,038.
January 27, 2016
6
HCL Technologies | 2QFY2016 Result Update
Exhibit 10: One-year forward PE (x) chart
1000.0
800.0
600.0
400.0
200.0
0.0
Price
18x
15x
12x
9x
6x
Source: Company, Angel Research
Exhibit 11: Recommendation summary
Company
Reco
CMP Tgt Price Upside
FY2017E FY2017E
FY2015-17E
FY2017E
FY2017E
(`)
(`)
(%)
EBITDA (%)
P/E (x)
EPS CAGR (%)
EV/Sales (x)
RoE (%)
HCL Tech
Buy
840
1,038
23.6
21.5
14.6
6.0
1.9
18.8
Infosys
Buy
1,138
1,306
18.4
27.5
17.3
10.6
2.9
20.1
TCS
Buy
2,306
3,168
23.8
28.5
16.7
11.8
3.3
38.9
Tech Mahindra Buy
514
646
25.6
17.0
16.1
8.0
1.4
18.6
Wipro
Buy
547
719
31.5
23.8
12.9
9.7
1.8
17.9
Source: Company, Angel Research
Company Background
HCL Tech is India's fifth largest IT services company, with over
1,00,000
employees catering to more than 450 clients. The company's service offerings
include Enterprise Application Services (EAS), Custom Applications, Engineering
and Research and Development (ERD) and Infrastructure Management Services
(IMS). In December 2008, HCL Tech acquired UK-based SAP consulting company -
Axon, which now contributes ~10% to its consolidated revenue.
January 27, 2016
7
HCL Technologies | 2QFY2016 Result Update
Profit and loss statement (Consolidated, US GAAP)
Y/E June (` cr)
FY2013
FY2014
FY2015
FY2016E
FY2017E
Net sales
25,770
32,908
37,061
42,038
47,503
Cost of revenues
16,511
20,209
23,798
27,829
31,447
Gross profit
9,259
12,699
13,263
14,209
16,056
% of net sales
35.9
38.6
35.8
33.8
33.8
SG&A expenses
3,437
4,070
4,563
5,288
5,843
% of net sales
13.3
12.4
12.3
12.6
12.3
EBITDA
5,822
8,629
8,700
8,920
10,213
% of net sales
22.6
26.2
23.5
21.2
21.5
Depreciation and amort.
674
753
451
551
651
% of net sales
2.6
2.3
1.2
1.3
1.4
EBIT
5,148
7,876
8,249
8,369
9,562
% of net sales
20.0
23.9
22.3
19.9
20.1
Other income, net
177
492
912
930
930
Profit before tax
5,325
8,369
9,161
9,299
10,492
Provision for tax
1,222
1,629
1,908
2,083
2,350
% of PBT
22.9
19.5
20.8
22.4
22.4
PAT
4,104
6,739
7,253
7,216
8,142
Share from equity invest.
-
-
-
-
-
Forex loss
(21)
(549)
-
-
-
ESOP charges
73
25
103
102
102
Reported net profit
4,082
6,190
7,253
7,216
8,142
Fully diluted EPS (`)
28.9
43.9
51.4
51.1
57.7
January 27, 2016
8
HCL Technologies | 2QFY2016 Result Update
Balance sheet (Consolidated, US GAAP)
Y/E June (` cr)
FY2013 FY2014 FY2015 FY2016E FY2017E
Cash and cash equivalent
732
1,021
1,352
3,982
8,370
Account receivables, net
4,464
5,684
6,563
7,260
8,204
Unbilled receivables
1,713
2,024
2,923
2,522
2,850
Deposit with banks
3,615
8,370
9,670
14,670
19,670
Deposit (one year with HDFC ltd)
-
-
-
-
-
Invest. securities, available for sale
634
609
767
2,250
2,250
Other current assets
1,907
2,125
2,338
2,638
2,938
Total current assets
13,065
19,833
23,613
33,323
44,282
Property and equipment, net
2,728
3,147
3,820
4,120
4,420
Intangible assets, net
4,958
5,149
5,204
5,204
5,204
Deposits with HDFC Ltd.
-
-
-
-
-
Fixed deposits with banks
-
-
-
-
-
Investment securities HTM
50
-
8
8
8
Investment in equity investee
8
16
-
16
16
Other assets
2,239
2,346
3,066
4,780
4,780
Total assets
23,048
30,490
35,711
47,450
58,710
Current liabilities
6,542
8,197
9,232
11,285
12,752
Borrowings
696
751
469
469
469
Other liabilities
1,515
1,462
1,259
2,077
2,077
Total liabilities
8,753
10,409
10,960
13,831
15,298
Minority interest
-
-
-
-
-
Total stockholder equity
14,295
20,081
24,751
33,619
43,412
Total liab. and stock holder equity
23,048
30,490
35,711
47,450
58,710
January 27, 2016
9
HCL Technologies | 2QFY2016 Result Update
Cash flow statement (Consolidated, US GAAP)
Y/E June (` cr)
FY2013
FY2014
FY2015
FY2016E
FY2017E
Pre tax profit from operations
5,021
7,797
7,253
7,216
8,142
Depreciation
674
733
451
551
651
Expenses (deffered)/written off/others
(21)
(584)
(168)
(48)
(48)
Pre tax cash from operations
5,673
7,946
7,536
7,719
8,745
Other income/prior period ad
305
572
912
930
930
Net cash from operations
5,978
8,518
8,448
8,649
9,675
Tax
(1,222)
(1,547)
(1,908)
(2,083)
(2,350)
Cash profits
4,756
6,971
6,540
6,566
7,325
(Inc)/dec in current assets
(1,219)
(1,749)
(1,991)
(596)
(1,572)
Inc/(dec) in current liabilties
1,603
1,654
1,035
2,053
1,467
Net trade working capital
384
(95)
(956)
1,456
(105)
Cashflow from operating activities
5,140
6,875
5,584
8,023
7,220
(Inc)/dec in fixed assets
(878)
(1,094)
(674)
(300)
(300)
(Inc)/dec in intangibles
(65)
(248)
(55)
-
-
(Inc)/dec in investments
(2,135)
(4,688)
(1,458)
(6,483)
(5,000)
(Inc)/dec in minority interest
-
-
-
-
-
Inc/(dec) in non current liabilities
181
(54)
(203)
818
-
(Inc)/dec in non current assets
(434)
(107)
(214)
(300)
(300)
Cashflow from investing activities
(3,330)
(6,191)
(2,602)
(6,265)
(5,600)
Inc/(dec) in debt
(1,226)
55
-
-
-
Inc/(dec) in equity/premium
-
-
-
-
-
ESOP charges
(73)
(25)
(103)
(103)
(103)
Dividends
(850)
(296)
(1,651)
(1,651)
(1,651)
Others
405
(129)
(208)
1,225
3,947
Cashflow from financing activities
(1,745)
(396)
(1,962)
(529)
2,193
Cash generated/(utilised)
65
289
331
2,630
4,388
Cash at start of the year
667
732
1,021
1,352
3,982
Cash at end of the year
732
1,021
1,352
3,982
8,370
January 27, 2016
10
HCL Technologies | 2QFY2016 Result Update
Key ratios
Y/E June
FY2013
FY2014
FY2015
FY2016E
FY2017E
Valuation ratio (x)
P/E (on FDEPS)
29.0
19.1
16.3
16.4
14.6
P/CEPS
24.9
17.1
15.4
15.3
13.5
P/BVPS
8.3
5.9
4.8
3.5
2.7
Dividend yield (%)
1.2
1.7
1.7
1.4
1.4
EV/Sales
4.4
3.3
2.9
2.3
1.9
EV/EBITDA
19.6
12.7
12.3
11.0
8.7
EV/Total assets
5.0
3.6
3.0
2.1
1.5
Per share data (`)
EPS (Fully diluted)
28.9
43.9
51.4
51.1
57.7
Cash EPS
33.7
49.2
54.6
55.0
62.3
Dividend
10.0
14.0
14.0
12.0
12.0
Book value
101
142
175
238
308
Dupont analysis
Tax retention ratio (PAT/PBT)
0.8
0.8
0.8
0.8
0.8
Cost of debt (PBT/EBIT)
1.0
1.1
1.1
1.1
1.1
EBIT margin (EBIT/Sales)
0.2
0.2
0.2
0.2
0.2
Asset turnover ratio (Sales/Assets)
1.1
1.1
1.0
0.9
0.8
Leverage ratio (Assets/Equity)
1.6
1.5
1.4
1.4
1.4
Operating ROE
28.7
33.6
29.3
21.5
18.8
Return ratios (%)
RoCE (pre-tax)
22.3
25.8
23.1
17.6
16.3
Angel RoIC
28.6
38.4
34.5
31.5
33.7
RoE
28.6
30.8
29.3
21.5
18.8
Turnover ratios (x)
Asset turnover (fixed assets)
2.7
3.2
3.3
3.2
3.3
Receivables days
59
71
68
67
67
January 27, 2016
11
HCL Technologies | 2QFY2016 Result Update
Research Team Tel: 022 - 39357800
DISCLAIMER
Angel Broking Private Limited (hereinafter referred to as “Angel”) is a registered Member of National Stock Exchange of India Limited,
Bombay Stock Exchange Limited and Metropolitan Stock Exchange of India Limited. It is also registered as a Depository Participant with
CDSL and Portfolio Manager with SEBI. It also has registration with AMFI as a Mutual Fund Distributor. Angel Broking Private Limited is
a registered entity with SEBI for Research Analyst in terms of SEBI (Research Analyst) Regulations, 2014 vide registration number
INH000000164. Angel or its associates has not been debarred/ suspended by SEBI or any other regulatory authority for accessing
/dealing in securities Market. Angel or its associates including its relatives/analyst do not hold any financial interest/beneficial
ownership of more than 1% in the company covered by Analyst. Angel or its associates/analyst has not received any compensation /
managed or co-managed public offering of securities of the company covered by Analyst during the past twelve months. Angel/analyst
has not served as an officer, director or employee of company covered by Analyst and has not been engaged in market making activity
of the company covered by Analyst.
This document is solely for the personal information of the recipient, and must not be singularly used as the basis of any investment
decision. Nothing in this document should be construed as investment or financial advice. Each recipient of this document should
make such investigations as they deem necessary to arrive at an independent evaluation of an investment in the securities of the
companies referred to in this document (including the merits and risks involved), and should consult their own advisors to determine
the merits and risks of such an investment.
Reports based on technical and derivative analysis center on studying charts of a stock's price movement, outstanding positions and
trading volume, as opposed to focusing on a company's fundamentals and, as such, may not match with a report on a company's
fundamentals.
The information in this document has been printed on the basis of publicly available information, internal data and other reliable
sources believed to be true, but we do not represent that it is accurate or complete and it should not be relied on as such, as this
document is for general guidance only. Angel Broking Pvt. Limited or any of its affiliates/ group companies shall not be in any way
responsible for any loss or damage that may arise to any person from any inadvertent error in the information contained in this report.
Angel Broking Pvt. Limited has not independently verified all the information contained within this document. Accordingly, we cannot
testify, nor make any representation or warranty, express or implied, to the accuracy, contents or data contained within this document.
While Angel Broking Pvt. Limited endeavors to update on a reasonable basis the information discussed in this material, there may be
regulatory, compliance, or other reasons that prevent us from doing so.
This document is being supplied to you solely for your information, and its contents, information or data may not be reproduced,
redistributed or passed on, directly or indirectly.
Neither Angel Broking Pvt. Limited, nor its directors, employees or affiliates shall be liable for any loss or damage that may arise from
or in connection with the use of this information.
Note: Please refer to the important ‘Stock Holding Disclosure' report on the Angel website (Research Section). Also, please refer to the
latest update on respective stocks for the disclosure status in respect of those stocks. Angel Broking Pvt. Limited and its affiliates may
have investment positions in the stocks recommended in this report.
Disclosure of Interest Statement
HCL Technologies
1. Analyst ownership of the stock
No
2. Angel and its Group companies ownership of the stock
No
3. Angel and its Group companies' Directors ownership of the stock
No
4. Broking relationship with company covered
No
Note: We have not considered any Exposure below ` 1 lakh for Angel, its Group companies and Directors
Ratings (Based on expected returns
Buy (> 15%)
Accumulate (5% to 15%)
Neutral (-5 to 5%)
over 12 months investment period):
Reduce (-5% to -15%)
Sell (< -15)
January 27, 2016
12