Company Update | Tyres
June 10, 2016
Goodyear India
BUY
CMP
`515
Company Update
Target Price
`631
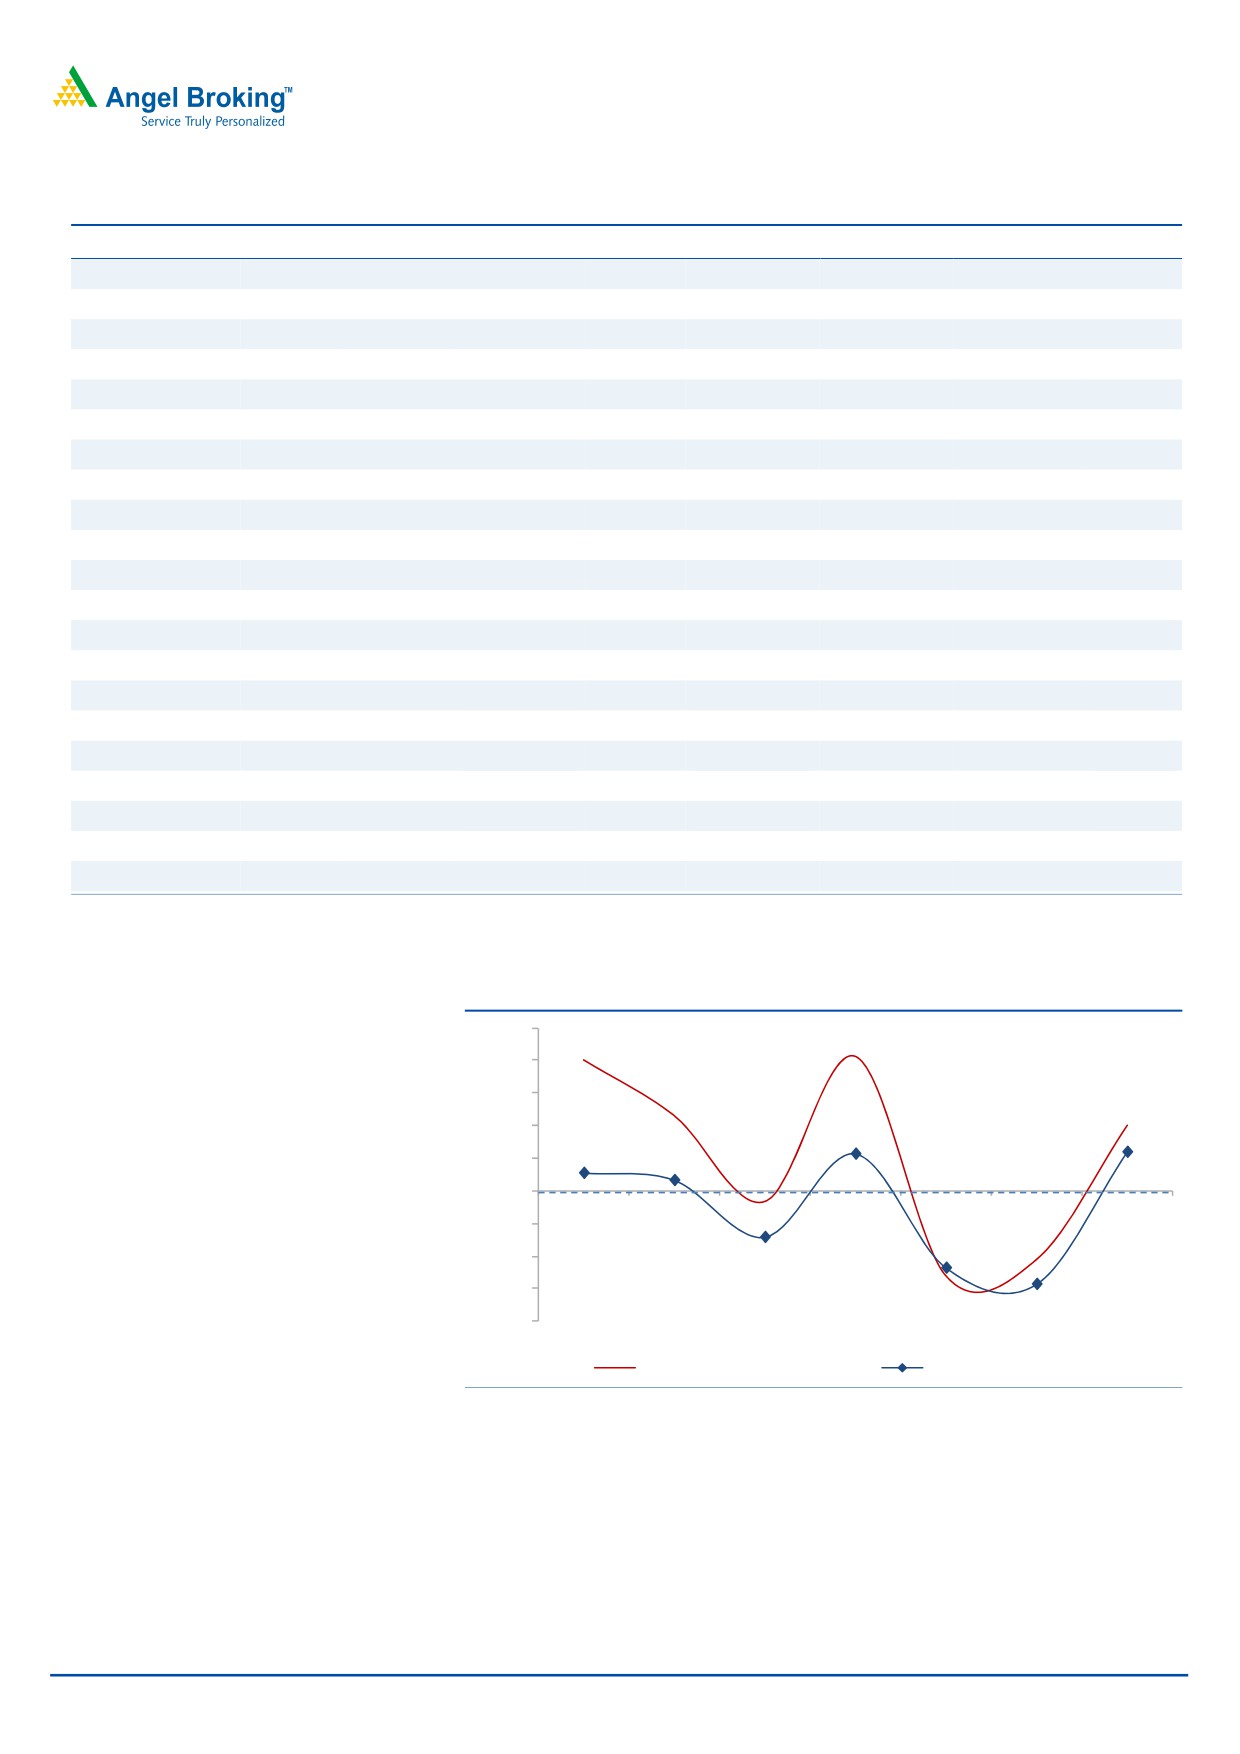
Expectation of normal monsoon to energize stagnant tractor demand: Goodyear
Investment Period
12 Months
India (GIL) is a leader in the farm tyre segment in India with it having strong tie-
ups with OEMs as well as a dominant presence in the replacement market. Farm
tyres account for ~50% of the company’s overall revenues; however, the segment
Stock Info
has been under pressure owing to poor monsoons and erratic rains in the past
Sector
Tyres
two years which has impacted tractor demand during the period. This has not
Market Cap (` cr)
1,188
only hurt OEM demand but also impacted the replacement market. Given that
tractor sales have strong correlation with monsoons, the expectation of a normal
Net Debt
(334)
monsoon this year should translate into higher tractor sales and resultantly higher
Beta
0.7
demand for tractor tyres. GIL being a market leader in tractor tyres segment should
stand to benefit on this account.
52 Week High / Low
662 / 443
Avg. Daily Volume
10,729
Expansion drive to lead to recovery in top-line: GIL has laid out plans to
significantly grow its presence in the passenger vehicle (PV) segment in India over
Face Value (`)
10
the next five years. The company aspires to be one of the top players in the mid to
BSE Sensex
26,763
premium and SUV sub-segments of PVs. It is also evaluating an entry into newer
segments; in order to reach its goal, the company is weighing organic as well as inorganic
Nifty
8,204
growth options. We believe that this increased focus on growing its presence in the PV
Reuters Code
GDYR.BO
segment and entry into newer segments will provide additional boost to the revenues.
Bloomberg Code
GDYR IN
Strong balance sheet with high RoIC: GIL is a debt free-cash rich company with
RoIC estimated at ~84% for FY2018. The company’s cash and equivalents are
`334cr for FY2016, which amount to ~28% of the current market cap. More
Shareholding Pattern (%)
importantly, GIL is one of the cheapest MNC stocks available to invest in, in the
Promoters
74.0
similar market cap range.
MF / Banks / Indian Fls
8.0
Quarterly performance: For 5QFY2016, GIL’s top-line grew by 7.3% yoy to
`295cr and the EBITDA margin stood more or less stable on a yoy basis at 9.3%
FII / NRIs / OCBs
0.0
(v/s 9.6% in the same quarter of the previous year). The margins witnessed a mild
Indian Public / Others
18.0
compression despite of a 97bp yoy decline in raw material cost/sales as other
expenses/sales expanded by 128bp yoy. Factoring this, the EBITDA grew by 3.5%
yoy to `27cr and the bottom-line remained flat at `16cr.
Abs. (%)
3m 1yr 3yr
Outlook and valuation: On an adjusted basis (for financial year end March), we
Sensex
8.3
(0.3)
37.7
expect the top-line to post a CAGR of 7.5% over FY2016-18E to `1,704cr mainly
GOODYEAR
8.0
(1.6)
60.6
on account of rebound in tractor tyre volumes. We have also considered higher
raw material costs and factored in a rubber price of ~`130/kg for FY2017E and
~`140/kg for FY2018E. As a result, the EBITDA margin is expected to be at
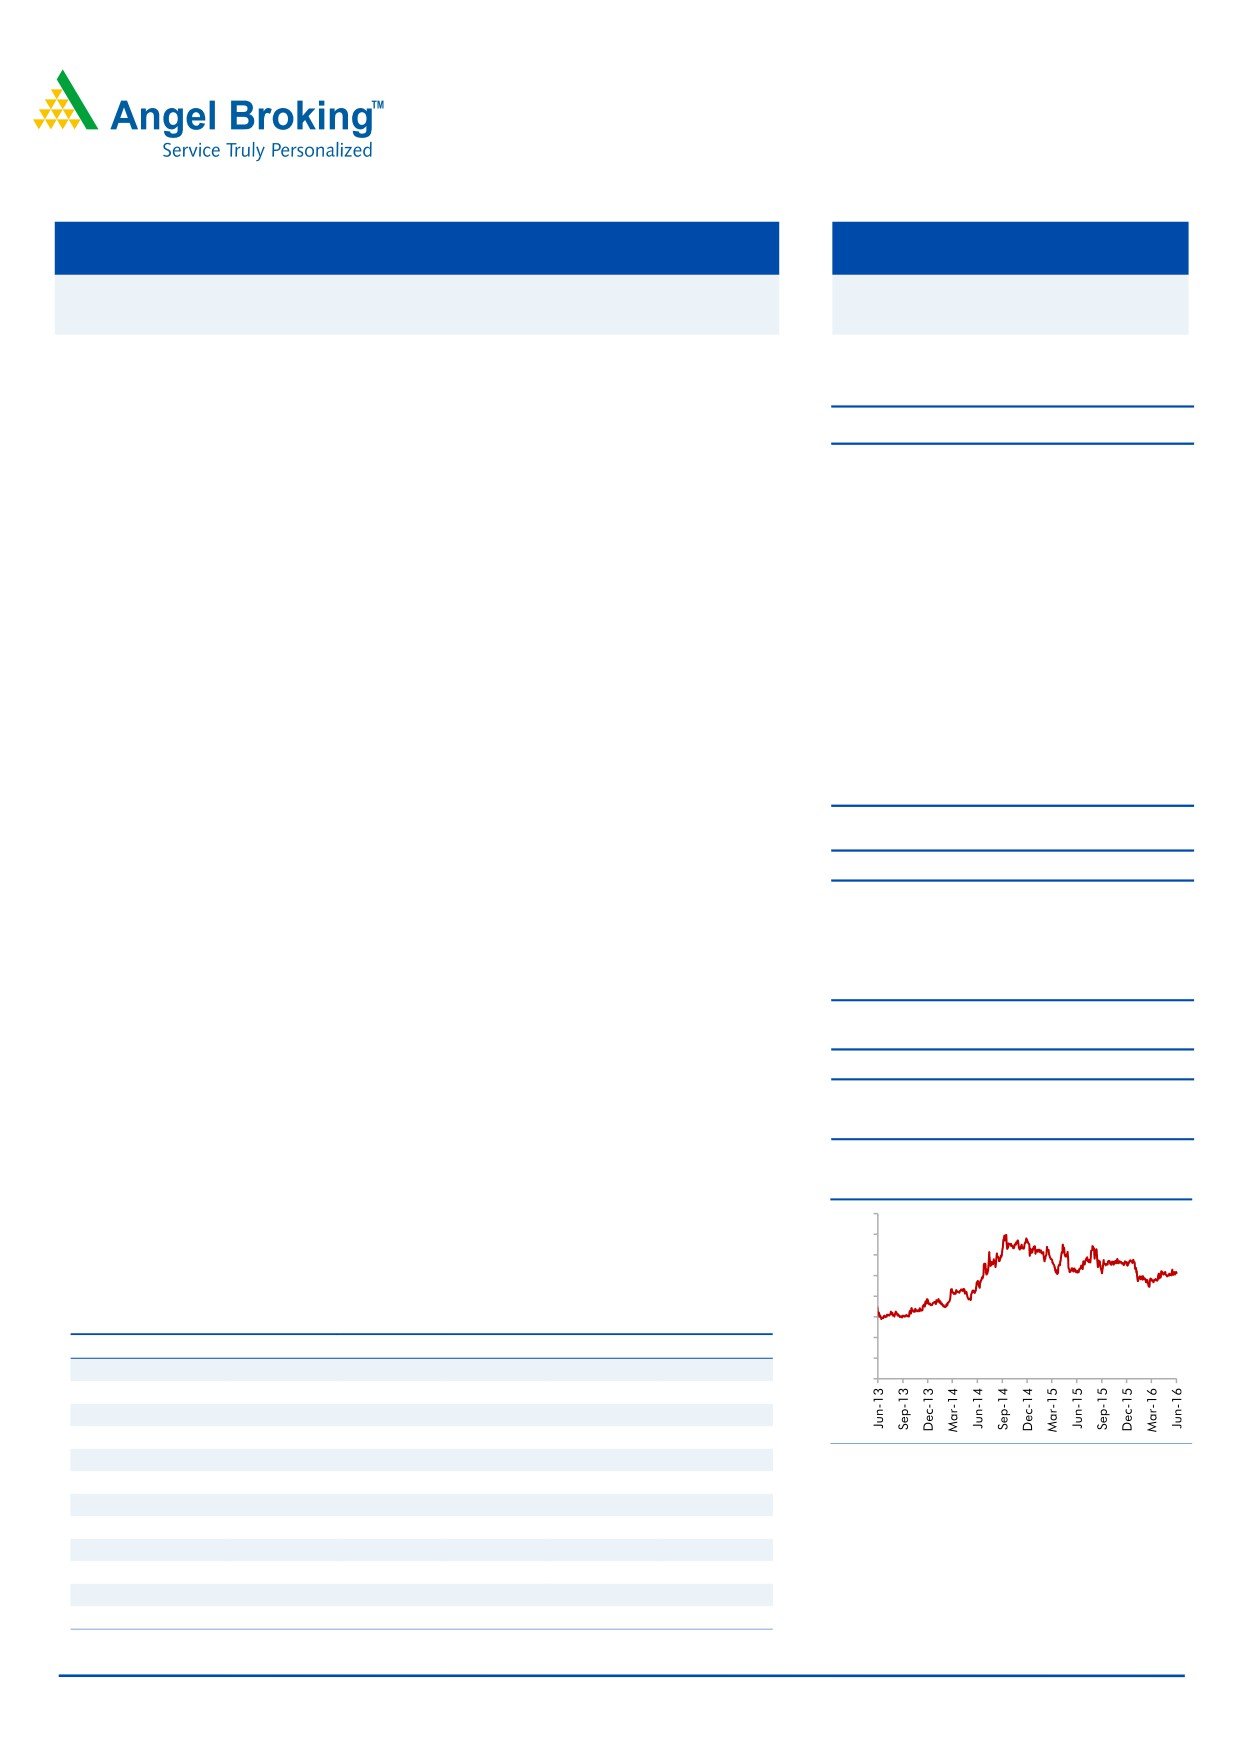
3-year Daily Price Chart
10.2% in FY2018E. Consequently, the net profit is estimated to be at `121cr in
800
FY2018E. At the current market price, the stock is trading at a PE of 9.8x its
700
600
FY2018E earnings. We maintain our Buy rating on the stock and assign a target
500
price of `631 based on a target PE of 12.0x for FY2018E.
400
Key Financials
300
200
Y/E Mar (` cr)
CY2014
FY2015 Adj FY2016 Adj
FY2017E
FY2018E
100
Net Sales
1,579
1,470
1,475
1,598
1,704
-
% chg
0.7
-
0.3
8.4
6.6
Net Profit
101
89
107
114
121
% chg
7.6
-
21.1
6.1
6.5
EBITDA (%)
9.7
9.6
11.5
10.4
10.2
Source: Company, Angel Research
EPS (`)
43.9
38.4
46.6
49.4
52.6
P/E (x)
11.7
13.4
11.1
10.4
9.8
P/BV (x)
2.4
2.3
2.0
1.8
1.6
RoE (%)
22.0
18.4
19.6
18.2
17.0
RoIC (%)
94.6
-
66.2
60.8
84.2
Milan Desai
EV/Sales (x)
0.5
-
0.6
0.4
0.3
+91- 22- 4000 3600 Ext: 6846
EV/EBITDA (x)
5.3
-
5.0
4.0
3.3
Source: Company, Angel Research; Note: *reporting changed from CY to FY starting January 2015;
FY15 & FY16 numbers have been adjusted to reflect four quarters
Please refer to important disclosures at the end of this report
1
Goodyear India | Company Update
Exhibit 1: 5QFY2016 performance
Y/E December (` cr)
5QFY16 1QCY15*
yoy chg (%)
4QFY16
qoq chg (%)
FY2016 Adj
FY2015 Adj
% chg
Net Sales
295
275
7.3
366
(19.2)
1,475
1,470
0.3
Net raw material
181
172
5.7
243
(25.2)
944
992
(4.8)
(% of Sales)
61.4
62.4
(97)bp
66.4
(493)bp
64.0
67.5
(347)bp
Staff Costs
27
25
7.7
30
(9.9)
113
102
11.0
(% of Sales)
9.0
9.0
3bp
8.1
93bp
7.7
7.0
74bp
Other Expenses
60
52
14.5
55
8.8
247
234
5.3
(% of Sales)
20.3
19.0
128bp
15.0
523bp
16.7
15.9
79bp
Total Expenditure
268
249
7.7
327
(18.1)
1,304
1,328
(1.8)
EBITDA
27
26
3.5
38
(28.7)
170
141
20.6
EBITDA margin (%)
9.3
9.6
(34)bp
10.5
(123)bp
11.5
9.6
194bp
Interest
1
1
6.7
1
(1.5)
3
3
(12.6)
Depreciation
8
9
(5.7)
8
7.8
32
31
3.5
Other Income
7
7
(0.6)
10.0
(34.3)
30
27
9.2
PBT
25
24
5.7
40
(37.5)
166
135
12.6
(% of Sales)
8.5
8.6
11.0
11.2
9.2
Tax
9
8
14
58
46
(% of PBT)
36.0
34.4
35.1
35.1
34.1
Reported PAT
16
16
3.1
26
(38.3)
107
89
21.1
PATM
5.4
5.7
7.1
7.3
6.0
Equity capital (cr)
23
23
23
23
23
EPS (`)
7
7
3.1
11
(38.3)
47
38
21.1
Source: Company, Angel Research; *reporting changed from CY to FY starting January 2015
Exhibit 2: Correlation between monsoon & tractor sales
25.0
20.0
15.0
10.0
5.0
-
(5.0)
(10.0)
(15.0)
(20.0)
FY11
FY12
FY13
FY14
FY15
FY16
FY17E
Tractor Sales Volumes yoy
Historical trend in Monsoon
Source: Company, Angel Research
June 10, 2016
2
Goodyear India | Company Update
Company Background
GIL is a subsidiary of Goodyear Orient Company (Private) Ltd (a wholly owned
subsidiary of Goodyear Tire and Rubber Company, USA), which holds a 74% stake
in the company. The Company manufactures automotive bias tyres viz. farm tyres
and commercial truck tyres at its Ballabgarh plant and also trades in “Goodyear”
branded tyres [including radial passenger and Off The Road (OTR) bias tyres]
manufactured by Goodyear South Asia Tyres Private Limited (GSATPL),
Aurangabad. The other products in which the Company markets and sells include
tubes, flaps and Radial OTR imported tyres. GIL is a leader in the farm tyre
segment in India with it having strong tie-ups with OEMs as well as a dominant
presence in the replacement market. Farm tyres account for ~50% of the
company’s overall revenues.
June 10, 2016
3
Goodyear India | Company Update
Profit & Loss Statement
Y/E December (` cr)
CY2014
FY2015 Adj.
FY2016 Adj.
FY2017E
FY2018E
Total operating income
1,579
1,470
1,475
1,598
1,704
% chg
0.7
-
0.3
8.4
6.6
Net Raw Materials
1,094
992
944
1,059
1,133
Personnel
99
102
113
120
127
Other
232
234
247
254
271
Total Expenditure
1,426
1,328
1,304
1,433
1,531
EBITDA
154
141
170
165
173
% chg
10.5
-
10.9
(2.8)
4.7
(% of Net Sales)
9.7
9.6
11.5
10.4
10.2
Depreciation
29
31
32
34
36
EBIT
125
111
139
131
137
% chg
9.9
-
10.7
(5.2)
4.1
(% of Net Sales)
7.9
7.5
9.4
8.2
8.0
Interest & other charges
3
3
3
1
1
Other Income
32
27
30
40
46
(% of sales)
2.0
1.8
2.0
2.5
2.7
PBT
154
135
166
170
181
% chg
8.2
-
7.8
2.8
6.5
Tax
52
46
58
56
60
(% of PBT)
34.0
34.1
35.1
33.0
33.0
PAT (reported)
101
89
107
114
121
Extraordinary (Exp)/Inc.
-
-
-
-
-
ADJ. PAT
101
89
107
114
121
% chg
7.6
-
22.4
6.1
6.5
(% of Net Sales)
6.4
6.0
7.3
7.1
7.1
Basic EPS (`)
43.9
38.4
46.6
49.4
52.6
Fully Diluted EPS (`)
43.9
38.4
46.6
49.4
52.6
% chg
7.6
-
22.4
6.1
6.5
Note: *reporting changed from CY to FY starting January 2015; FY15 & FY16 numbers have been
adjusted to reflect four quarters
June 10, 2016
4
Goodyear India | Company Update
Balance Sheet
Y/E December (` cr)
CY2013
CY2014
FY2016*
FY2017E
FY2018E
SOURCES OF FUNDS
Equity Share Capital
23
23
23
23
23
Preference Capital
-
-
-
-
-
Reserves& Surplus
400
474
559
645
739
Shareholders’ Funds
424
497
582
668
762
Minority Interest
-
-
-
-
-
Total Loans
-
-
-
-
-
Deferred Tax Liability
13
14
10
10
10
Other Long Term Liabilities
3
5
2
2
2
Long Term Provisions
20
21
19
17
18
Total Liabilities
459
536
613
697
792
APPLICATION OF FUNDS
Gross Block
430
481
517
553
592
Less: Acc. Depreciation
220
241
282
316
352
Net Block
210
240
235
237
239
Capital Work-in-Progress
32
17
14
10
10
Goodwill
-
-
-
-
-
Investments
-
-
-
-
-
Long Term Loans and adv.
17
19
22
22
22
Other non-current assets
0
1
1
1
1
Current Assets
600
617
649
822
942
Cash
317
365
334
520
624
Loans & Advances
10
6
17
16
17
Inventory
99
123
129
120
125
Debtors
165
112
158
154
164
Other Current Assets
9
10
12
12
12
Current liabilities
400
358
309
396
423
Net Current Assets
200
259
340
426
519
Misc. Exp. not written off
-
-
-
-
-
Total Assets
459
536
613
697
792
Note: *reporting changed from CY to FY starting January 2015
June 10, 2016
5
Goodyear India | Company Update
Cash Flow Statement
Y/E December (` cr)
CY2013
CY2014
FY2016* FY2017E FY2018E
Profit before tax
142
154
190
170
181
Depreciation
25
29
41
34
36
Change in Working Capital
29
(11)
(112)
100
12
Other income
(30)
(32)
(36)
(40)
(46)
Direct taxes paid
(48)
(52)
(66)
(56)
(60)
Others
14
12
-
-
-
Cash Flow from Operations
131
99
17
208
124
(Inc.)/Dec. in Fixed Assets
(46)
(36)
(34)
(32)
(39)
(Inc.)/Dec. in Investments
-
-
(4)
-
-
(Incr)/Decr In L.T. loan and adv.
2
(2)
(4)
-
-
Other income
30
32
36
40
46
Others
(18)
(17)
-
-
-
Cash Flow from Investing
(32)
(24)
(6)
8
7
Issue of Equity
-
-
-
-
-
Inc./(Dec.) in loans
-
2
(7)
(0)
0
Inc./(Dec.) in L.T. Pro. & Liab.
1
1
(2)
(2)
1
Dividend Paid (Incl. Tax)
(24)
(28)
(33)
(28)
(28)
Others
3
(2)
-
-
-
Cash Flow from Financing
(21)
(27)
(42)
(30)
(27)
Inc./(Dec.) in Cash
78
48
(31)
186
104
Opening Cash balances
238
317
365
334
520
Closing Cash balances
317
365
334
520
624
Note: *reporting changed from CY to FY starting January 2015
June 10, 2016
6
Goodyear India | Company Update
Key Ratios
Y/E December
CY2014
FY2015 Adj.
FY2016 Adj.
FY2017E
FY2018E
Valuation Ratio (x)
P/E (on FDEPS)
11.7
13.4
11.1
10.4
9.8
P/CEPS
9.2
9.9
8.5
8.0
7.5
P/BV
2.4
2.3
2.0
1.8
1.6
Dividend yield (%)
1.9
-
2.3
1.9
1.9
EV/Sales
0.5
-
0.6
0.4
0.3
EV/EBITDA
5.4
-
5.0
4.1
3.3
EV / Total Assets
1.5
-
1.4
1.0
0.7
Per Share Data (`)
EPS (Basic)
43.9
38.4
46.6
49.4
52.6
EPS (fully diluted)
43.9
38.4
46.6
49.4
52.6
Cash EPS
56.3
51.8
60.3
64.2
68.4
DPS
10.0
-
12.0
10.0
10.0
Book Value
215.4
222.1
252.4
289.7
330.3
Returns (%)
ROCE (Pre-tax)
25.1
-
27.2
20.1
18.4
Angel ROIC (Pre-tax)
94.6
-
74.7
59.4
79.1
ROE
22.0
18.4
19.6
18.2
17.0
Turnover ratios (x)
Asset Turnover
3.5
-
2.9
3.0
3.0
Inventory / Sales (days)
26
-
31
29
27
Receivables (days)
32
-
33
33
33
Payables (days)
126
-
129
130
130
WC (ex-cash) (days)
(26)
-
(12)
(9)
(19)
Solvency ratios (x)
Net debt to equity
(0.7)
-
(0.6)
(0.8)
(0.8)
Net debt to EBITDA
(2.4)
-
(2.0)
(3.1)
(3.5)
Interest Coverage
36.7
36.6
52.5
111.6
108.9
Note: *reporting changed from CY to FY starting January 2015; FY15 & FY16 numbers have been
adjusted to reflect four quarters
June 10, 2016
7
Goodyear India | Company Update
Research Team Tel: 022 - 39357800
DISCLAIMER
Angel Broking Private Limited (hereinafter referred to as “Angel”) is a registered Member of National Stock Exchange of India Limited,
Bombay Stock Exchange Limited and Metropolitian Stock Exchange of India Limited. It is also registered as a Depository Participant
with CDSL and Portfolio Manager with SEBI. It also has registration with AMFI as a Mutual Fund Distributor. Angel Broking Private
Limited is a registered entity with SEBI for Research Analyst in terms of SEBI (Research Analyst) Regulations, 2014 vide registration
number INH000000164. Angel or its associates has not been debarred/ suspended by SEBI or any other regulatory authority for
accessing /dealing in securities Market. Angel or its associates including its relatives/analyst do not hold any financial
interest/beneficial ownership of more than 1% in the company covered by Analyst. Angel or its associates/analyst has not received any
compensation / managed or co-managed public offering of securities of the company covered by Analyst during the past twelve
months. Angel/analyst has not served as an officer, director or employee of company covered by Analyst and has not been engaged in
market making activity of the company covered by Analyst.
This document is solely for the personal information of the recipient, and must not be singularly used as the basis of any investment
decision. Nothing in this document should be construed as investment or financial advice. Each recipient of this document should
make such investigations as they deem necessary to arrive at an independent evaluation of an investment in the securities of the
companies referred to in this document (including the merits and risks involved), and should consult their own advisors to determine
the merits and risks of such an investment.
Reports based on technical and derivative analysis center on studying charts of a stock's price movement, outstanding positions and
trading volume, as opposed to focusing on a company's fundamentals and, as such, may not match with a report on a company's
fundamentals.
The information in this document has been printed on the basis of publicly available information, internal data and other reliable
sources believed to be true, but we do not represent that it is accurate or complete and it should not be relied on as such, as this
document is for general guidance only. Angel Broking Pvt. Limited or any of its affiliates/ group companies shall not be in any way
responsible for any loss or damage that may arise to any person from any inadvertent error in the information contained in this report.
Angel Broking Pvt. Limited has not independently verified all the information contained within this document. Accordingly, we cannot
testify, nor make any representation or warranty, express or implied, to the accuracy, contents or data contained within this document.
While Angel Broking Pvt. Limited endeavors to update on a reasonable basis the information discussed in this material, there may be
regulatory, compliance, or other reasons that prevent us from doing so.
This document is being supplied to you solely for your information, and its contents, information or data may not be reproduced,
redistributed or passed on, directly or indirectly.
Neither Angel Broking Pvt. Limited, nor its directors, employees or affiliates shall be liable for any loss or damage that may arise from
or in connection with the use of this information.
Note: Please refer to the important ‘Stock Holding Disclosure' report on the Angel website (Research Section). Also, please refer to the
latest update on respective stocks for the disclosure status in respect of those stocks. Angel Broking Pvt. Limited and its affiliates may
have investment positions in the stocks recommended in this report.
Disclosure of Interest Statement
Goodyear India
1. Analyst ownership of the stock
No
2. Angel and its Group companies ownership of the stock
No
3. Angel and its Group companies' Directors ownership of the stock
No
4. Broking relationship with company covered
No
Note: We have not considered any Exposure below ` 1 lakh for Angel, its Group companies and Directors
Ratings (Based on expected returns
Buy (> 15%)
Accumulate (5% to 15%)
Neutral (-5 to 5%)
over 12 months investment period):
Reduce (-5% to -15%)
Sell (< -15%)
June 10, 2016
8