1QFY2017 Result Update | Pharmaceutical
August 4, 2016
GlaxoSmithKline Pharmaceuticals
NEUTRAL
CMP
`3,139
Performance Highlights
Target Price
-
Y/E Mar (` cr)
1QFY2017 4QFY2016
% chg (QoQ) 1QFY2016
% chg (YoY)
Investment Period
-
Net Sales
685
686
(0.1)
622
10.2
Stock Info
Other income
44
31
42.2
46
(4.0)
Sector
Pharmaceutical
Gross profit
371
377
(1.6)
342
8.5
Market Cap (` cr)
27,015
Operating profit
70
122
(42.4)
104
(32.5)
Net Debt (` cr)
(1,055)
Adj. PAT
71
95
(25.5)
95
(25.2)
Beta
0.43
Source: Company, Angel Research
52 Week High / Low
3,850/3,036
Avg. Daily Volume
1,791
For 1QFY2017, sales stood at `685cr V/s `700cr expected and V/s `622cr in
Face Value (`)
10
1QFY2016, a yoy growth of 10.2%. The sales growth has been impacted on
BSE Sensex
27,982
back of the pricing cuts implemented by the government. On the operating front,
Nifty
8,623
the OPM came in at 10.2% V/s 16.7% in 1QFY2016 and V/s 17.0% expected.
Reuters Code
GLAX.BO
The company’s OPM was impacted by other expenses, which grew by 40.5%
Bloomberg Code
GLXO@IN
yoy. Thus, the company posted an Adj. net profit of `71cr V/s `95cr in
1QFY2016, a yoy de-growth of 25.2%. We maintain our Neutral rating.
Shareholding Pattern (%)
Results below expectations: For 1QFY2017, sales stood at `685cr V/s `700cr
Promoters
75.0
expected and V/s `622cr in 1QFY2016, a yoy growth of 10.2%. The sales
MF / Banks / Indian Fls
10.4
growth has been impacted on back of the pricing cuts implemented by the
FII / NRIs / OCBs
2.6
government. On the operating front, the OPM came in at 10.2% V/s 16.7% in
Indian Public / Others
12.0
1QFY2016 and V/s 17.0% expected. The company’s OPM was impacted by
other expenses, which grew by 40.5% yoy. Thus, the company posted an Adj. net
profit of `71cr V/s `95cr in 1QFY2016, a yoy de-growth of 25.2%..
Abs. (%)
3m 1yr
3yr
Sensex
10.0
(0.5)
46.0
Outlook and valuation: The company has a strong balance sheet with cash of
Glaxo
(13.1)
(9.1)
40.4
~`2,000cr, which could be used for future acquisitions or higher dividend pay
outs. On the operational front, we expect the company’s net sales to post a
CAGR of 13.4% to `3,527cr and EPS to register a mere CAGR of 15.9% to `59.4
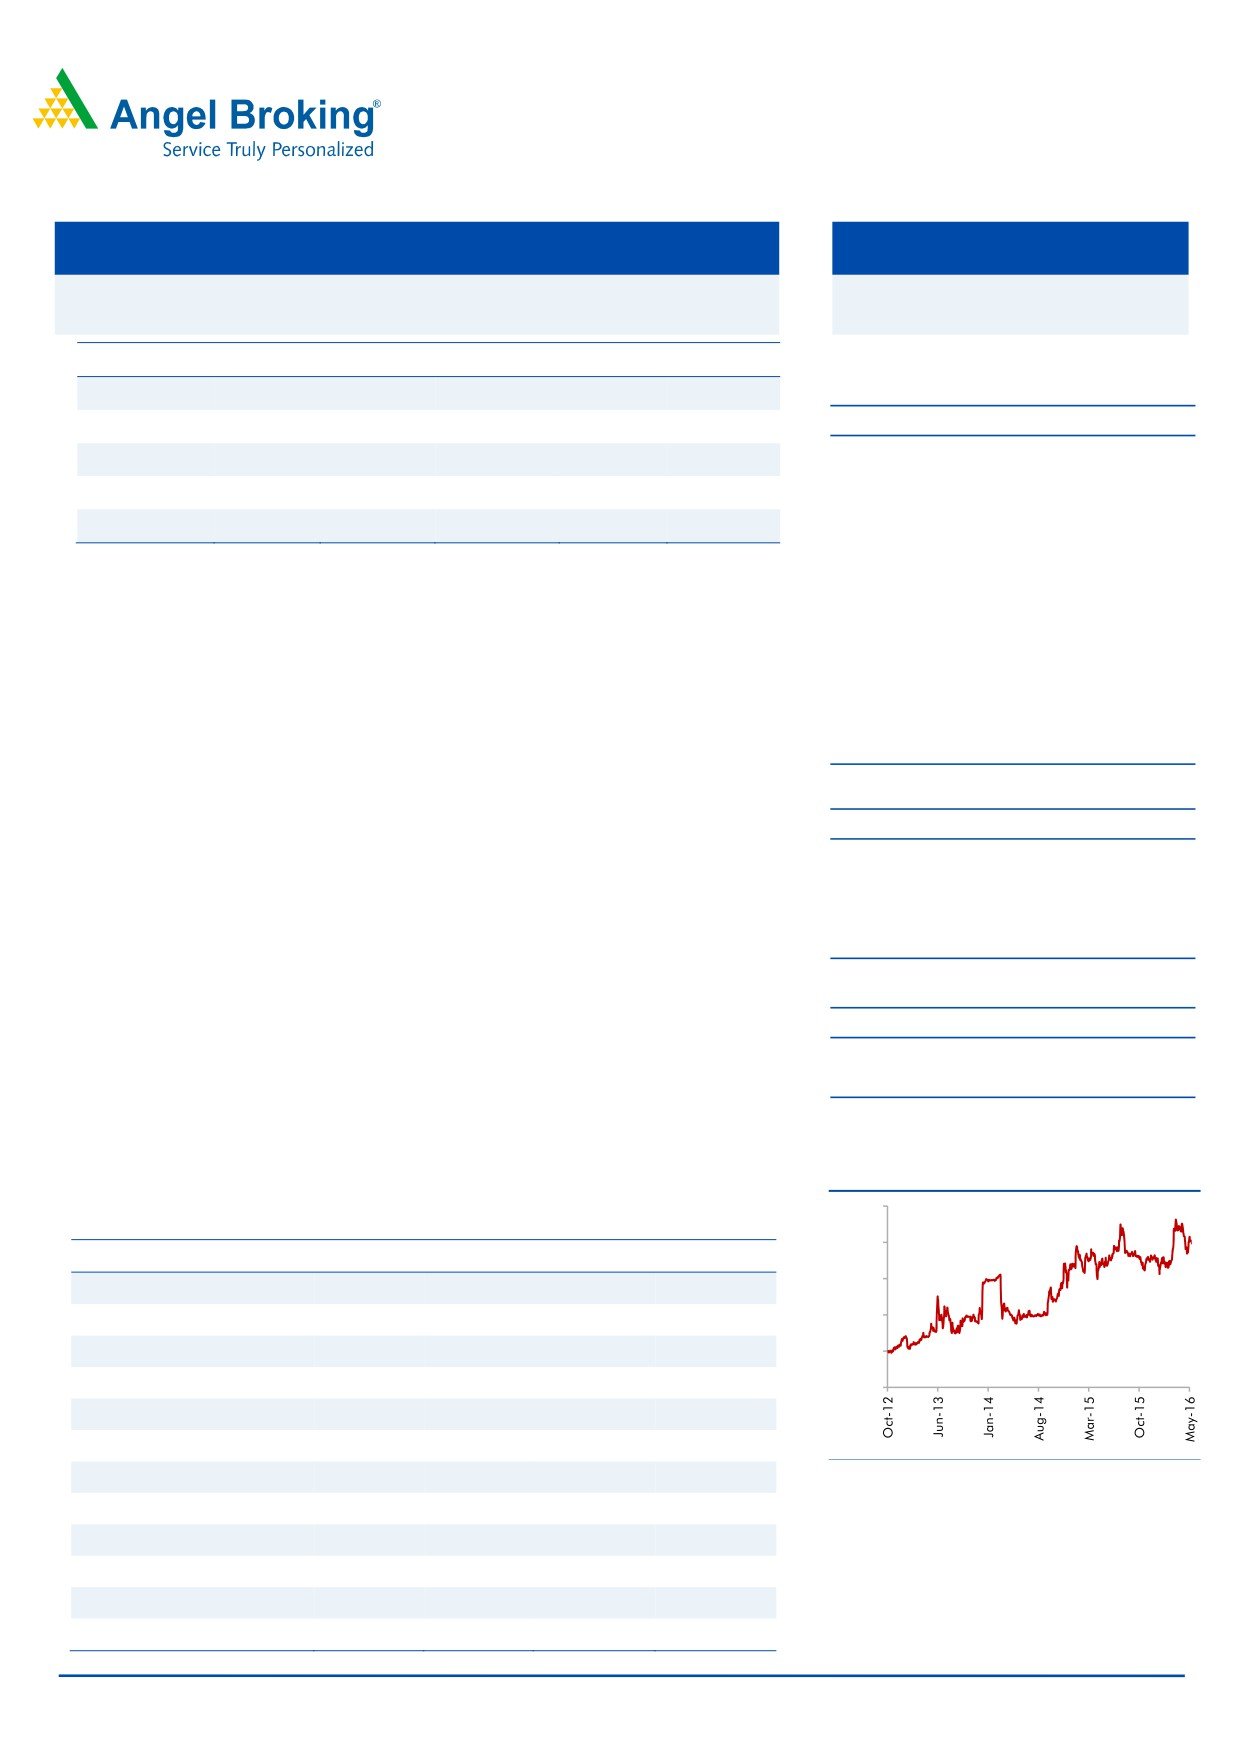
3-year price chart
over FY2016-18E. We remain Neutral on the stock.
4,000
Key financials (Consolidated)
3,500
Y/E Mar (` cr)
FY2015*
FY2016
FY2017E
FY2018E
3,000
Net sales
3,272
2,741
3,200
3,527
2,500
% chg
28.9
(16.2)
16.7
10.2
Net profit
509
374
439
503
2,000
% chg
9.8
(26.5)
17.3
14.6
1,500
EPS (`)
60.1
44.2
51.8
59.4
EBITDA (%)
17.8
16.5
16.6
18.8
P/E (x)
52.2
71.1
60.6
52.9
Source: Company, Angel Research
RoE (%)
26.7
21.2
26.3
30.6
RoCE (%)
26.7
21.7
26.3
33.5
P/BV (x)
14.5
15.7
16.2
16.1
Sarabjit Kour Nangra
EV/Sales (x)
7.5
9.2
8.0
7.3
+91 22 39357800 Ext: 6806
EV/EBITDA (x)
42.4
55.9
48.1
38.7
Source: Company, Angel Research; Note: CMP as of August 3, 2016; * 15 months numbers
Please refer to important disclosures at the end of this report
1
Glaxo Pharma | 1QFY2017 Result Update
Exhibit 1: 1QFY2017 - Standalone performance
Y/E March (` cr)
1QFY2017
4QFY2016
% chg (QoQ) 1QFY2016
% chg (YoY)
FY2016
FY2015
% chg
Net Sales
685
686
(0.1)
622
10.2
2,741
3,272
(16.2)
Other income
44
31
42.2
46
(4.0)
153
233
(34.5)
Total Income
729
717
1.7
668
9.2
2,894
3,505
(17.4)
Gross profit
371
377
(1.6)
342
8.5
1,503
1,748
(14.0)
Gross margin
54.1
55.0
55.0
54.8
53.4
Operating profit
70
122
(42.4)
104
(32.5)
452
599
(24.6)
Operating margin (%)
10.2
17.8
16.7
16.5
18.3
Interest
0
0
-
0
-
0
0
-
Depreciation & Amortization
5
7
(20.1)
5
7.4
25
25
(0.9)
PBT & Exceptional Items
109
146
(25.5)
145
(24.8)
579
806
(28.1)
Less : Exceptional Items
2
16
-
(2)
-
3
(52)
Profit before tax
111
162
(31.8)
143
(22.5)
582
754
(22.8)
Provision for taxation
39
56
(31.7)
49
(21.3)
203
277
(26.8)
Reported PAT
72
106
(31.8)
94
(23.1)
377
476
(20.9)
Adj. Net profit
71
95
(25.5)
95
(25.2)
375
509
(26.3)
EPS (`)
8.4
11.3
11.2
44.3
60.1
Source: Company, Angel Research, Note- Full year numbers are consolidated numbers
Exhibit 2: 1QFY2017 - Actual Vs Angel estimates
(` cr)
Actual
Estimates
Variation (%)
Net sales
685
700
(2.1)
Other income
44
44
0.0
Operating profit
70
119
(41.0)
Tax
39
54
(28.1)
Adj. net profit
71
102
(30.4)
Source: Company, Angel Research
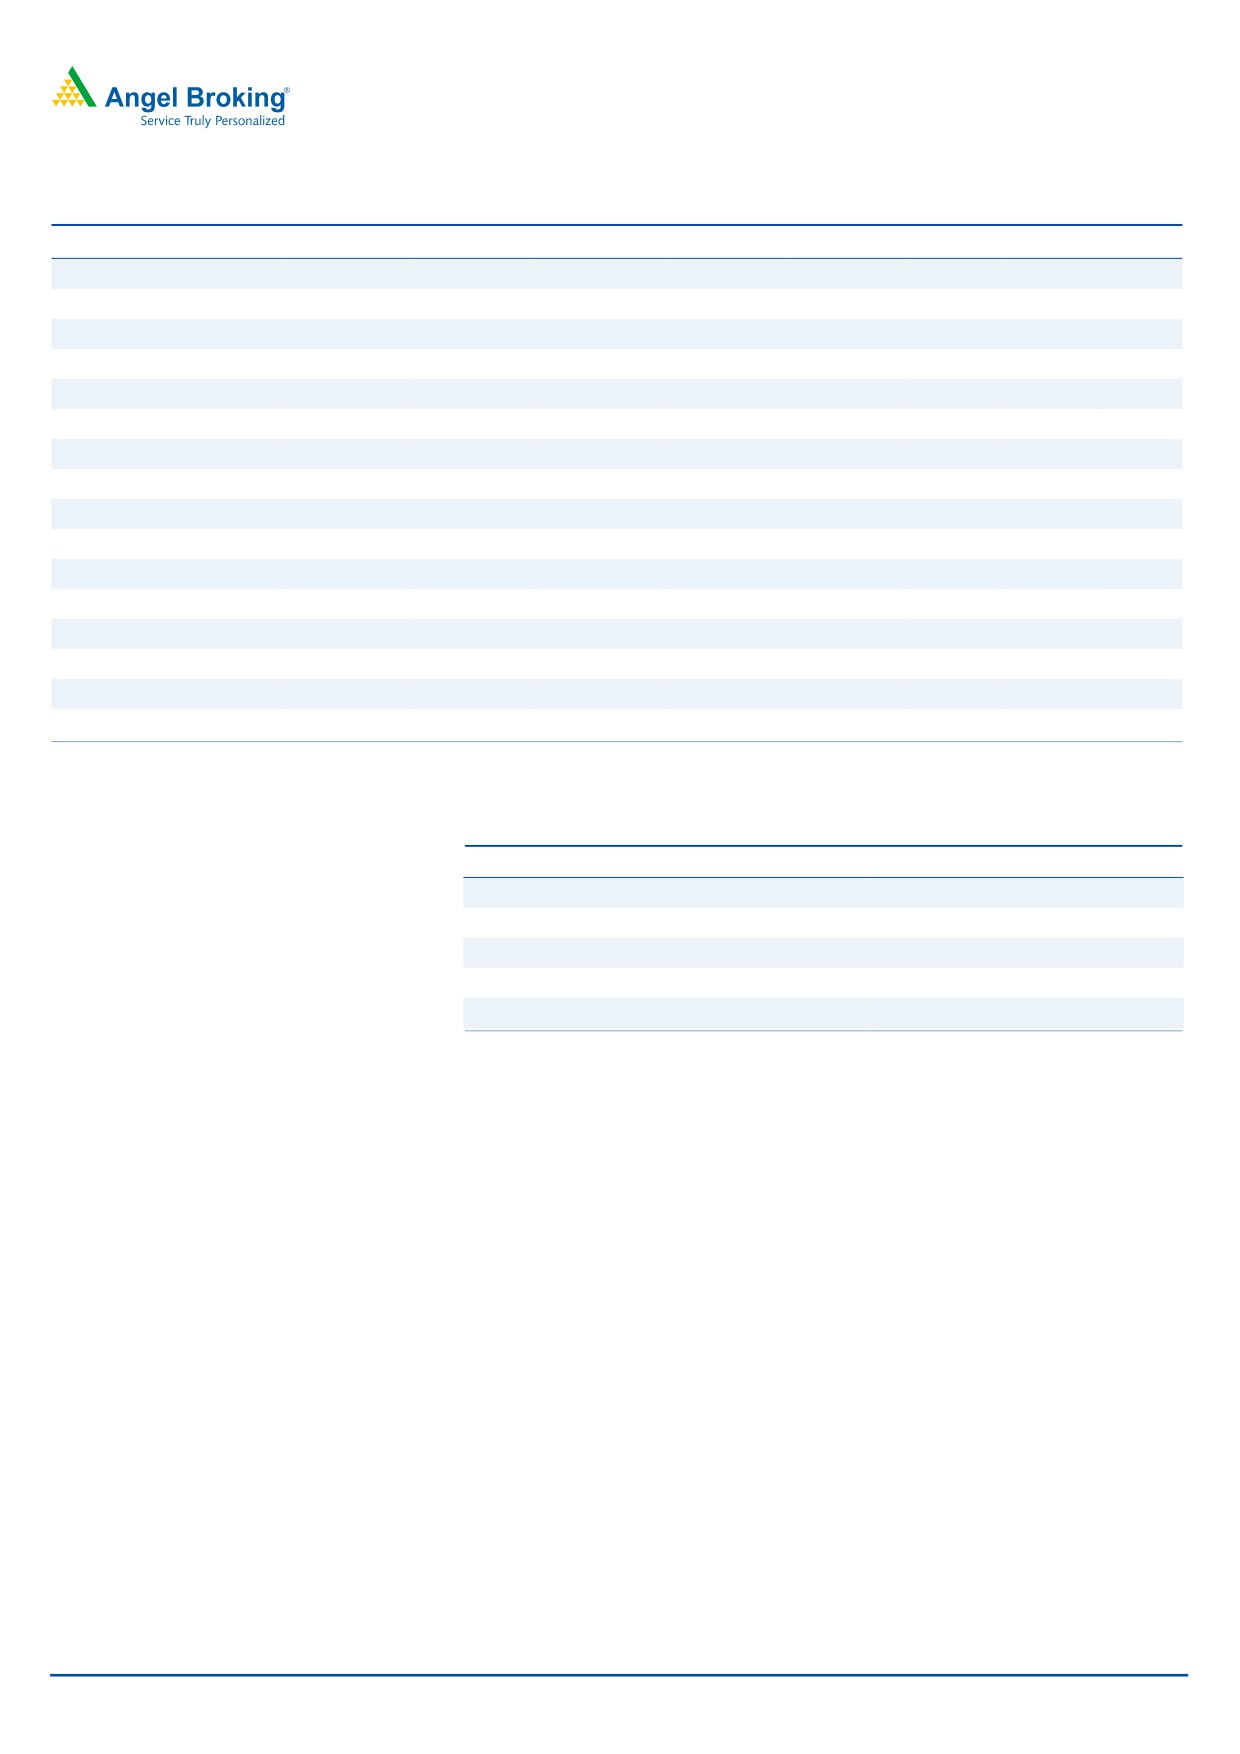
Revenue grew by 10.2%
Sales grew 10.2% yoy to `685cr (V/s `700cr expected). Total sales growth includes
~4% yoy growth from the vaccines asset sale agreement with Novartis India. The
impact of new DPCO list, FDC ban and WPI deflation would be ~3% on the
company’s annual sales or possibly lower.
August 4, 2016
2
Glaxo Pharma | 1QFY2017 Result Update
Exhibit 3: Sales trend
800
40.0
729
35.0
692
30.0
686
685
700
25.0
622
20.0
600
15.0
10.0
5.0
500
0.0
(5.0)
400
(10.0)
1QFY2016
2QFY2016
3QFY2016
4QFY2016
1QFY2017
Sales
Growth (YoY)
Source: Company, Angel Research
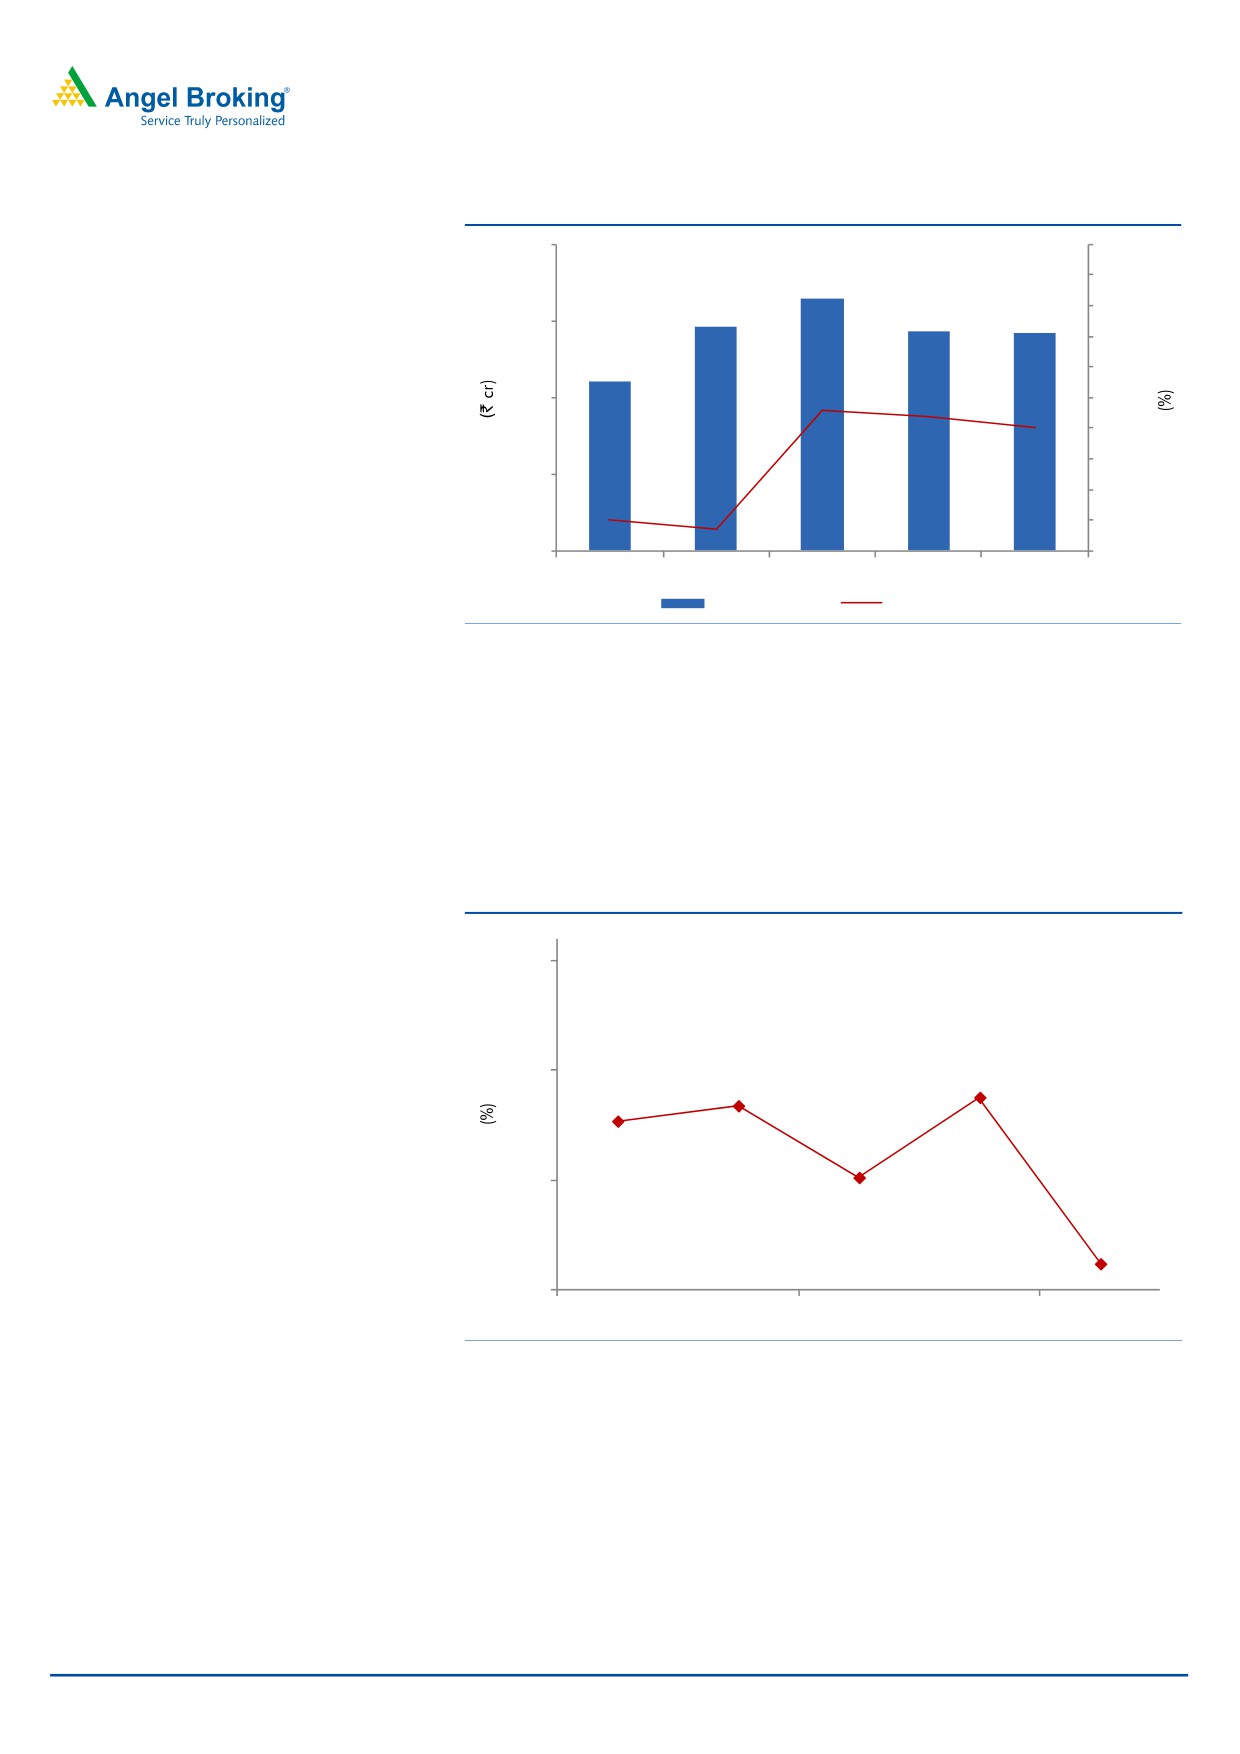
OPM comes in lower on a yoy basis at 10.2%
On the operating front, the gross margin came in at 54.1% V/s 55.0% in
1QFY2016. The OPM came in lower at 10.2% V/s 16.7% in 1QFY2016 and V/s
our expectation of 17.0%, mainly on back of a yoy growth of 40.5% in other
expenses.
Exhibit 4: OPM trend
24.0
19.0
17.4
17.8
16.7
14.1
14.0
10.2
9.0
1QFY2016
2QFY2016
3QFY2016
4QFY2016
1QFY2017
Source: Company, Angel Research
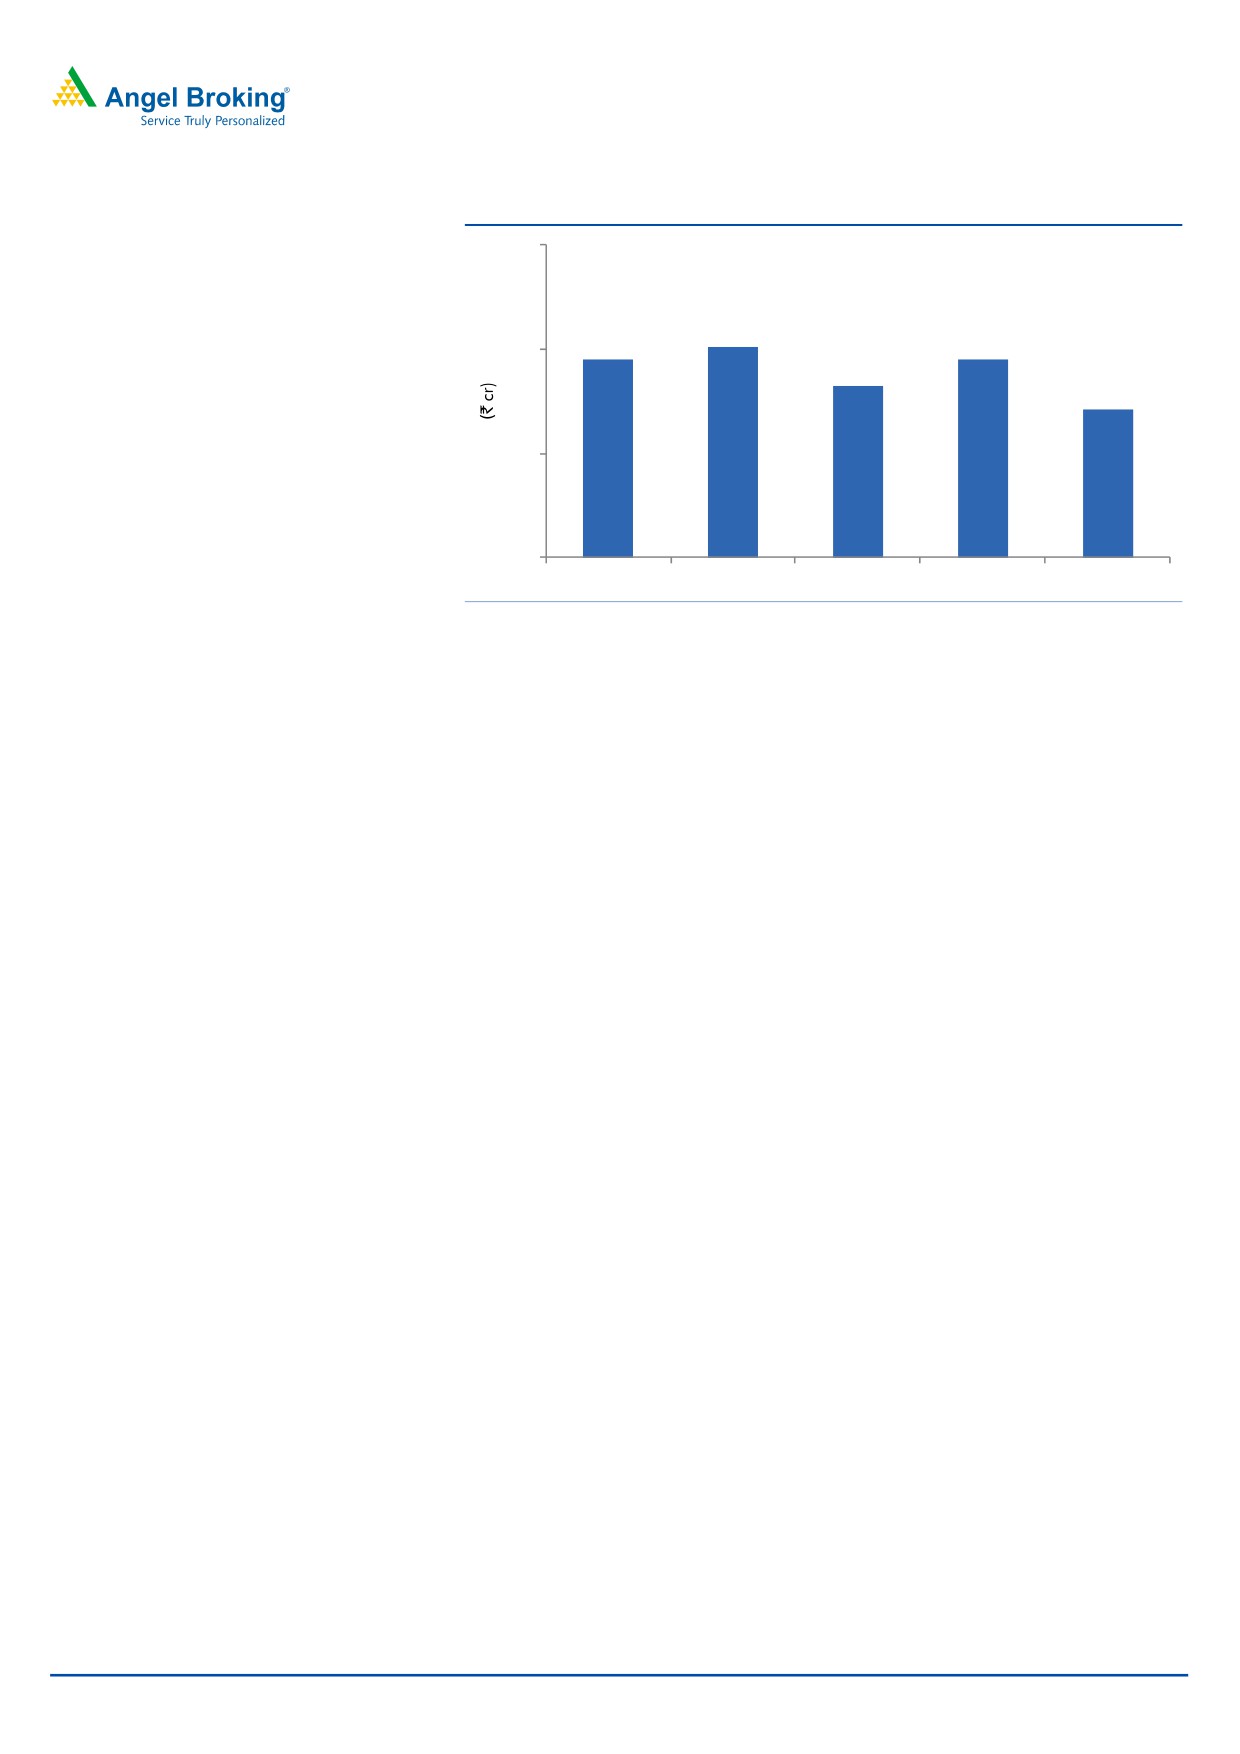
Net profit lower than estimated
The reported net profit came in at `72cr V/s `93cr in 1QFY2017. The Adj. net
profit came in at `71cr V/s `95cr in 1QFY2017, ie a yoy de-growth of 25.2% and
lower than our expectation of `102cr.
August 4, 2016
3
Glaxo Pharma | 1QFY2017 Result Update
Exhibit 5: Adjusted net profit trend
150
101
95
95
100
82
71
50
0
1QFY2016
2QFY2016
3QFY2016
4QFY2016
1QFY2017
Source: Company, Angel Research
August 4, 2016
4
Glaxo Pharma | 1QFY2017 Result Update
Recommendation rationale
Renewed focus on the Indian market: GSK is among the top ten players in the
Indian pharmaceutical market, having a market share of ~3.7%. Unlike other
MNCs, the company has been amongst the few which have taken initiatives to
grow their businesses in the Indian market with consistent launch of new products.
Over the last six years, the company has strategically decided to expand its
presence in the Specialty segment. The Specialty segment’s contribution to sales
has reached 23% (as of 2013). Another segment which is strong for the company
is the area of vaccine, where GSK Vaccines has become the leading company in
the private market for vaccines in India. The recently introduced vaccine for
pneumococcal conjugate disease, Synflorix, has become the biggest brand in the
vaccine portfolio of the company in the second year of its launch. The efforts of the
company in raising awareness about vaccines and preventable diseases continue
with increasing fervor. Also, in FY2015, GlaxoSmithKline Plc (Glaxo), London, UK,
entered into three inter-conditional agreements with Novartis AG (Novartis), Basel,
Switzerland. In one such agreement Glaxo agreed to acquire Novartis’ vaccines
business (excluding influenza vaccine) and its manufacturing capabilities and
facilities, and in the second agreement, Glaxo agreed to sell the rights of its
Marketed Oncology Portfolio, related R&D activities and AKT Inhibitors currently in
development to Novartis. Globally, these transactions with Novartis were
completed on March 2, 2015.
On the other hand, its other key segments like mass markets and mass specialty,
which contribute 60% of its sales, de-grew by 12% in CY2013. This was as a result
of a number of products of the company having come under the DPCO 2013
ruling, resulting in reduction in prices of its drugs, which impacted its sales in
CY2013. Along with this, the supply constraints, mainly from local supplies during
FY2015, have been impacting its performance. However, going forward, with
company’s own facilities coming on stream in FY2017, we expect the volatility in
sales to end. Overall, for FY2016-18E, we expect the domestic formulation
business of the company to grow at a CAGR of 13.4%.
Significant capex plans ahead indicate revival in growth: Global pharmaceutical
major Glaxo announced an `864cr investment in India to set up a medicine
manufacturing unit. The new facility will substantially increase the company’s
manufacturing base. The drug maker is proactively building capacity in the country
as it delivers its portfolio of products in areas such as gastroenterology and anti-
inflammatory medicines. When complete, the factory will make pharmaceutical
products for the Indian market at a rate of up to 8bn tablets and 1bn capsules a
year. The facility, expected to be operational by 2017, will include a warehouse,
site infrastructure, and utilities to support the manufacturing and packing of
medicines. It showcases GSK's latest commitment to its manufacturing network in
India where the company has invested `1,017cr over the last decade. The
development is positive and comes after a long lull in terms of investments.
August 4, 2016
5
Glaxo Pharma | 1QFY2017 Result Update
Outlook and valuation
GSK has a strong balance sheet with cash of ~`2,000cr, which could be used for
future acquisitions or higher dividend payouts. The company’s parent company
Glaxo increased stake in it through a voluntary open offer, after which Glaxo holds
75% stake in the Indian subsidiary. The buy-back of shares is a strong indicator
from the Management towards the performance of its listed Indian entity,
especially as it comes after the recent `864cr investment plan announced by the
company to further its growth prospects in the Indian pharmaceuticals market. The
said investments are expected to fructify by 2017.
On the operational front, we expect the company’s net sales to post a CAGR of
13.4% to `3,527cr and EPS to register a CAGR of 15.9% to `59.4 over
FY2016-18E. At current levels, the stock is trading at 60.6x and 52.9x its FY2017E
and FY2018E earnings, respectively. We remain Neutral on the stock.
Exhibit 6: Key assumptions
FY2017E
FY2018E
Sales growth (%)
16.7
10.2
Growth in employee expenses (%)
16.2
10.0
Operating margin (%)
16.6
18.8
Capex (` cr)
200
200
Source: Company, Angel Research
Exhibit 7: One-year forward PE
6,000
5,500
5,000
4,500
4,000
3,500
3,000
2,500
2,000
1,500
1,000
500
Price
18x
30x
42x
54x
Source: Company, Angel Research
August 4, 2016
6
Glaxo Pharma | 1QFY2017 Result Update
Exhibit 8: Recommendation summary
Company
Reco
CMP Tgt. price Upside
FY2018E
FY16-18E
FY2018E
(`)
(`)
% PE (x) EV/Sales (x) EV/EBITDA (x) CAGR in EPS (%) RoCE (%) RoE (%)
Alembic Pharma
Neutral
622
-
-
20.5
2.7
12.8
(10.8)
27.5
25.3
Aurobindo Pharma Buy
749
877
17.2
15.8
2.6
11.0
18.1
22.5
26.1
Cadila Healthcare
Buy
347
399
15.3
17.4
2.6
11.8
15.8
24.3
26.6
Cipla
Neutral
529
-
-
19.5
2.5
13.4
20.4
13.5
15.2
Dr Reddy's
Neutral
2,942
-
-
18.6
2.7
10.9
6.9
18.1
17.1
Dishman Pharma
Neutral
164
-
-
15.8
1.7
8.0
(1.1)
9.6
10.2
GSK Pharma*
Neutral
3,139
-
-
52.9
6.8
36.2
15.9
35.8
31.8
Indoco Remedies
Sell
313
225
(19.6)
20.1
2.3
12.8
31.5
19.1
19.2
Ipca labs
Buy
508
613
20.6
25.8
1.8
11.7
17.9
11.8
14.9
Lupin
Accumulate
1,680
1,809
7.7
24.2
4.0
14.9
17.2
24.4
20.9
Sanofi India
Neutral
4,545
-
-
26.9
3.4
19.5
21.2
24.9
28.4
Sun Pharma
Buy
838
944
12.6
25.6
5.2
16.7
22.0
33.1
18.9
Source: Company, Angel Research; Note: * December year ending;
August 4, 2016
7
Glaxo Pharma | 1QFY2017 Result Update
Company Background
GlaxoSmithKline Pharmaceuticals (GSK) is the sixth largest pharmaceutical player
in the Indian market with a market share of ~3.7%. The company’s product
portfolio includes both, prescription medicines and vaccines. GSK sells prescription
medicines across therapeutic areas such as anti-infectives, dermatology,
gynaecology, diabetes, oncology, cardiovascular diseases and respiratory
diseases. A large portion of the company’s revenue comes from the acute
therapeutic portfolio. However, the company is now scouting for opportunities in
high-growth therapeutic areas such as CVS, CNS, diabetes and oncology. Further,
with a strong parentage, the company plans to increase its product portfolio
through patented launches and vaccines. To fructify the same, the company plans
to enhance its manufacturing assets with its parent company investing `864cr in it;
the capacity expansion is expected to fructify in 2017.
August 4, 2016
8
Glaxo Pharma | 1QFY2017 Result Update
Profit & loss statement
Y/E March (` cr)
CY2012
CY2013
FY2015
FY2016
FY2017E
FY2018E
Gross sales
2,692
2,589
3,328
2,800
3,272
3,599
Less: Excise duty
71
51
56
59
72
72
Net sales
2,621
2,538
3,272
2,741
3,200
3,527
Other operating income
29
24
32
27
27
27
Total operating income
2,651
2,563
3,305
2,768
3,227
3,554
% chg
11.4
(3.3)
28.9
(16.2)
16.6
10.1
Total expenditure
1,862
2,034
2,690
2,289
2,670
2,864
Net raw materials
1,104
1,164
1,510
1,233
1,504
1,587
Other Mfg costs
94
89
115
99
107
115
Personnel
296
362
493
443
515
568
Other
369
420
572
514
544
593
EBITDA
759
504
582
452
530
664
% chg
2.1
(33.6)
15.5
(22.4)
17.3
25.2
(% of Net Sales)
29.0
19.9
17.8
16.5
16.6
18.8
Depreciation& amortization
18
20
25
25
37
45
EBIT
741
484
557
427
493
619
% chg
2.6
(34.7)
15.0
(23.3)
15.5
25.5
(% of Net Sales)
28.3
19.1
17.0
15.6
15.4
17.5
Interest & other charges
-
-
-
-
-
-
Other income
175
177
200
125
125
125
(% of PBT)
-
-
-
-
-
-
Share in profit of Associates
-
-
-
-
-
-
Recurring PBT
945
685
789
579
646
771
% chg
4.4
(27.5)
15.1
(26.5)
11.4
19.5
Extraordinary expense/(Inc.)
101
(26)
33
(3)
-
-
PBT (reported)
844
711
756
582
646
771
Tax
318
230
279
203
207
268
(% of PBT)
37.7
32.3
36.9
34.8
32.0
34.8
PAT (reported)
526
482
477
377
439
503
Add: Share of earnings
-
-
-
-
-
-
of asso.
Less: Minority interest (MI)
-
-
-
-
-
-
Prior period items
-
-
-
-
-
-
Exceptional items
PAT after MI (reported)
526
482
477
377
439
503
ADJ. PAT
657
464
509
374
439
503
% chg
12.0
(29.4)
9.8
(26.5)
17.3
14.6
(% of Net Sales)
25.1
18.3
15.6
13.7
13.7
14.3
Basic EPS (`)
78
55
60
44
52
59
Fully diluted EPS (`)
78
55
60
44
52
59
% chg
12.0
(29.4)
9.8
(26.5)
17.3
14.6
August 4, 2016
9
Glaxo Pharma | 1QFY2017 Result Update
Balance Sheet
Y/E March (` cr)
CY2012
CY2013
FY2015
FY2016
FY2017E
FY2018E
SOURCES OF FUNDS
Equity share capital
85
85
85
85
85
85
Preference Capital
-
-
-
-
-
-
Reserves& surplus
1,922
1,905
1,744
1,611
1,555
1,562
Shareholders funds
2,007
1,990
1,829
1,696
1,640
1,647
Minority Interest
-
-
-
-
-
-
Total loans
4
4
3
2
2
2
Other long-term liabilities
5
5
5
-
-
-
Long-term provisions
236
242
273
291
291
291
Deferred tax liability
(87)
(92)
(83)
(89)
(89)
(89)
Total liabilities
2,165
2,148
2,026
1,900
1,844
1,851
APPLICATION OF FUNDS
Gross block
274
323
467
725
925
1,125
Less: Acc. depreciation
227
247
272
297
334
379
Net block
47
76
195
428
591
746
Capital work-in-progress
44
44
44
44
44
44
Goodwill
42
42
-
-
-
-
Other non-current assets
17
14
-
-
-
-
Long-term loans and adv.
195
238
307
313
366
403
Investments
55
10
0
0
0
0
Current assets
2,602
2,614
2,587
2,172
2,059
1,998
Cash
2,067
2,042
1,911
1,348
1,099
940
Loans & advances
134
238
122
123
144
159
Other
401
335
554
701
816
899
Current liabilities
836
889
1,107
1,058
1,216
1,340
Net current assets
1,765
1,725
1,480
1,115
843
658
Mis. Exp. not written off
-
-
-
-
-
-
Total Assets
2,165
2,148
2,026
1,900
1,844
1,851
August 4, 2016
10
Glaxo Pharma | 1QFY2017 Result Update
Cash flow statement
Y/E March (` cr)
CY2012 CY2013 FY2015 FY2016 FY2017E FY2018E
Profit before tax and exceptional
844
711
756
582
646
771
Depreciation
18
20
25
25
37
45
(Inc)/Dec in working capital
(25)
15
114
(197)
23
26
Direct taxes paid
318
230
279
203
207
268
Cash Flow from Operations
519
517
616
207
499
574
(Inc.)/Dec.in fixed assets
(28)
(49)
(144)
(258)
(200)
(200)
(Inc.)/Dec. in investments
(57)
(45)
(10)
-
-
-
Cash Flow from Investing
(85)
(93)
(154)
(258)
(200)
(200)
Issue of equity
-
-
-
-
-
-
Inc./(Dec.) in loans
-
-
-
-
-
-
Dividend paid (Incl. Tax)
(491)
(495)
(624)
(495)
(495)
(495)
Others
110
47
32
(16)
(52)
(38)
Cash Flow from Financing
(381)
(448)
(593)
(512)
(548)
(533)
Inc./(Dec.) in cash
52
(25)
(131)
(563)
(249)
(159)
Opening cash balances
2,014
2,067
2,042
1,911
1,348
1,099
Closing cash balances
2,067
2,042
1,911
1,348
1,099
940
August 4, 2016
11
Glaxo Pharma | 1QFY2017 Result Update
Key ratio
Y/E March
CY2012
CY2013
FY2015
FY2016
FY2017E
FY2018E
Valuation Ratio (x)
P/E (on FDEPS)
40.5
57.3
52.2
71.1
60.6
52.9
P/CEPS
48.9
53.0
53.0
66.2
55.9
48.5
P/BV
13.3
13.4
14.5
15.7
16.2
16.1
Dividend yield (%)
1.6
1.6
1.6
1.6
1.6
1.6
EV/Sales
9.4
9.7
7.5
9.2
8.0
7.3
EV/EBITDA
32.3
48.7
42.4
55.9
48.1
38.7
EV / Total Assets
11.3
11.4
12.2
13.3
13.8
13.9
Per Share Data (`)
EPS (Basic)
77.6
54.8
60.1
44.2
51.8
59.4
EPS (fully diluted)
77.6
54.8
60.1
44.2
51.8
59.4
Cash EPS
64.2
59.2
59.3
47.4
56.2
64.7
DPS
50.0
50.0
50.0
50.0
50.0
50.0
Book Value
236.9
234.9
215.9
200.2
193.6
194.4
Returns (%)
RoCE (Pre-tax)
34.7
22.4
26.7
21.7
26.3
33.5
Angel ROIC (Pre-tax)
-
-
-
-
-
-
RoE
33.3
23.2
26.7
21.2
26.3
30.6
Turnover ratios (x)
Asset Turnover (Gross Block)
9.7
8.6
8.4
4.6
3.9
3.5
Inventory / Sales (days)
43
48
40
59
53
46
Receivables (days)
14
15
11
15
14
12
Payables (days)
58
54
55
77
73
77
WC cycle (ex-cash) (days)
74
79
69
99
101
104
Solvency ratios (x)
Net debt to equity
(1.0)
(1.0)
(1.0)
(0.8)
(0.7)
(0.6)
Net debt to EBITDA
(2.7)
(4.0)
(3.3)
(3.0)
(2.1)
(1.4)
Interest Coverage (EBIT / Int.)
-
-
-
-
-
-
August 4, 2016
12
Glaxo Pharma | 1QFY2017 Result Update
Research Team Tel: 022 - 39357800
DISCLAIMER
Angel Broking Private Limited (hereinafter referred to as “Angel”) is a registered Member of National Stock Exchange of India Limited,
Bombay Stock Exchange Limited and Metropolitan Stock Exchange Limited. It is also registered as a Depository Participant with CDSL
and Portfolio Manager with SEBI. It also has registration with AMFI as a Mutual Fund Distributor. Angel Broking Private Limited is a
registered entity with SEBI for Research Analyst in terms of SEBI (Research Analyst) Regulations, 2014 vide registration number
INH000000164. Angel or its associates has not been debarred/ suspended by SEBI or any other regulatory authority for accessing
/dealing in securities Market. Angel or its associates/analyst has not received any compensation / managed or co-managed public
offering of securities of the company covered by Analyst during the past twelve months.
This document is solely for the personal information of the recipient, and must not be singularly used as the basis of any investment
decision. Nothing in this document should be construed as investment or financial advice. Each recipient of this document should
make such investigations as they deem necessary to arrive at an independent evaluation of an investment in the securities of the
companies referred to in this document (including the merits and risks involved), and should consult their own advisors to determine
the merits and risks of such an investment.
Reports based on technical and derivative analysis center on studying charts of a stock's price movement, outstanding positions and
trading volume, as opposed to focusing on a company's fundamentals and, as such, may not match with a report on a company's
fundamentals. Investors are advised to refer the Fundamental and Technical Research Reports available on our website to evaluate the
contrary view, if any.
The information in this document has been printed on the basis of publicly available information, internal data and other reliable
sources believed to be true, but we do not represent that it is accurate or complete and it should not be relied on as such, as this
document is for general guidance only. Angel Broking Pvt. Limited or any of its affiliates/ group companies shall not be in any way
responsible for any loss or damage that may arise to any person from any inadvertent error in the information contained in this report.
Angel Broking Pvt. Limited has not independently verified all the information contained within this document. Accordingly, we cannot
testify, nor make any representation or warranty, express or implied, to the accuracy, contents or data contained within this document.
While Angel Broking Pvt. Limited endeavors to update on a reasonable basis the information discussed in this material, there may be
regulatory, compliance, or other reasons that prevent us from doing so.
This document is being supplied to you solely for your information, and its contents, information or data may not be reproduced,
redistributed or passed on, directly or indirectly.
Neither Angel Broking Pvt. Limited, nor its directors, employees or affiliates shall be liable for any loss or damage that may arise from
or in connection with the use of this information.
Disclosure of Interest Statement
Glaxo Pharma
1. Financial interest of research analyst or Angel or his Associate or his relative
No
2. Ownership of 1% or more of the stock by research analyst or Angel or associates or relatives
No
3. Served as an officer, director or employee of the company covered under Research
No
4. Broking relationship with company covered under Research
No
Ratings (Based on expected returns
Buy (> 15%)
Accumulate (5% to 15%)
Neutral (-5 to 5%)
over 12 months investment period):
Reduce (-5% to -15%)
Sell (< -15)
August 4, 2016
13