4QFY2016 Result Update | Textile
May 27, 2016
Garware Wall Ropes
BUY
CMP
`362
Performance Highlights
Target Price
`460
Quarterly Data
Investment Period
12 months
(` cr)
4QFY16
4QFY15
% yoy
3QFY16
% qoq
Revenue
188
197
(4.3)
186
1.5
Stock Info
EBITDA
28
23
25.2
25
15.8
Sector
Textiles
Margin (%)
15.1
11.5
356bp
13.2
186bp
Market Cap (` cr)
853
Adj. PAT
17
12
41.0
15
18.3
Source: Company, Angel Research
Net Debt (` cr)
-62
Beta
1.0
Garware Wall Ropes (GWRL)’ 4QFY2016 results outperformed our estimates on
52 Week High / Low
438/187
the bottom-line front. The company’s top-line for the quarter de-grew by
Avg. Daily Volume
4,788
~4% yoy. On the operating front, the company reported margin improvement,
Face Value (`)
10
primarily on account of lower raw material costs. Further, on the bottom-line front, the
BSE Sensex
26,654
company reported strong growth on account of a favorable operating performance.
Nifty
8,157
Volumes grew but price cut dragged the overall top-line: The company’s top-line
Reuters Code
GRWL.BO
de-grew by ~4% yoy to `188cr (below our estimate of `205cr). The revenue
Bloomberg Code
GWWR@IN
underperformance was mainly due to lower growth of 1% yoy to `153cr in the
Synthetic cordage segment and de-growth of ~22% yoy to `40cr in the Fibre &
Industrial products segment.
Shareholding Pattern (%)
Promoters
50.6
Strong operating performance boosts profitability: On the operating front, the
MF / Banks / Indian Fls
6.1
company reported margin improvement (up by 356bp yoy to 15.1%), primarily
FII / NRIs / OCBs
4.1
on account of lower raw material costs by 981bp yoy as a percentage of sales as
Indian Public / Others
39.2
prices of its key raw materials, ie high density polyethylene, polyethylene etc
declined during the quarter. The reported net profit grew by ~41% yoy to `17.3cr
(outperforming our estimate of
`12cr) on account of the strong operating
Abs. (%)
3m 1yr
3yr
performance.
Sensex
15.1
2.0
32.2
GWRL
29.2
(3.0)
713.5
Outlook and valuation: Going ahead, we expect GWRL to report a healthy top-
line in anticipation of strong domestic as well as export sales. On the domestic
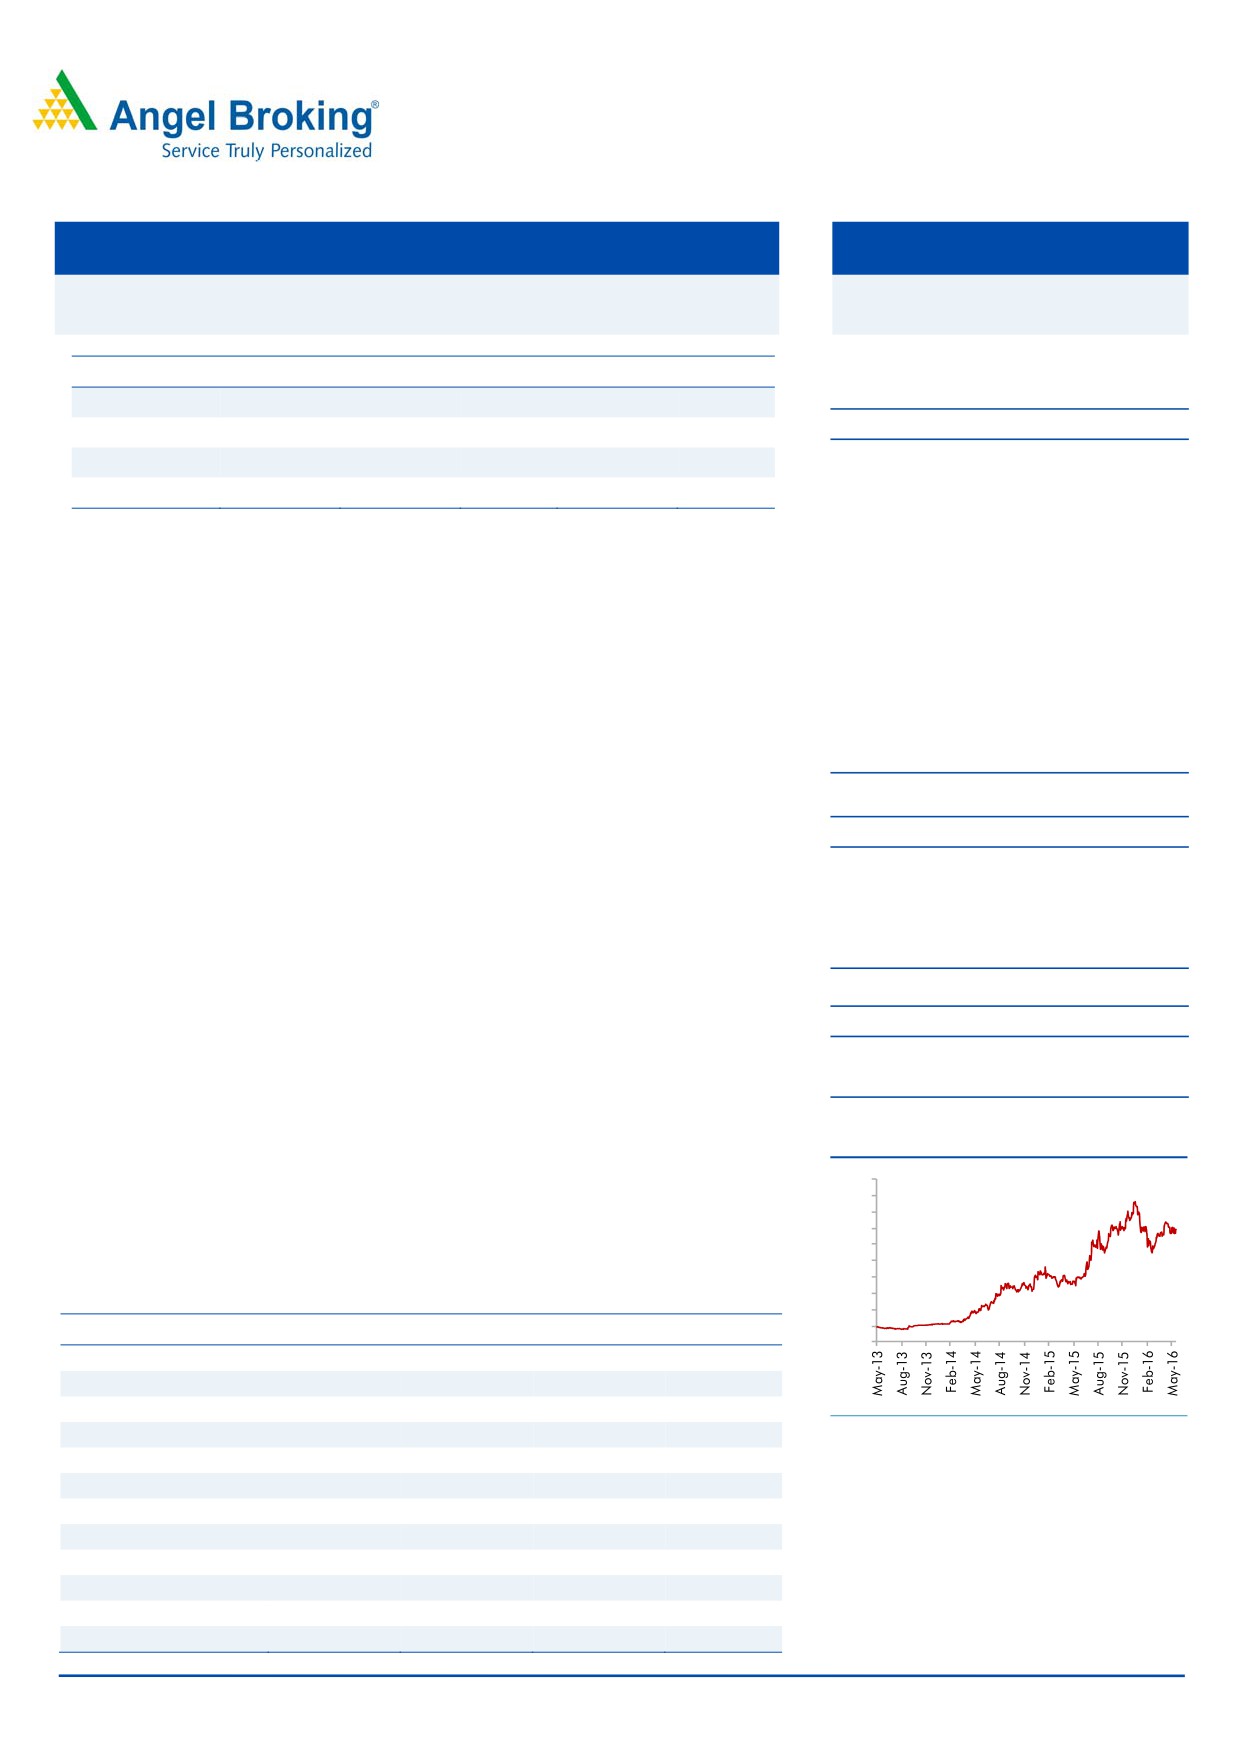
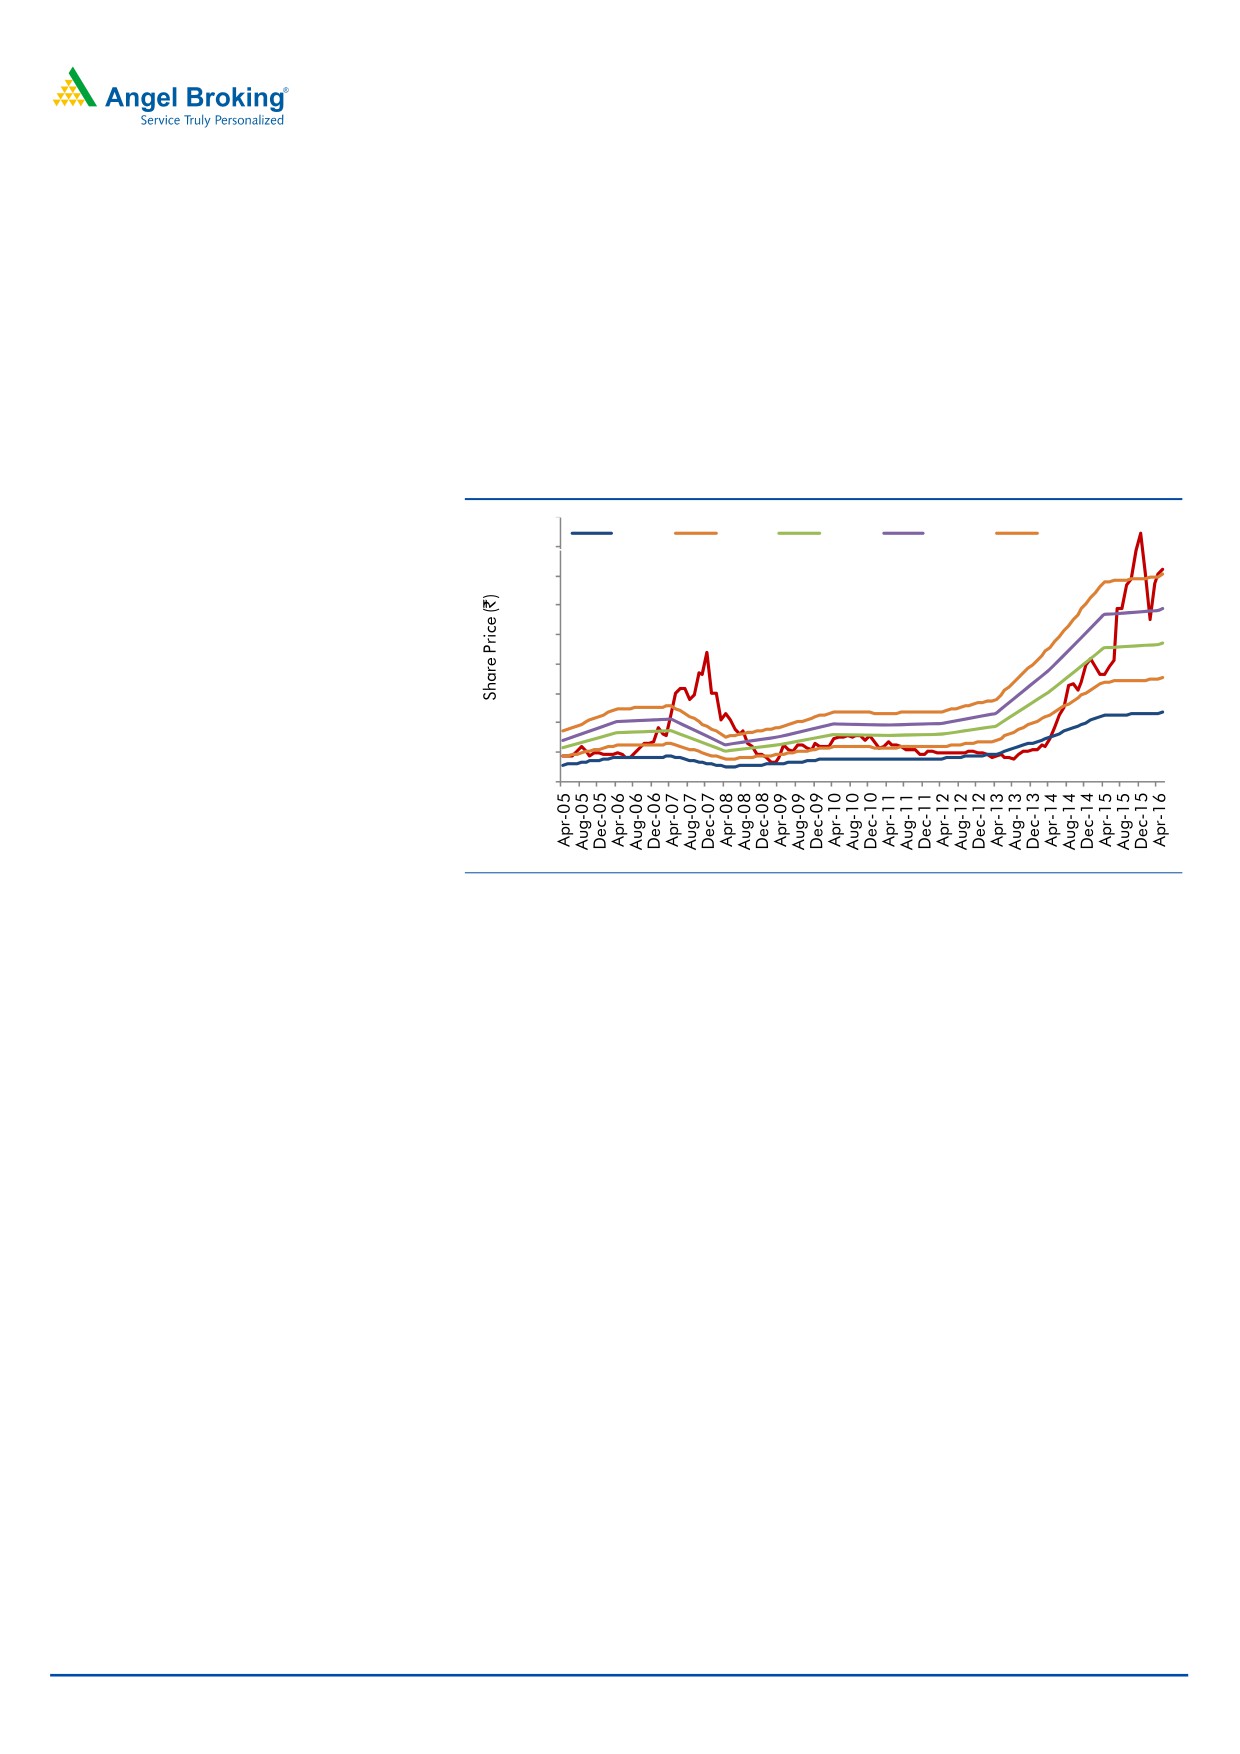
3-year price chart
front, we expect demand to pick up with an expected growth in the agriculture
and fisheries segments in the country. Further, we expect the company to continue
500
450
reporting strong numbers on back of higher demand for aquaculture and sports
400
350
products globally and also with the company tapping new geographies. Hence,
300
250
we recommend a Buy rating on the stock with a target price of `460.
200
150
Key financials (Consolidated)
100
50
Y/E March (` cr)
FY2015
FY2016
FY2017E
FY2018E
0
Net sales
784
828
898
997
% chg
14.0
5.5
8.5
11.1
Net profit
43
62
64
72
% chg
61.5
43.7
2.6
13.3
Source: Company, Angel Research
EBITDA margin (%)
10.4
12.7
11.9
11.7
EPS (`)
19.7
28.3
29.0
32.9
P/E (x)
18.3
12.7
12.4
11.0
P/BV (x)
2.5
2.1
1.8
1.6
RoE (%)
13.8
16.8
14.9
14.6
RoCE (%)
19.3
23.2
20.7
20.0
Amarjeet S Maurya
EV/Sales (x)
1.0
0.9
0.8
0.7
022-39357800 Ext: 6831
EV/EBITDA (x)
10.0
6.9
6.7
5.9
Source: Company, Angel Research, Note: CMP as of May 27, 2016
Please refer to important disclosures at the end of this report
1
Garware Wall Ropes | 4QFY2016 Result Update
Exhibit 1: Quarterly performance
Y/E March (` cr)
4QFY16
4QFY15
% yoy
3QFY16
% qoq
FY2016
FY2015
% chg
Net Sales
188
197
(4.3)
186
1.5
828
784
5.5
Consumption of RM
75
98
(23.2)
71
6.1
343
363
(5.6)
(% of Sales)
39.9
49.7
38.2
41.4
46.3
Staff Costs
25
16
55.8
23
8.2
93
84
10.2
(% of Sales)
13.2
8.1
12.4
11.2
10.7
Operating Expense
60
60
(0.8)
67
(10.9)
286
255
12.2
(% of Sales)
31.8
30.6
36.2
34.6
32.5
Total Expenditure
160
174
(8.2)
161
(0.7)
722
703
2.8
Operating Profit
28
23
25.2
25
15.8
105
81
29.4
OPM (%)
15.1
11.5
13.2
12.7
10.4
Interest
2
3
(39.3)
3
(29.7)
9
10
(14.8)
Depreciation
3
3
15.3
3
5.0
13
12
5.7
Other Income
1.2
0.4
193.0
1.2
(0.1)
3
2
102.3
PBT
24
17
43.4
20
23.1
87
61
43.9
(% of Sales)
12.9
8.6
10.6
10.5
7.7
Provision for Taxation
7
5
49.9
5
36.6
25
17
44.2
(% of PBT)
28.7
27.5
25.9
28.9
28.9
Minority Interest
Reported PAT
17
12
41.0
15
18.3
62
43
43.7
PATM
9.2
6.2
7.9
7.5
5.5
Source: Company, Angel Research
May 27, 2016
2
Garware Wall Ropes | 4QFY2016 Result Update
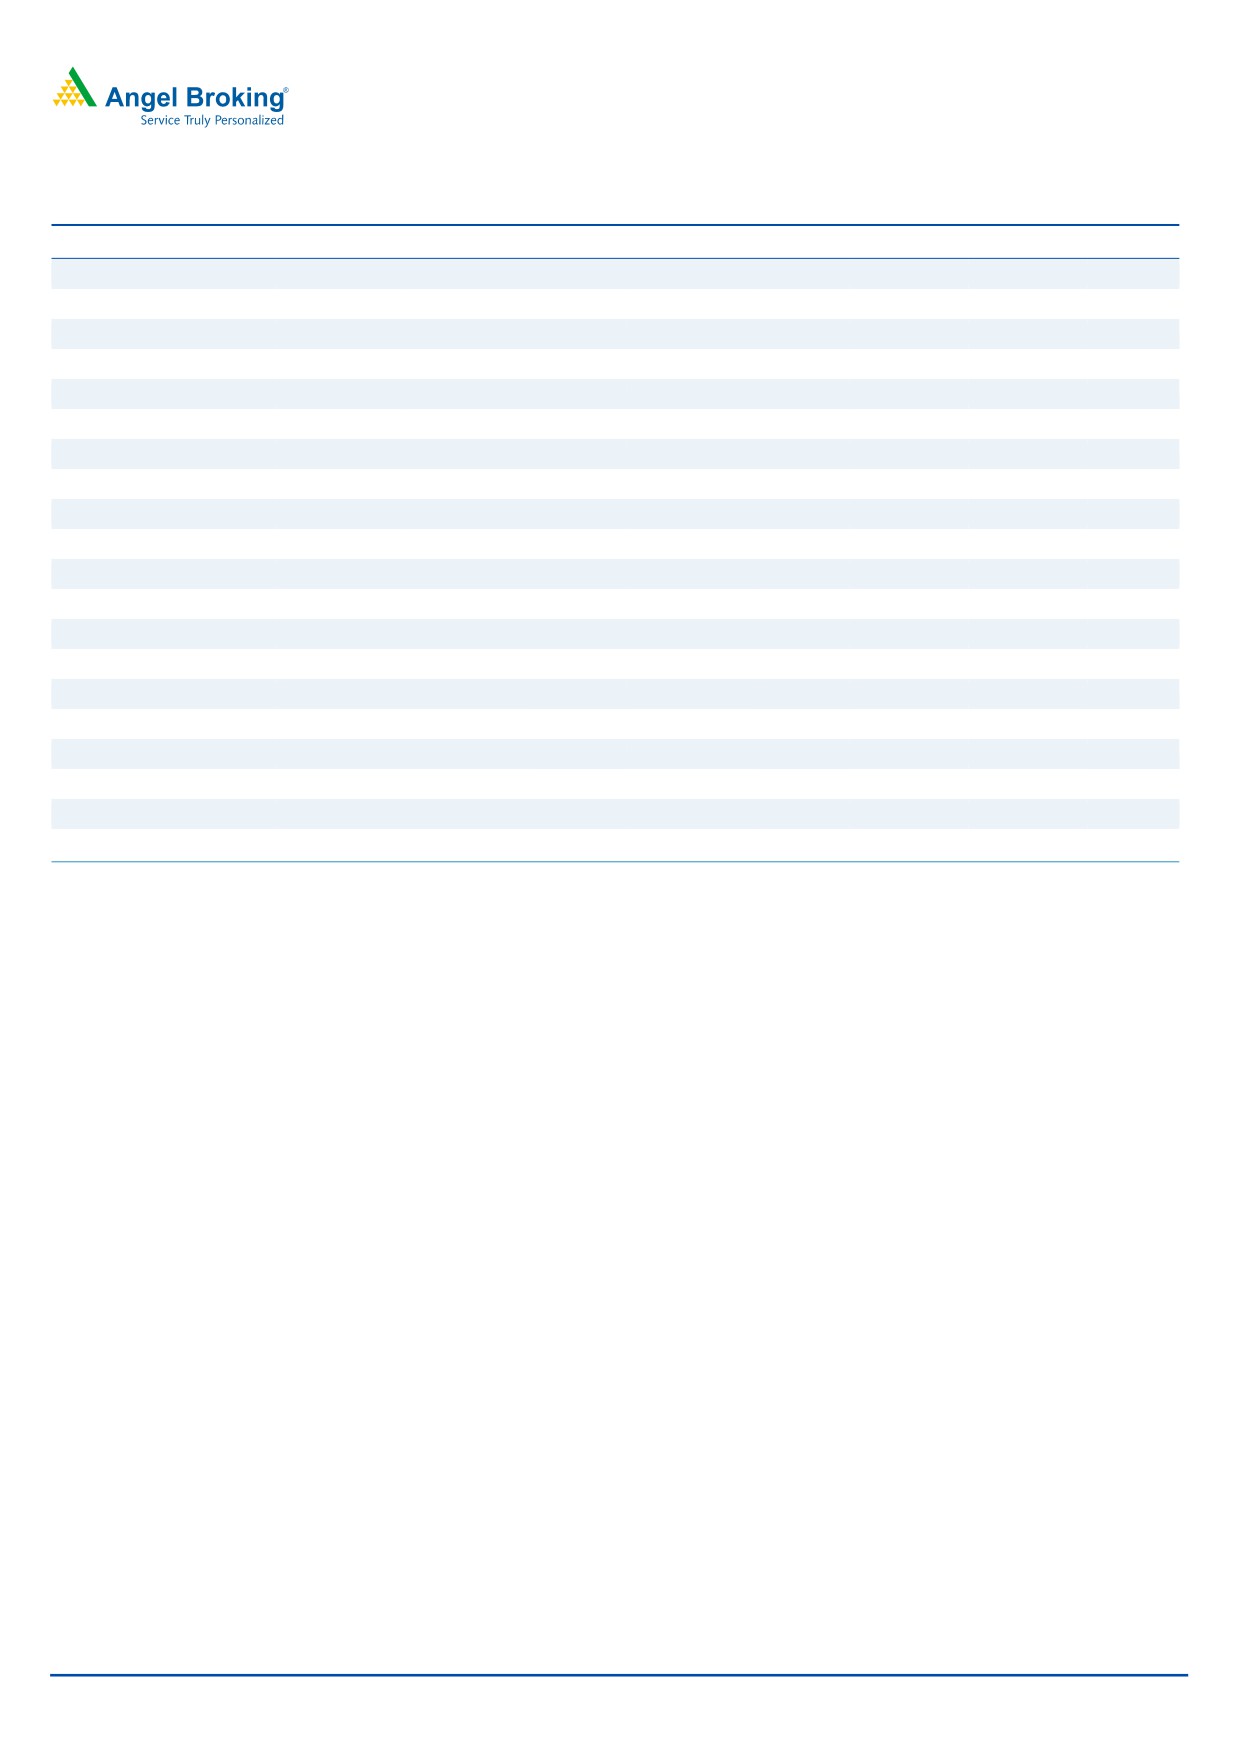
Volumes grew but price cut dragged overall top-line
The company’s top-line de-grew by ~4% yoy to `188cr (below our estimate of
`205cr). The revenue underperformance was mainly due to lower growth of 1%
yoy to `153cr in the Synthetic cordage segment and de-growth of ~22% yoy to
`40cr in the Fibre & Industrial products segment.
Going forward, we expect the company to report healthy numbers on back of
higher anticipated demand for aquaculture and sports products globally and also
with the company tapping new geographies.
Exhibit 2: Top-line growth trend
25
300
20
250
15
200
10
5
150
-
100
(5)
(10)
50
(15)
0
(20)
Net sales
QoQ growth (%)
Source: Company, Angel Research
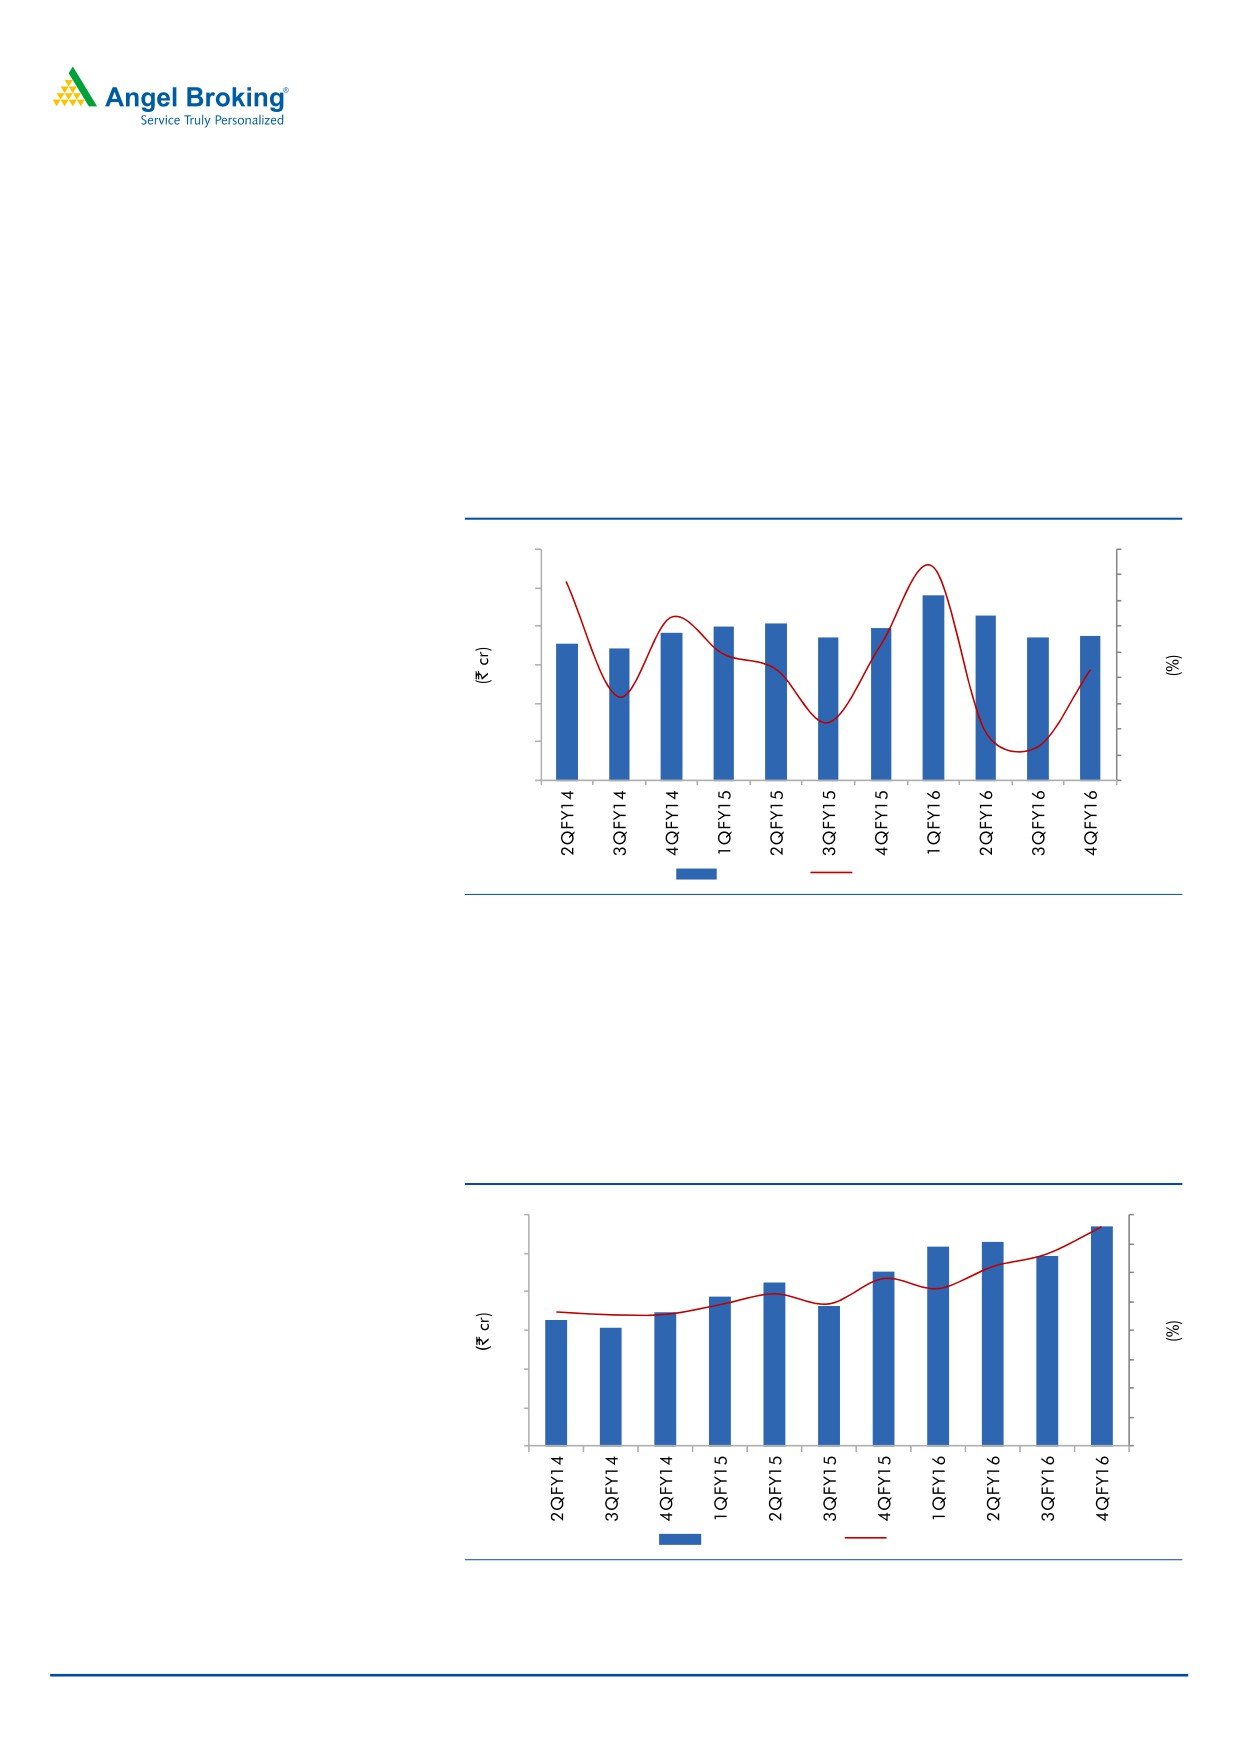
Operating margin expansion due to falling material prices
On the operating front, the company reported margin improvement (up by 356bp
yoy to 15.1%), primarily on account of lower raw material costs by 981bp yoy as a
percentage of sales as prices of its key raw materials, ie high density polyethylene,
polyethylene etc declined during the quarter.
Exhibit 3: Operating profit and margin trend
30
16
14
25
12
20
10
15
8
6
10
4
5
2
0
0
Operating Profit
Margin (%)
Source: Company, Angel Research
May 27, 2016
3
Garware Wall Ropes | 4QFY2016 Result Update
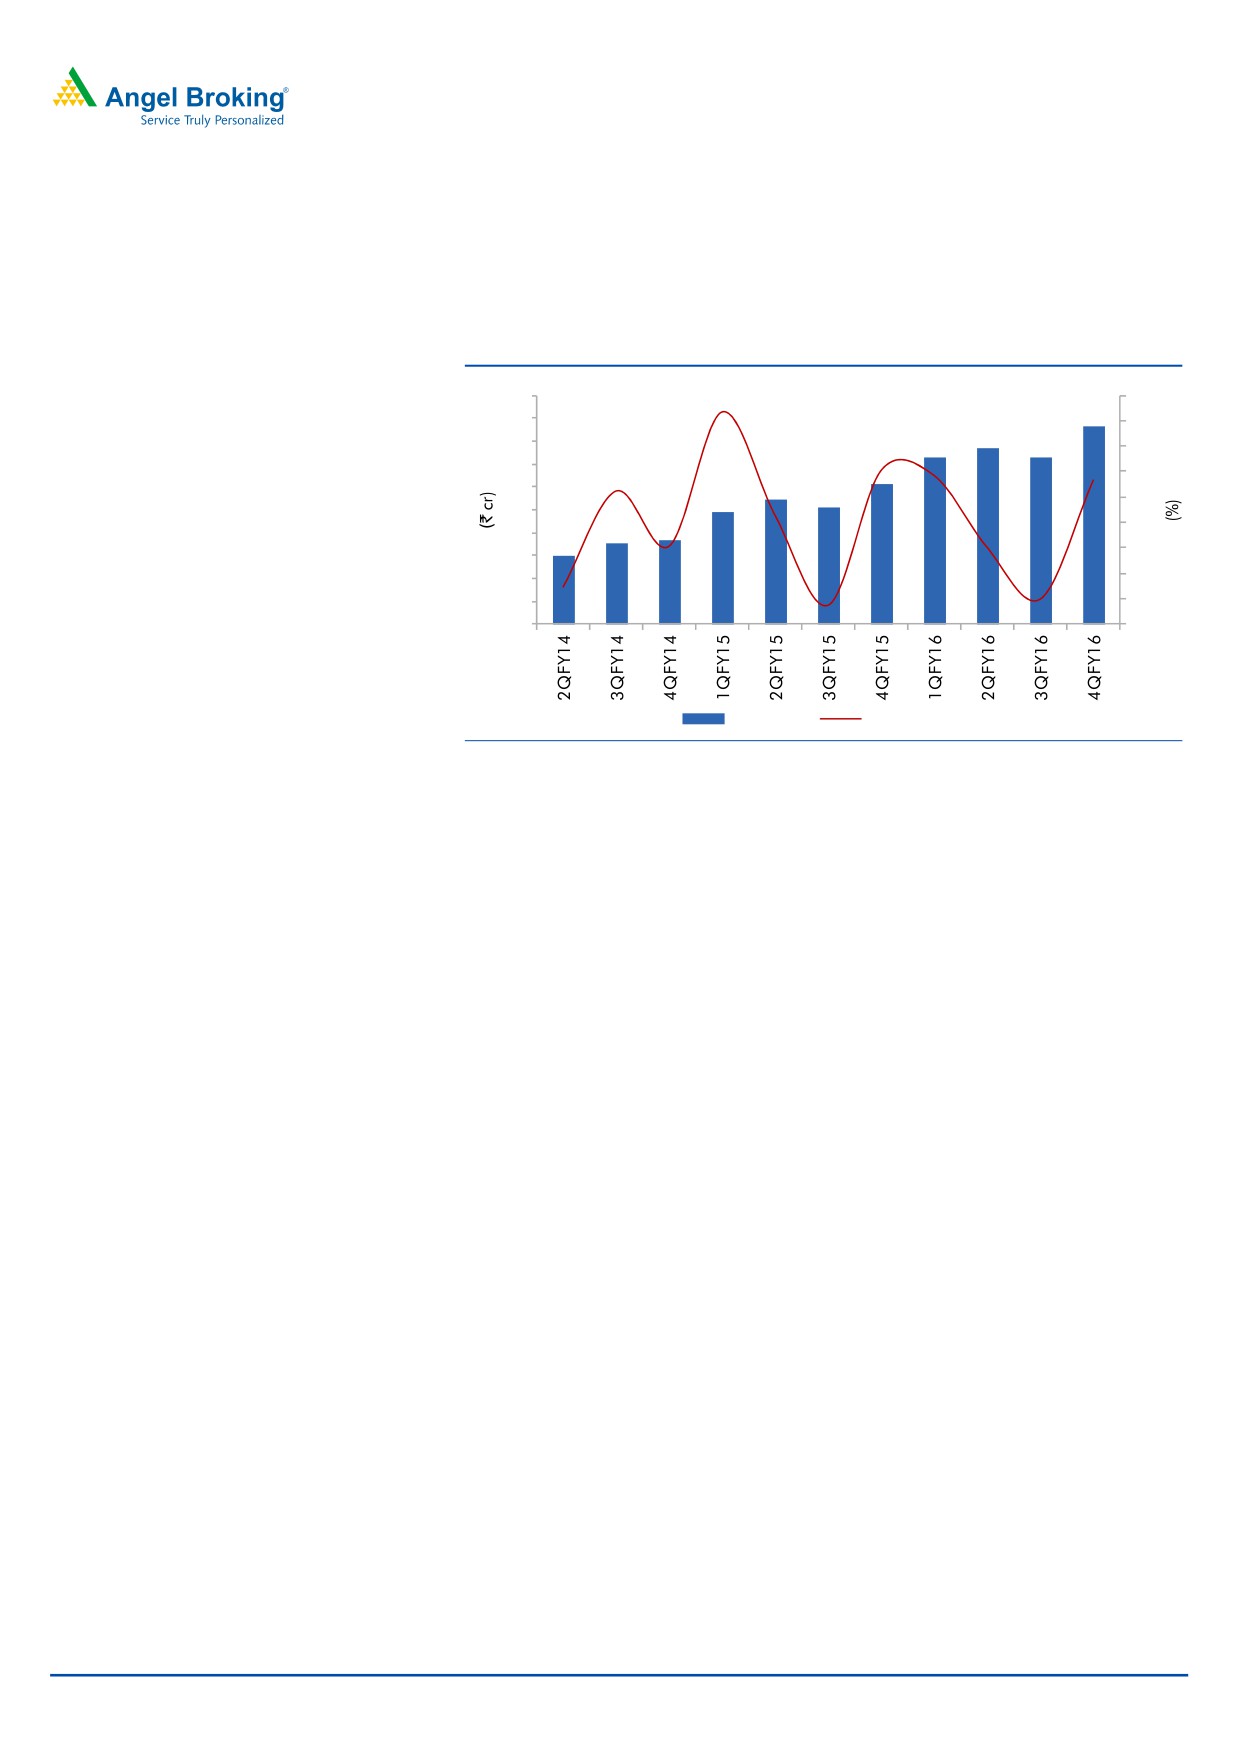
PAT grew ~41% yoy
The reported net profit grew by ~41% yoy to `17.3cr (outperforming our estimate
of `12cr) on account of the strong operating performance.
Exhibit 4: Net Profit and growth trend
20
35
18
30
16
25
14
20
12
15
10
10
8
5
6
-
4
2
(5)
0
(10)
Net Profit
QoQ growth (%)
Source: Company, Angel Research
May 27, 2016
4
Garware Wall Ropes | 4QFY2016 Result Update
Investment rationale
Higher exports to accelerate top-line growth
We expect GWRL to report a healthy top-line CAGR of ~10% over FY2016-18E,
on the back of higher growth in exports. Over the last seven years, the company
has reported a CAGR of ~16% in export sales to `412cr (for FY2016). The
percentage of exports to total sales has increased from 32.5% to 50% over the
same period. Exports predominately comprise of fishing and aquaculture offerings
and of sports goods. Going forward, we expect the company to continue to report
strong numbers on the export front on back of higher demand for aquaculture and
sports products globally. The company has export presence in 72 countries, mainly
in the US, Canada and across Europe. It is now planning to strengthen its presence
in Africa through agricultural offerings. Thus, we expect the company to report
export sales CAGR of ~13% over FY2016-18E. The Management is targeting to
increase export business’ contribution to about 65% of turnover in the next couple
of years.
Lower raw material prices and higher export contribution to
enhance margins
In the last six years, despite of volatility in raw material prices, the company has
maintained its operating margin in the range of 10-11%. In FY2016, the company
witnessed an improvement in its operating margin by 235bp. Going forward, we
believe that the company would be able to increase its margins owing to (a) easing
raw material prices including that of high density polyethylene, polyethylene, nylon
etc. which are crude based raw materials, and (b) higher contribution of exports
which is a high margin business.
Continuous debt repayment and improving return ratios
The company is continuously generating higher cash flows, which has resulted in
debt reduction and improvement in its ROE. The company has been consistently
repaying debt over the past five years, resulting in debt having come down from
~`140cr in FY2012 to `30cr in FY2016. Going forward, we believe the company
will continue repaying debt with strong cash flows, which in turn will lead to
reduction in interest cost (interest cost has reduced from ~`17cr in FY2012 to
~`9cr in FY2016). A lower interest expense in turn will lead to higher profitability
for the company. Further, the company’s ROE has improved from 9.6% in FY2012
to 16.8% in FY2016.
May 27, 2016
5
Garware Wall Ropes | 4QFY2016 Result Update
Outlook and valuation
Going ahead, we expect GWRL to report a healthy top-line in anticipation of
strong domestic as well as export sales. On the domestic front, we expect demand
to pick up with an expected growth in the agriculture and fisheries segments in the
country. Further, we expect the company to continue reporting strong numbers on
back of higher demand for aquaculture and sports products globally and also with
the company tapping new geographies. Hence, we recommend a Buy rating on
the stock with a target price of `460.
Exhibit 5: One-year forward P/E band
450
4.0 X
6.0 X
8.0 X
10.0 X
12.0 X
400
350
300
250
200
150
100
50
0
Source: Company, Angel Research
Company Background
Garware Wall Ropes Ltd (GWRL) is an ISO 9001:2008 certified company.
Established in 1976, the company is a leading player in technical textiles,
specializing in providing customized solutions to the cordage and infrastructure
industry worldwide. The company is a global player and known for its innovation
in the field of fisheries, aquaculture, shipping, sports, agriculture, coated fabrics
and geosynthetics. GWRL’s products are manufactured in its state-of-art facilities at
Wai and Pune (both in Maharashtra, India) and are marketed in more than
75 countries worldwide.
May 27, 2016
6
Garware Wall Ropes | 4QFY2016 Result Update
Profit & Loss Statement
Y/E March (` cr)
FY13
FY14
FY15
FY16
FY17E
FY18E
Total operating income
604
688
784
828
898
997
% chg
4.0
13.9
14.0
5.5
8.5
11.1
Total Expenditure
541
622
703
722
791
881
Cost of Materials
263
316
363
343
407
452
Personnel Expenses
81
64
84
93
102
116
Others Expenses
197
242
255
286
282
313
EBITDA
63
65
81
105
107
117
% chg
(1.1)
3.9
24.6
29.6
1.4
9.2
(% of Net Sales)
10.4
9.5
10.4
12.7
11.9
11.7
Depreciation& Amortisation
16
14
12
13
14
15
EBIT
47
51
69
92
92
102
% chg
(2.2)
9.4
35.5
33.9
0.1
9.8
(% of Net Sales)
7.7
7.4
8.8
11.2
10.3
10.2
Interest & other Charges
14
13
10
9
6
4
Other Income
1
1
2
3
3
4
(% of PBT)
4.1
2.6
3.0
4.0
3.4
3.9
Share in profit of Associates
-
-
-
-
-
-
Recurring PBT
33
39
61
87
89
101
% chg
4.2
17.0
54.9
43.9
2.7
13.3
Prior Period & Extraord. Exps./(Inc.)
-
-
-
-
-
-
PBT (reported)
33
39
61
87
89
101
Tax
9
12
17
25
26
29
(% of PBT)
26.1
31.8
28.9
28.9
29.0
29.0
PAT (reported)
25
27
43
62
64
72
Add: Share of earnings of asso.
-
-
-
-
-
-
Less: Minority interest (MI)
-
-
-
-
-
-
PAT after MI (reported)
25
27
43
62
64
72
ADJ. PAT
25
27
43
62
64
72
% chg
2.7
8.1
61.5
43.7
2.6
13.3
(% of Net Sales)
4.1
3.9
5.5
7.5
7.1
7.2
Basic EPS (`)
11.3
12.2
19.7
28.3
29.0
32.9
Fully Diluted EPS (`)
11.3
12.2
19.7
28.3
29.0
32.9
% chg
2.7
8.1
61.5
43.7
2.6
13.3
May 27, 2016
7
Garware Wall Ropes | 4QFY2016 Result Update
Balance Sheet
Y/E March (` cr)
FY13
FY14
FY15
FY16
FY17E
FY18E
SOURCES OF FUNDS
Equity Share Capital
24
22
22
22
22
22
Reserves& Surplus
243
254
291
347
405
471
Shareholders Funds
267
276
313
369
426
492
Minority Interest
-
-
-
-
-
-
Total Loans
110
71
45
30
20
15
Deferred Tax Liability
19
21
21
21
21
21
Total Liabilities
397
368
379
420
468
529
APPLICATION OF FUNDS
Gross Block
339
351
371
391
411
431
Less: Acc. Depreciation
185
198
211
224
238
253
Net Block
154
153
160
167
173
178
Capital Work-in-Progress
0
7
7
7
7
7
Investments
9
9
9
9
9
9
Current Assets
399
430
519
615
674
779
Inventories
122
127
137
127
140
158
Sundry Debtors
140
143
182
199
216
240
Cash
20
9
11
83
86
101
Loans & Advances
104
138
175
191
213
249
Other Assets
13
13
13
15
18
30
Current liabilities
167
232
318
380
396
445
Net Current Assets
232
198
201
235
277
333
Deferred Tax Asset
1
1
1
1
1
1
Total Assets
397
368
379
420
468
529
May 27, 2016
8
Garware Wall Ropes | 4QFY2016 Result Update
Cashflow Statement
Y/E March (` cr)
FY13
FY14
FY15
FY16
FY17E
FY18E
Profit before tax
33
39
61
87
89
101
Depreciation
16
14
12
13
14
15
Change in Working Capital
(21)
19
(1)
38
(39)
(42)
Interest / Dividend (Net)
13
15
10
9
6
4
Direct taxes paid
(8)
(5)
(17)
(25)
(26)
(29)
Others
(0)
-
-
-
-
-
Cash Flow from Operations
34
82
64
121
45
50
(Inc.)/ Dec. in Fixed Assets
1
(20)
(20)
(20)
(20)
(20)
(Inc.)/ Dec. in Investments
(0)
(0)
0
-
-
-
Cash Flow from Investing
2
(20)
(20)
(20)
(20)
(20)
Issue of Equity
-
-
-
-
-
-
Inc./(Dec.) in loans
(17)
(51)
(27)
(15)
(10)
(5)
Dividend Paid (Incl. Tax)
(7)
(7)
(6)
(6)
(6)
(6)
Interest / Dividend (Net)
(15)
(16)
(10)
(9)
(6)
(4)
Cash Flow from Financing
(39)
(74)
(43)
(29)
(22)
(15)
Inc./(Dec.) in Cash
(3)
(11)
2
72
3
15
Opening Cash balances
24
20
9
11
83
86
Closing Cash balances
20
9
11
83
86
101
May 27, 2016
9
Garware Wall Ropes | 4QFY2016 Result Update
Key Ratios
Y/E March
FY12
FY13
FY14
FY15
FY16E FY17E
Valuation Ratio (x)
P/E (on FDEPS)
31.9
29.5
18.3
12.7
12.4
11.0
P/CEPS
19.2
19.2
14.2
10.5
10.1
9.0
P/BV
2.9
2.9
2.5
2.1
1.8
1.6
Dividend yield (%)
0.8
0.8
0.8
0.8
0.8
0.8
EV/Sales
1.4
1.2
1.0
0.9
0.8
0.7
EV/EBITDA
13.8
12.9
10.0
6.9
6.7
5.9
EV / Total Assets
1.5
1.4
1.2
0.9
0.8
0.7
Per Share Data (`)
EPS (Basic & fully diluted)
11.3
12.2
19.7
28.3
29.0
32.9
EPS (Adjusted)
11.3
12.2
19.7
28.3
29.0
32.9
Cash EPS
18.7
18.8
25.3
34.3
35.6
39.8
DPS
2.7
2.7
2.7
2.7
2.7
2.7
Book Value
122.1
126.1
143.0
168.6
194.9
225.1
Returns (%)
ROCE
12.3
14.7
19.3
23.2
20.7
20.0
Angel ROIC (Pre-tax)
13.4
15.5
20.4
30.1
26.3
25.5
ROE
9.2
9.7
13.8
16.8
14.9
14.6
Turnover ratios (x)
Asset Turnover (Gross Block)
1.8
2.0
2.1
2.1
2.2
2.3
Inventory / Sales (days)
74
67
64
56
57
58
Receivables (days)
85
76
85
88
88
88
Payables (days)
35
34
36
37
38
38
WC cycle (ex-cash) (days)
124
109
113
107
107
108
May 27, 2016
10
Garware Wall Ropes | 4QFY2016 Result Update
Research Team Tel: 022 - 39357800
DISCLAIMER
Angel Broking Private Limited (hereinafter referred to as “Angel”) is a registered Member of National Stock Exchange of India Limited,
Bombay Stock Exchange Limited and Metropolitan Stock Exchange of India Limited. It is also registered as a Depository Participant with
CDSL and Portfolio Manager with SEBI. It also has registration with AMFI as a Mutual Fund Distributor. Angel Broking Private Limited is
a registered entity with SEBI for Research Analyst in terms of SEBI (Research Analyst) Regulations, 2014 vide registration number
INH000000164. Angel or its associates has not been debarred/ suspended by SEBI or any other regulatory authority for accessing
/dealing in securities Market. Angel or its associates including its relatives/analyst do not hold any financial interest/beneficial
ownership of more than 1% in the company covered by Analyst. Angel or its associates/analyst has not received any compensation /
managed or co-managed public offering of securities of the company covered by Analyst during the past twelve months. Angel/analyst
has not served as an officer, director or employee of company covered by Analyst and has not been engaged in market making activity
of the company covered by Analyst.
This document is solely for the personal information of the recipient, and must not be singularly used as the basis of any investment
decision. Nothing in this document should be construed as investment or financial advice. Each recipient of this document should
make such investigations as they deem necessary to arrive at an independent evaluation of an investment in the securities of the
companies referred to in this document (including the merits and risks involved), and should consult their own advisors to determine
the merits and risks of such an investment.
Reports based on technical and derivative analysis center on studying charts of a stock's price movement, outstanding positions and
trading volume, as opposed to focusing on a company's fundamentals and, as such, may not match with a report on a company's
fundamentals.
The information in this document has been printed on the basis of publicly available information, internal data and other reliable
sources believed to be true, but we do not represent that it is accurate or complete and it should not be relied on as such, as this
document is for general guidance only. Angel Broking Pvt. Limited or any of its affiliates/ group companies shall not be in any way
responsible for any loss or damage that may arise to any person from any inadvertent error in the information contained in this report.
Angel Broking Pvt. Limited has not independently verified all the information contained within this document. Accordingly, we cannot
testify, nor make any representation or warranty, express or implied, to the accuracy, contents or data contained within this document.
While Angel Broking Pvt. Limited endeavors to update on a reasonable basis the information discussed in this material, there may be
regulatory, compliance, or other reasons that prevent us from doing so.
This document is being supplied to you solely for your information, and its contents, information or data may not be reproduced,
redistributed or passed on, directly or indirectly.
Neither Angel Broking Pvt. Limited, nor its directors, employees or affiliates shall be liable for any loss or damage that may arise from
or in connection with the use of this information.
Note: Please refer to the important ‘Stock Holding Disclosure' report on the Angel website (Research Section). Also, please refer to the
latest update on respective stocks for the disclosure status in respect of those stocks. Angel Broking Pvt. Limited and its affiliates may
have investment positions in the stocks recommended in this report.
Disclosure of Interest Statement
Garware Wall Ropes
1. Analyst ownership of the stock
No
2. Angel and its Group companies ownership of the stock
No
3. Angel and its Group companies' Directors ownership of the stock
No
4. Broking relationship with company covered
No
Note: We have not considered any Exposure below ` 1 lakh for Angel, its Group companies and Directors
Ratings (Based on expected returns
Buy (> 15%)
Accumulate (5% to 15%)
Neutral (-5 to 5%)
over 12 months investment period):
Reduce (-5% to -15%)
Sell (< -15%)
May 27, 2016
11