IPO Note | Financials
Oct 10, 2017
General Insurance Corporation of India
SUBSCRIBE
sue Open: Oct 11, 2017
Is
Issue Close: Oct 13, 2017
General Insurance Corporation of India (GIC Re) is the largest reinsurer company
in terms of gross premium (GP) accepted, having a market share of 60% in India.
GIC Re provides reinsurance across key business lines including fire (property),
Issue Details
marine, motor, engineering, agriculture, aviation, health, liability & credit, etc.
Face Value: `5
Leader in Indian reinsurance industry: GIC Re is the largest reinsurer company in
Present Eq. Paid up Capital: `430cr
India with 60% market share in terms of GP accepted (12th largest global and 3rd
largest Asian reinsurer). Over the last 15 years, industry GP has grown at 15%
Offer for Sale: **10.75cr Shares
and expected to grow at 20% for the next 5-10 years on the back of government
Fresh issue: `1569cr
initiatives, growth in distribution network and increased awareness.
Diversified portfolio leading to better yield: As on 1QFY2018, GIC Re had an
Post Eq. Paid up Capital: `439cr
investment book worth `41,930cr carrying value (`73,903cr Market value) on
Issue size (amount): *`10,662cr -
which company has been able to generate yield of 12.3% for FY2017. For
**11,372cr
FY2013/FY2014/FY2015/FY2016 it has managed to generate yield of
Price Band: `855-912
11.9%/12.1%/14.1%/12.9% respectively. As on Q1FY18, the company’s fixed
income debt securities, equities and money market instruments accounted for
Lot Size: 16 shares and in multiple
thereafter
61.49%, 20.21% and 17.12% respectively.
Post-issue implied mkt. cap:
Strong financials with improved combined ratio: GP over last 4/3 years has
*`75,001cr - **`80,001cr
grown at healthy CAGR of 22%/32% respectively. On the bottom-line front, the
Promoters holding Pre-Issue: 100%
company has reported CAGR of ~12% over FY2013-16. Return on equity (ROE)
Promoters holding Post-Issue: 0%
for FY2017 was 16% and last 4 years average ROE was 17%. The combined ratio
has declined from 106.5% in FY2013 to 99.7% in FY2017 due to an increase in
*Calculated on lower price band
Agriculture GP.
** Calculated on upper price band
Outlook & Valuation: At the upper end of the IPO price band it is offered at 25x
Book Building
its FY2017 EPS and 4x its FY2017 book value (Pre-IPO). The agriculture GP has
QIBs
50% of issue
grown aggressively over the last 3 years largely due to the initiatives taken by the
Government and it contributed 29% of GP in FY2017 (4% in FY2014). However,
Non-Institutional
15% of issue
the financials of the company may get affected adversely if India witnesses bad
Retail
35% of issue
monsoon or successive poor monsoon seasons, drought, flooding or other
catastrophic events impacting the Indian agriculture industry. Nonetheless,
positives such as leadership position, well managed investment book, robust
Post Issue Shareholding Patter
balance sheet and reasonable valuations provide comfort, hence, we recommend
Promoters
86%
SUBSCRIBE on this Issue.
Others
14%
Key Financials
Y/E March (` cr)
FY14
FY15
FY16
FY17
Premium earned (net)
13,616
13,595
15,338
26,375
% chg
(0.2)
13
72
Net Profit
2,433
2,891
2,823
3,141
% chg
18.8
(2)
11
EPS
28
34
33
37
Book Value
159
186
214
232
P/E
32
27
28
25
P/BV
6
5
4
4
Jaikishan J Parmar
Combined Ratio (%)
108.9
108.9
107.0
100.2
+022 39357600, Extn: 6810
ROE (%)
18
18
15
16
Source: RHP, Angel Research; Note: Valuation ratios based on pre-issue outstanding shares and at upper end of the price band
Please refer to important disclosures at the end of this report
1
General Insurance Corporation of India Ltd | IPO Note
Company Background
GIC Re is the largest reinsurance company in India (owned by Government of
India) in terms of Gross Premium accepted in FY2017; this is for approximately
60% of the premiums ceded by Indian insurers to reinsurers during Fiscal 2017. It
is also an international reinsurer and underwrote business from 161 countries as
on June 30, 2017. According to CRISIL Research, GIC Re was ranked 12th largest
global reinsurer in 2016 and the 3rd largest Asian reinsurer in 2015, in terms of
gross premiums accepted.
GIC Re provides reinsurance across key business lines including fire (property),
marine, motor, engineering, agriculture, aviation/space, health, liability, credit &
finance and life insurance. Through their more than 44 years of experience in, and
commitment to, providing reinsurance products and services, the company has
become a trusted brand for insurance and reinsurance customers in India and
overseas.
Exhibit 1: Segmental Business
FY15
FY16
FY17
Outside
Outside
Outside
Business Segment
India
Total
India
Total
India
Total
India
India
India
Fire (Property)
11.0%
20.1%
31.1%
11.4%
23.7%
35.1%
8.0%
16.3%
24.3%
Marine
2.7%
4.6%
7.3%
2.0%
3.5%
5.5%
1.3%
2.1%
3.4%
Miscellaneous
Motor
19.8%
5.5%
25.2%
17.8%
6.4%
24.2%
15.2%
4.4%
19.6%
Engineering
2.9%
2.3%
5.2%
2.6%
2.2%
4.8%
1.3%
1.3%
2.6%
Agriculture
4.0%
0.2%
4.2%
6.8%
0.2%
7.0%
28.4%
0.5%
28.9%
Aviation
1.0%
3.5%
4.5%
0.1%
2.4%
2.5%
0.3%
1.7%
2.0%
Health
8.6%
5.2%
13.8%
8.9%
4.6%
13.5%
9.5%
2.9%
12.4%
Liability
0.6%
0.2%
0.8%
0.5%
0.3%
0.8%
0.5%
0.2%
0.7%
Credit
0.9%
0.1%
1.0%
0.9%
0.1%
1.0%
0.6%
0.1%
0.6%
Others (1)
4.4%
1.5%
5.9%
3.0%
1.4%
4.4%
3.5%
1.0%
4.5%
Life
0.9%
0.3%
1.1%
1.0%
0.3%
1.3%
1.1%
0.0%
1.1%
Total
56.7%
43.3%
100.0%
55.0%
45.0%
100.0%
69.5%
30.5%
100.0%
Source: RHP
Oct 10, 2017
2
General Insurance Corporation of India Ltd | IPO Note
Issue details
State owned GIC Re is a mix of Offer for sale and fresh issue. The issue would
constitute fresh issue worth of `1,569cr and Offer for sale worth of `9,804cr. The
national reinsurer will dilute 14.22% of its post-offer paid-up equity share capital.
Of this, the government will dilute 12.26% stake and the balance 1.96% by the
Corporation itself.
Note: A discount of `45 per equity share would be offered to employees and retail
individual bidders.
Exhibit 2: Pre and Post-IPO shareholding pattern
No of shares
No of shares
%
%
(Pre-issue)
(Post-issue)
Promoter
86,00,00,000 100
75,25,00,000
86
Investor/Public
12,47,00,000
14
Total
86,00,00,000 100
87,72,00,000
100
Source: RHP, Note: Calculated on upper price band
Objects of the offer
Augmenting the capital base of the Corporation to support the growth of
business and to maintain current solvency levels
General corporate purposes, subject to applicable law
Key Management Personnel
Alice G Vaidyan is the Chairman-cum-Managing Director. She holds a post
graduate degree in English language and literature from University of Kerala. She
has trained in “Strategy: Building and Sustaining Competitive Advantage” at
Harvard Business School, Boston, USA and is a fellow of the Insurance Institute of
India. She has over 30 years of experience in the Indian insurance and reinsurance
industry.
Vimal Chand Jain, is the Chief Financial Officer. He holds a bachelor’s degree of
commerce from University of Rajasthan, certificate of membership from the
Institute of Chartered Accountants of India, and is a fellow of the Insurance Institute
of India. He has been associated with GIC Re since October 2012. Previously, he
worked with New India Assurance Company Limited.
Oct 10, 2017
3
General Insurance Corporation of India Ltd | IPO Note
Investment Rationale
Leader in Indian reinsurance industry: GIC Re is the largest reinsurance company
in India with 60% market share in terms of GP accepted. It is also the 12th largest
global and 3rd largest Asian reinsurer. Over last 15 years industry GP has grown
at 15% and is expected to grow at 20% for the next 5-10 years on the back of
government initiatives, growth in distribution network and increased awareness.
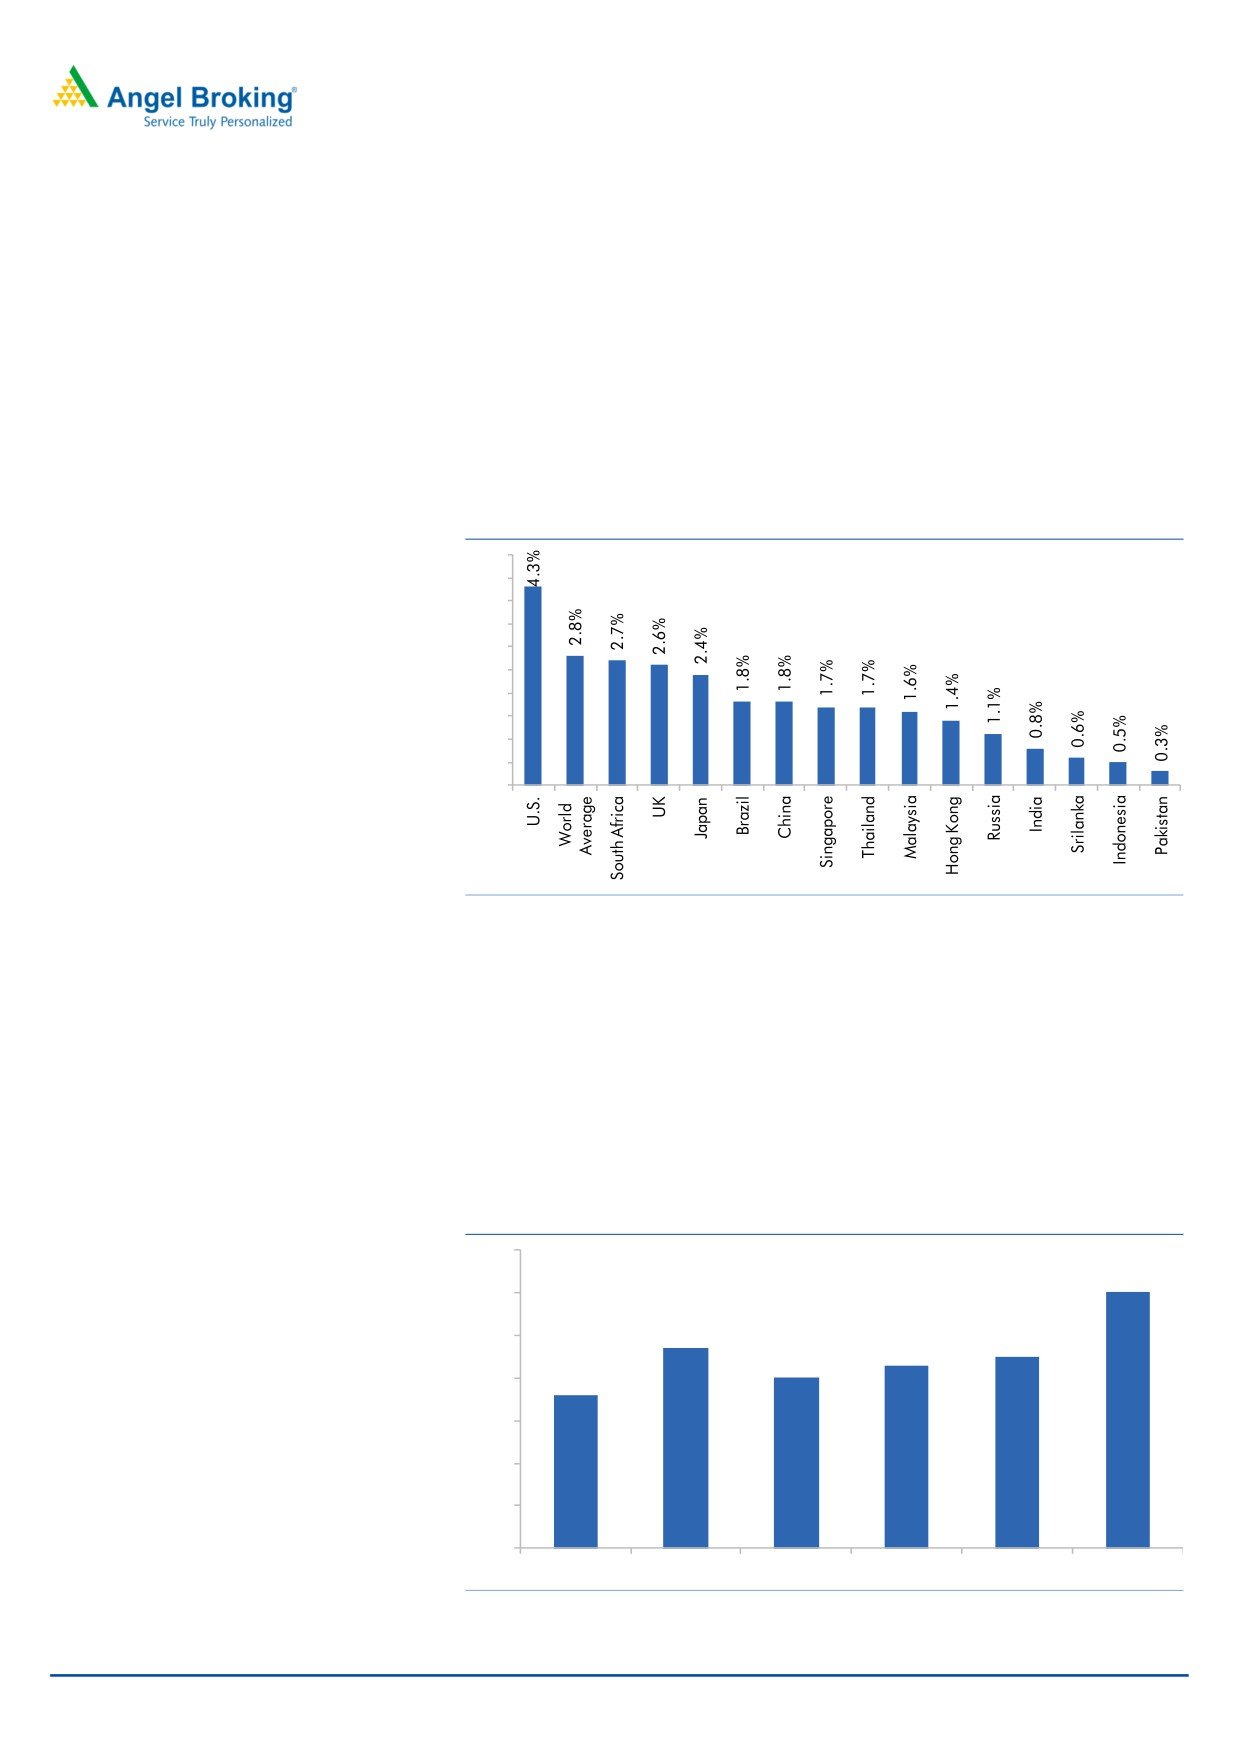
Penetration level in India (Premiums as % of GDP) is very low (0.77%) compared to
2.8% world average. We expect that an increase in awareness of general
insurance would continue to support reinsurance business at a healthy rate.
Exhibit 3: Non-Life insurance penetration as of 2016
5%
5%
Premium as % of GDP
4%
4%
3%
3%
2%
2%
1%
1%
0%
Source: RHP
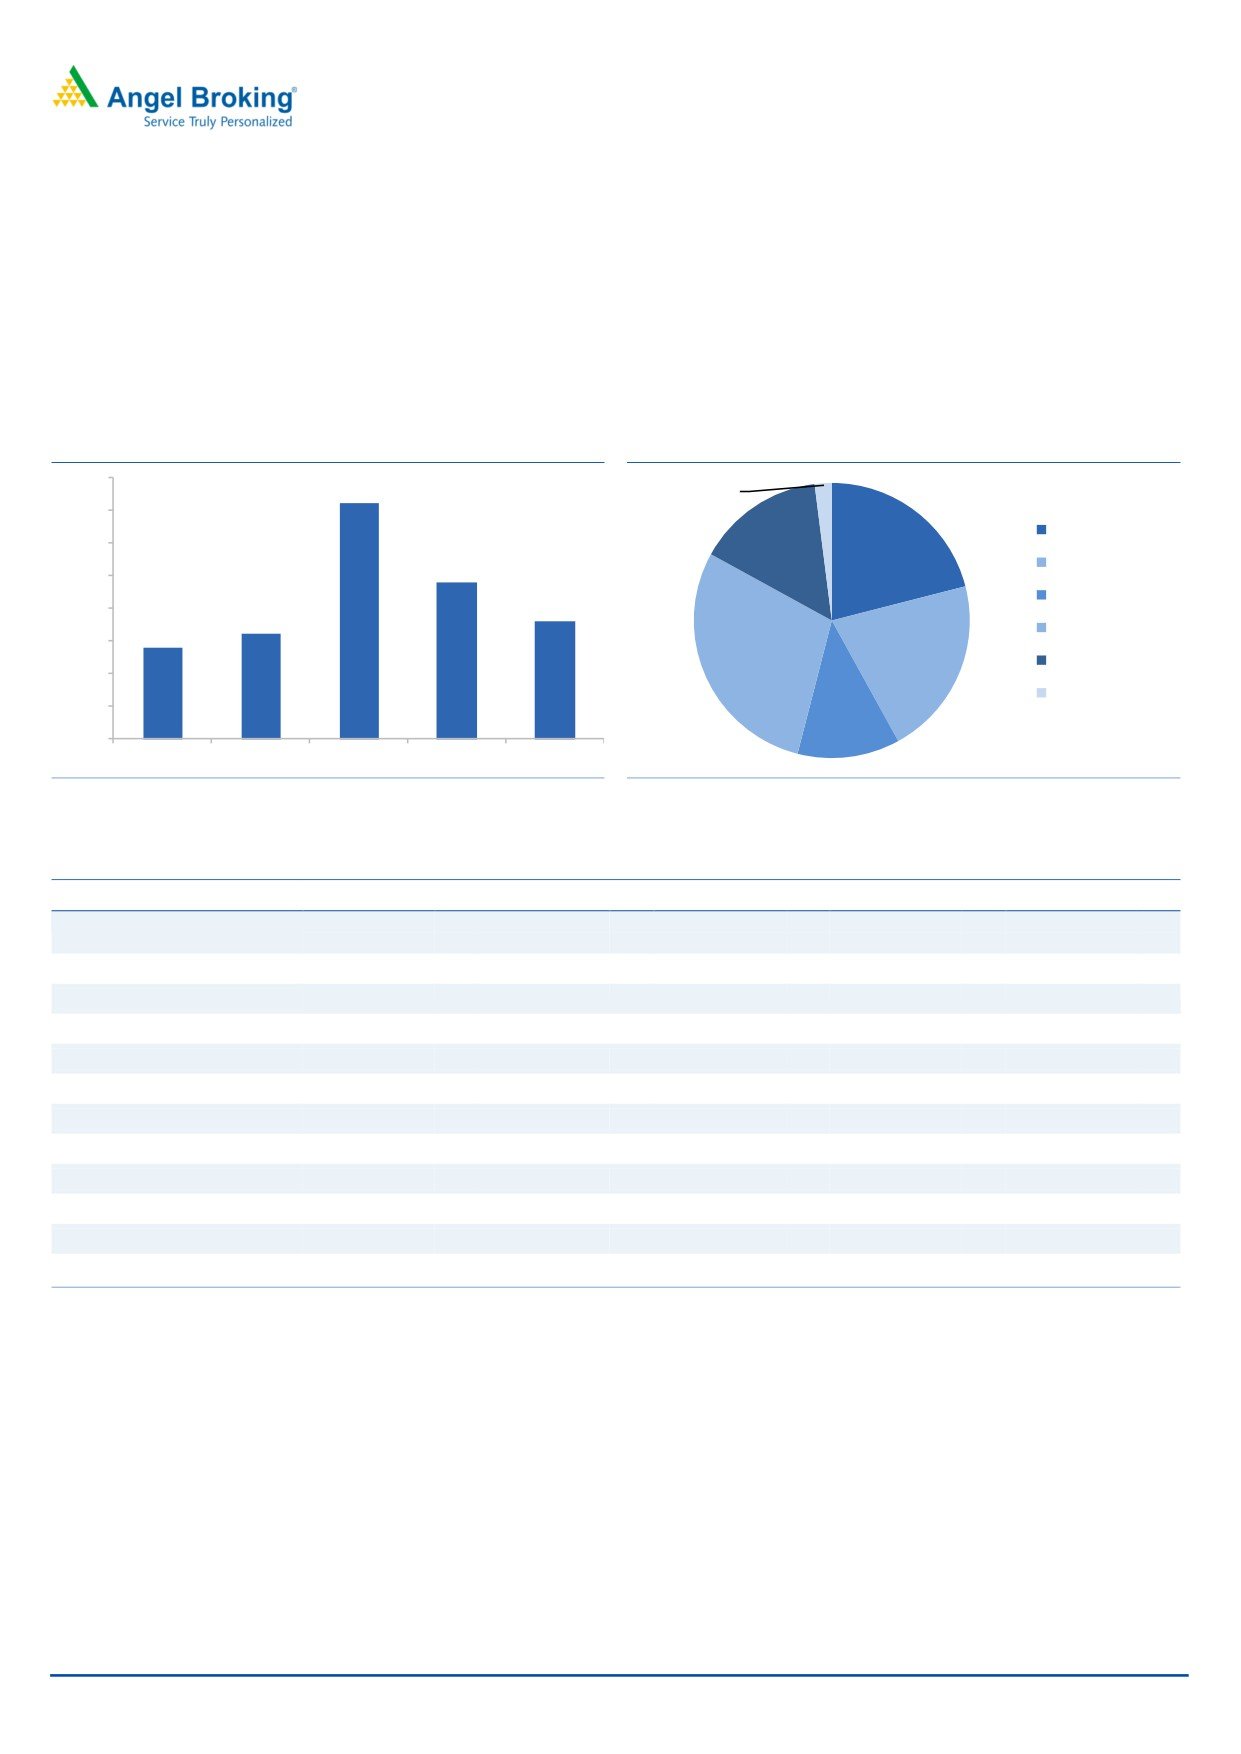
According to CRISIL Research, size of the Indian reinsurance market was estimated
to be approximately ₹388 billion in Fiscal 2017. The reinsurance market in India
grew at a healthy 15% CAGR in the ten fiscal years ending FY2017. In Fiscal
2017, premiums ceded to reinsurers increased by 73%, as non-life insurance
premiums grew by 32% on-year and retention ratios declined close to 9%. The
sharp jump in non-life premiums in Fiscal 2017 was driven by a four-fold increase
in crop insurance premiums. Even after excluding crop insurance, premium growth
in Fiscal 2017 remained healthy at 18%.
Exhibit 4: Market share of GIC Re in India
70%
60%
60%
47%
50%
45%
43%
40%
40%
36%
30%
20%
10%
0%
FY12
FY13
FY14
FY15
FY16
FY17
Source: RHP
Oct 10, 2017
4
General Insurance Corporation of India Ltd | IPO Note
Diversified portfolio leading to better yields: As on 1QFY2018, GIC Re had an
investment book worth `41,930cr carrying value (`73,903cr Market value) on
which company has been able to generate yield of 12.3% for FY2017. For
FY2013/FY2014/FY2015/FY2016 it has managed to generate yield of
11.9%/12.1%/14.1%/12.9% respectively. As on Q1FY18, the company’s fixed
income debt securities, equities and money market instruments accounted for
61.49%, 20.21% and 17.12% respectively.
Exhibit 5: Investment Performance
Exhibit 6: Composition of the Indian Investment Assets
14.5%
14.1%
2%
14.0%
15%
Equity
21%
13.5%
12.9%
Central Govt. Sec
13.0%
State Govt. Sce
12.5%
12.3%
12.1%
11.9%
Bond
12.0%
29%
21%
Money Market
11.5%
Others
11.0%
10.5%
12%
FY13
FY14
FY15
FY16
FY17
Source: RHP
Source: RHP
Exhibit 7: Investment Income and Yield Without Unrealized Gains
(` in Cr)
2013
2014
2015
2016
2017
Investment
Yield
Investment Yield
Investment Yield Investment Yield
Investment Yield
Income
Income
Income
Income
Income
Equity
1,344 21%
1,508 22%
2,202 31%
2,046 27%
2,202 28%
Fixed Income Securities
... Central Govt Securities
412
8%
495
8%
548
8%
611
8%
661
8%
…State Govt Securities
210
8%
244
8%
292
9%
341
8%
391
9%
…Other Approved Securities
42
8%
37
8%
35
8%
31
7%
28
8%
...Debentures and Bonds
558
9%
696
9%
784
9%
867
9%
965
9%
...Money Market Instruments
268 10%
288
9%
268
9%
239
8%
223
5%
Loans
45
9%
49 11%
39 10%
39 10%
35 10%
Venture Capital Funds
4
3%
5
3%
8
5%
0
0%
10
6%
Preference Shares
5
5%
0
2%
-0
-5%
1
8%
0
6%
Total Investments
2,889 12%
3,321 12%
4,176 14%
4,175 13%
4,516 12%
Source:RHP
Oct 10, 2017
5
General Insurance Corporation of India Ltd | IPO Note
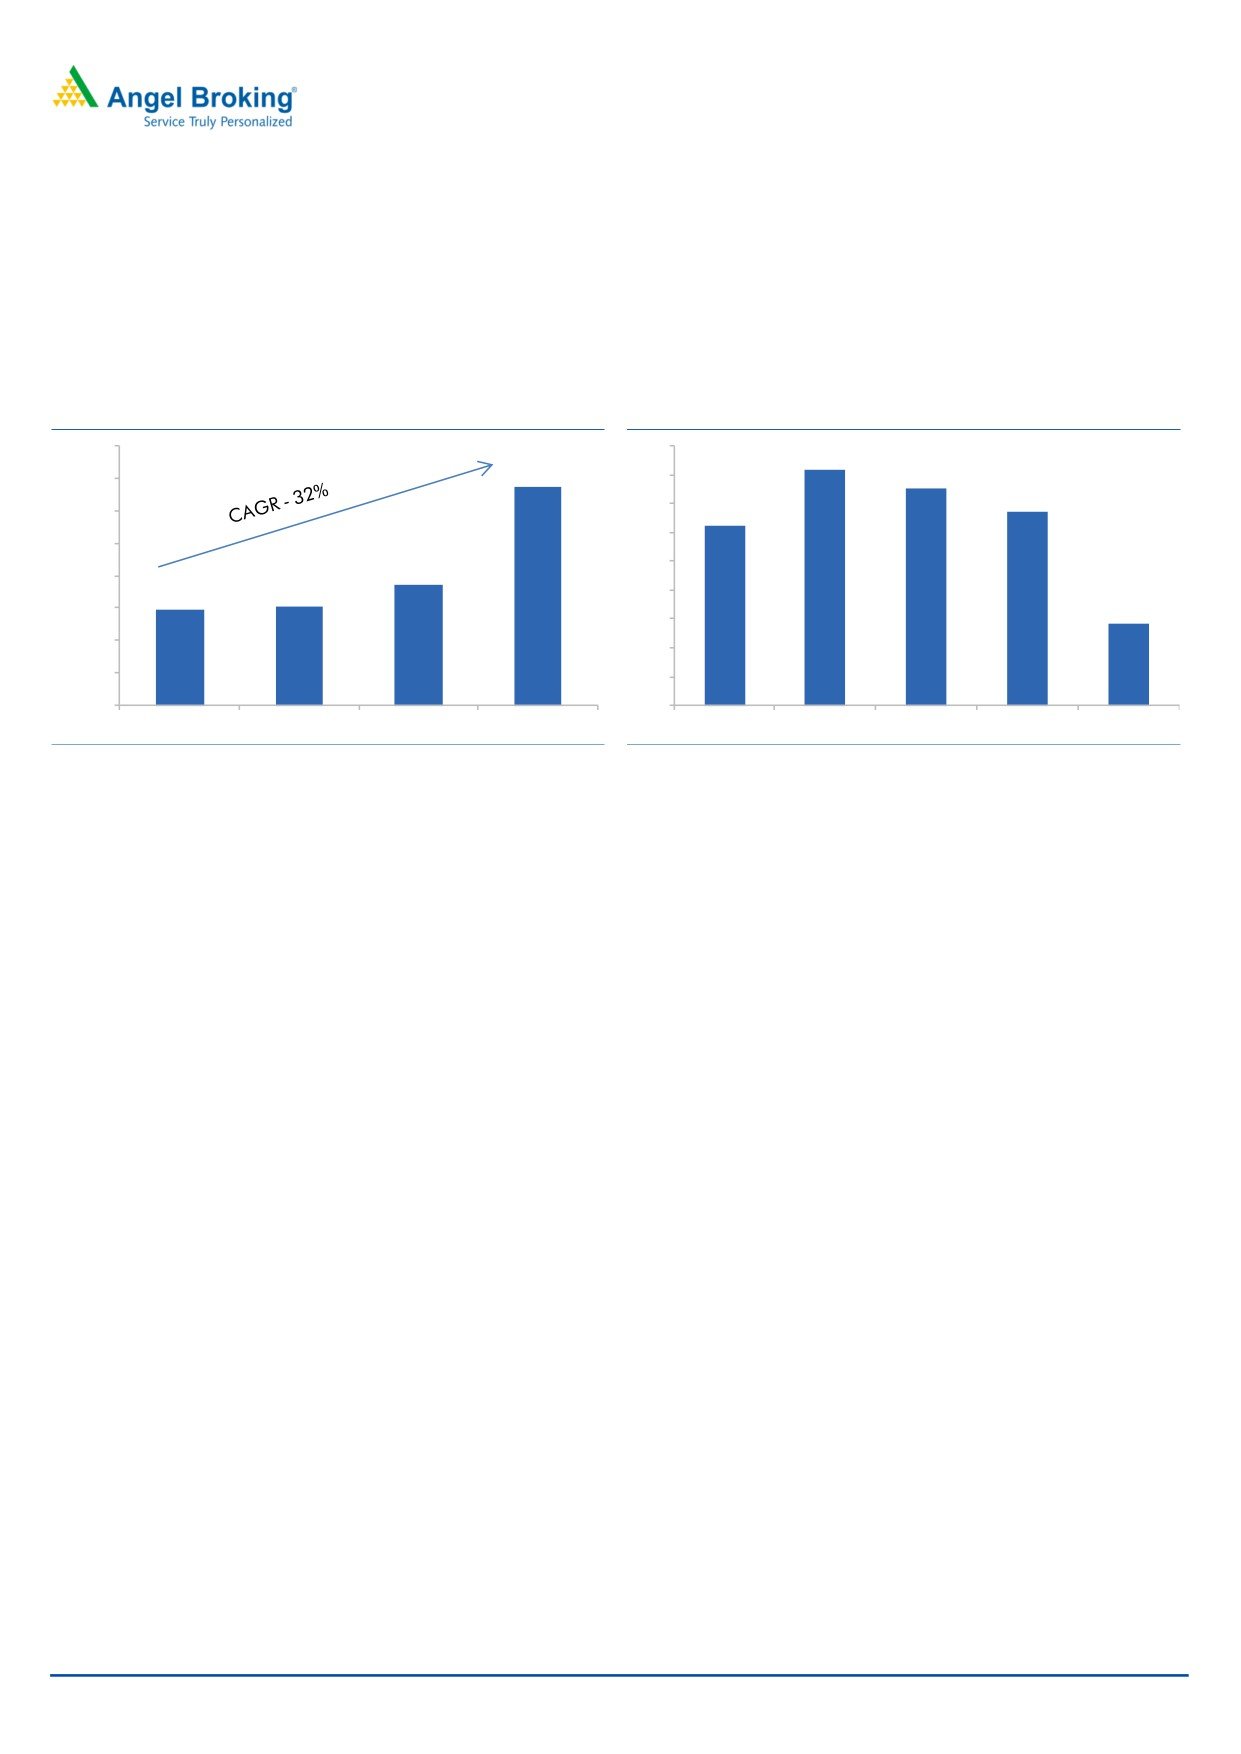
Strong financials with improved combined ratio: GP over last 4/3 years has grown
at healthy CAGR of 22%/32% respectively. On the bottom-line front, the company
has reported CAGR of ~12% over FY2013-16. Return on equity (ROE) for FY2017
was 16% and last 4 years average ROE is 17%. The combined ratio has declined
from 106.5% in FY2013 to 99.7% in FY2017 due to an increase in Agriculture GP.
Exhibit 8: Gross Premium growth trend (` in cr)
Exhibit 9: Combined Ratio Trend (%)
112
40,000
110.3
33,741
109
35,000
110
107.4
30,000
108
106.5
106
25,000
104
18,534
20,000
14,680
15,270
102
15,000
99.7
100
10,000
98
5,000
96
0
94
FY14
FY15
FY16
FY17
FY13
FY14
FY15
FY16
FY17
Source: RHP
Source: RHP
Company’s future strategy
Expand and leverage leadership position in domestic reinsurance industry
Expand the presence internationally and grow overseas business
Focus on improving profitability through reduction in combined ratio
Grow the life reinsurance and other business lines in India and overseas
markets
Oct 10, 2017
6
General Insurance Corporation of India Ltd | IPO Note
Outlook & Valuation:
At the upper end of the IPO price band it is offered at 25x its FY2017 EPS and 4x
its FY2017 book value (Pre-IPO). The agriculture GP has grown aggressively over
the last 3 years largely due to the initiatives taken by the Government and it
contributed 29% of GP in FY2017 (4% in FY2014). However, the financials of the
company may get affected adversely if India witnesses bad monsoon or successive
poor monsoon seasons, drought, flooding or other catastrophic events impacting
the Indian agriculture industry. Nonetheless, positives such as leadership position,
well managed investment book, robust balance sheet and reasonable valuations
provide comfort, hence, we recommend SUBSCRIBE on this Issue.
Key Risks
Underwriting risk
The success of GIC Re depends upon the ability to accurately assess the risks
associated with the businesses that it reinsures. If actual losses exceed
estimated loss reserves, then net income and capital position will be reduced.
Hampered agricultural industry
The financials of GIC Re may get adversely affected, if India witnesses a bad
monsoon or successive poor monsoon seasons, drought, flooding or other
disastrous events which could hamper the Indian agricultural industry.
Catastrophic losses
Events such as windstorms, hurricanes, tsunamis, earthquakes, floods,
hailstorms, tornadoes, severe winter, fire, drought, explosions and other
natural and man-made disasters, are some incidents whose severity is highly
unpredictable. These catastrophic events pose a risk for GIC Re.
Oct 10, 2017
7
General Insurance Corporation of India Ltd | IPO Note
Income Statement
Y/E March (` cr)
FY14
FY15
FY16
FY17
Operating Profit/(Loss)
(a) Fire Insurance
14
1,318
732
637
(b) Marine Insurance
451
(122)
407
210
(c) Miscellaneous Insurance
1,131
326
381
1,404
(d) Life Insurance
7
39
70
(110)
Operating Profit from Insurance
1,603
1,561
1,590
2,142
% chg
(3)
2
35
Income from Investments
(a) Interest, Dividend & Rent - Gross
673
747
893
1,020
(b) Profit on sale of Investments
310
555
544
619
Less: Loss of sale of Investment
-
-
-
-
Other Income:
110
235
243
18
Profit on Exchange
101
-
83
0
Profit on sale of Assets (Net)
-
(0)
-
-
Sundry Balances Written Back (Net)
-
-
-
-
Interest on Income-tax Refund
5
233
-
17
Motor Pool Service changes
3
-
-
-
(Provision) / Doubtful Debts written back
-
-
157
-
Miscellaneous Receipts
0
2
2
1
Total Income
2,696
3,098
3,269
3,799
% chg
15
6
16
Provision for Doubtful Loans & Investment
125
3
42
29
Provision for Doubtful Debts
-
108
-
231
Amortisation of premium on Investments
20
18
19
19
Diminution in the value of investments written off
111
59
136
56
Other Expenses :
-
-
-
-
Expenses relating to Investments
1
1
1
2
Loss on Exchange
-
29
-
24
(Profit)/Loss on sale of Assets (Net)
(0)
-
(0)
0
Sundry Balances Written off (Net)
-
-
-
-
Interest Motor Pool & Others
137
32
1
6
IPO Expenses
-
-
-
-
Total (B)
394
268
248
382
Profit Before Tax
2,302
2,831
3,021
3,417
Provisions for Taxation
(17)
29
332
412
as a % of PBT
-
1
11
12
Profit After Tax
2,319
2,801
2,690
3,004
Share of Profit in Associate Companies
114
90
134
136
Profit for the year
2,433
2,891
2,823
3,141
% chg
19
(2)
11
EPS
28
34
33
37
Source:RHP
Oct 10, 2017
8
General Insurance Corporation of India Ltd | IPO Note
Balance Sheet
Y/E March (` cr)
FY14
FY15
FY16
FY17
SOURCES OF FUNDS
Share Capital
430
430
430
430
Reserves and Surplus
13,224
15,594
17,988
19,539
Net Worth
13,654
16,024
18,418
19,969
- Growth (%)
17
15
8
Borrowings
-
-
-
-
Deferred Tax Liability
-
-
-
-
Fair Value Change Account
20,532
28,148
23,457
30,037
Total
34,186
44,172
41,875
50,006
APPLICATION OF FUNDS
Investments
46,679
56,758
55,686
66,212
- Growth (%)
22
(2)
19
Loans
424
394
366
322
Fixed Assets
118
143
176
169
Goodwill on Consolidation
-
38
38
38
Deferred Tax Asset
24
9
11
16
Current Assets:
-
-
-
-
Cash and Bank Balances
8,264
7,749
9,779
12,231
Advances and Other Assets
8,486
9,826
10,047
18,090
Current Assets
16,750
17,575
19,827
30,322
Current Liabilities
22,433
22,774
25,072
33,809
Provisions
7,376
7,971
9,156
13,264
Sub-Total (B)
29,809
30,745
34,228
47,074
Net Current Assets
(13,059)
(13,169)
(14,402)
(16,752)
Miscellaneous Expenditure
-
-
-
-
Total
34,186
44,172
41,875
50,006
- Growth (%)
29
(5)
19
Contingent Liabilities
3,036
3,086
2,766
3,317
Source: RHP
Oct 10, 2017
9
General Insurance Corporation of India Ltd | IPO Note
Key Ratio
Y/E March (` cr)
FY14
FY15
FY16
FY17
Valuation Ratio
P/E
32
27
28
25
P/B
5.7
4.9
4.3
3.9
Profitability ratios (%)
ROE
18
18
15
16
ROA
7.1
6.5
6.7
6.3
Yield in Investment
12.1
14.1
12.9
12.3
Per Share Data (`)
EPS
28
34
33
37
BV
159
186
214
232
Operating Ratio (%)
Solvency Ratio
2.9
3.3
3.8
2.4
Claim Ratio
88.9
87.6
84.5
81.6
Commission Ratio
20.1
21.3
17.7
Combined Ratio (CONSOL) (%)
108.9
108.9
107.0
100.2
- Fire
-
93.2
101.2
103.7
- Marine
-
129.5
91.2
101.6
- Motor
-
124.4
113.3
114.0
- Engineering
-
89.9
59.5
69.7
- Agriculture
-
112.9
169.5
92.2
- Aviation
-
102.8
90.9
109.2
- Health
-
132.7
113.8
110.3
- Liability
-
13.3
63.2
70.9
- Credit
-
118.0
184.7
31.3
- Life
-
81.9
77.7
148.4
Oct 10, 2017
10
General Insurance Corporation of India Ltd | IPO Note
Research Team Tel: 022 - 39357800
DISCLAIMER
Angel Broking Private Limited (hereinafter referred to as “Angel”) is a registered Member of National Stock Exchange of India Limited,
Bombay Stock Exchange Limited and Metropolitan Stock Exchange Limited. It is also registered as a Depository Participant with CDSL
and Portfolio Manager and investment advisor with SEBI. It also has registration with AMFI as a Mutual Fund Distributor. Angel Broking
Private Limited is a registered entity with SEBI for Research Analyst in terms of SEBI (Research Analyst) Regulations, 2014 vide
registration number INH000000164. Angel or its associates has not been debarred/ suspended by SEBI or any other regulatory
authority for accessing /dealing in securities Market. Angel or its associates/analyst has not received any compensation / managed or
co-managed public offering of securities of the company covered by Analyst during the past twelve months.
This document is solely for the personal information of the recipient, and must not be singularly used as the basis of any investment
decision. Nothing in this document should be construed as investment or financial advice. Each recipient of this document should
make such investigations as they deem necessary to arrive at an independent evaluation of an investment in the securities of the
companies referred to in this document (including the merits and risks involved), and should consult their own advisors to determine
the merits and risks of such an investment.
Reports based on technical and derivative analysis center on studying charts of a stock's price movement, outstanding positions and
trading volume, as opposed to focusing on a company's fundamentals and, as such, may not match with a report on a company's
fundamentals. Investors are advised to refer the Fundamental and Technical Research Reports available on our website to evaluate the
contrary view, if any.
The information in this document has been printed on the basis of publicly available information, internal data and other reliable
sources believed to be true, but we do not represent that it is accurate or complete and it should not be relied on as such, as this
document is for general guidance only. Angel Broking Pvt. Limited or any of its affiliates/ group companies shall not be in any way
responsible for any loss or damage that may arise to any person from any inadvertent error in the information contained in this report.
Angel Broking Pvt. Limited has not independently verified all the information contained within this document. Accordingly, we cannot
testify, nor make any representation or warranty, express or implied, to the accuracy, contents or data contained within this document.
While Angel Broking Pvt. Limited endeavors to update on a reasonable basis the information discussed in this material, there may be
regulatory, compliance, or other reasons that prevent us from doing so.
This document is being supplied to you solely for your information, and its contents, information or data may not be reproduced,
redistributed or passed on, directly or indirectly.
Neither Angel Broking Pvt. Limited, nor its directors, employees or affiliates shall be liable for any loss or damage that may arise from
or in connection with the use of this information.
Oct 10, 2017
11