2QFY2016 Result update | Power Cables
November 17, 2015
Finolex Cables
NEUTRAL
CMP
`258
Performance Highlights
Target Price
-
Y/E March (` cr)
2QFY16 2QFY15
% chg (yoy) 1QFY16
% chg (qoq)
Investment Period
-
Total operating income
605
637
(4.9)
588
2.9
EBITDA
75
80
(5.9)
73
3.4
Stock Info
EBITDA Margin (%)
12.5
12.6
(12)bp
12.4
6bp
Adj. PAT
65
79
(17.8)
48
35.2
Sector
Cables-Power
Source: Company, Angel Research
Market Cap (` cr)
3,953
Finolex Cables (FCL) has reported its 2QFY2016 numbers which are below our
Net Debt
(581.4)
estimates. The top-line declined by 4.9% yoy to `605cr. The decline is on
Beta
0.7
account of lower commodity prices which were passed on, resulting in lower
52 Week High / Low
306 / 215
realizations. The raw material cost declined by 178bp yoy to 72.1% of sales but
Avg. Daily Volume
37,448
the same was negated by 59bp yoy increase in employee cost to 4.3% of sales
and 131bp yoy increase in other expenses to 11.1% of sales. This resulted in
Face Value (`)
2
the EBITDA margin contracting by 12bp yoy to 12.5%. Other income during the
BSE Sensex
25,760
quarter declined by 24.4% yoy to `28cr. As a result, the net profit declined by
Nifty
7,807
17.8% yoy to `65cr against `79cr in the same quarter of the previous year.
Reuters Code
FNXC.BO
Revival in capex cycle to drive growth: The growth of the company is closely
Bloomberg Code
FNXC.IN
related to revival in the capex cycle of the industries catered to. The company
has evolved into an electrical equipment company from a wire and cables
Shareholding Pattern (%)
company by enhancing its product portfolio with entry into new product
segments. This is expected to drive earning of the company in the coming
Promoters
35.9
years. With the government’s increased focus on industrial and infrastructure
MF / Banks / Indian Fls
14.9
sectors, FCL is well placed to reap benefits of the same. However, in the near
FII / NRIs / OCBs
7.5
term the outlook is subdued with no visible signs of pick-up.
Indian Public / Others
41.7
Higher tax rate to dent profitability, recommend Neutral: We expect the
company’s top-line and EBITDA to post a 8.5% and 15.2% CAGR over
Abs.(%)
3m 1yr
3yr
FY2015-17E to `2,883cr and `345cr respectively with EBITDA margin at
Sensex
(7.6)
(8.6)
40.7
12.0% in FY2017E. However, benefit of low material cost and interest outgo is
Finolex
2.1
4.0
420.5
expected to be offset by higher tax rate which will dent profitability. As a result,
the bottom-line is expected to post a modest CAGR of 4.3% for the same
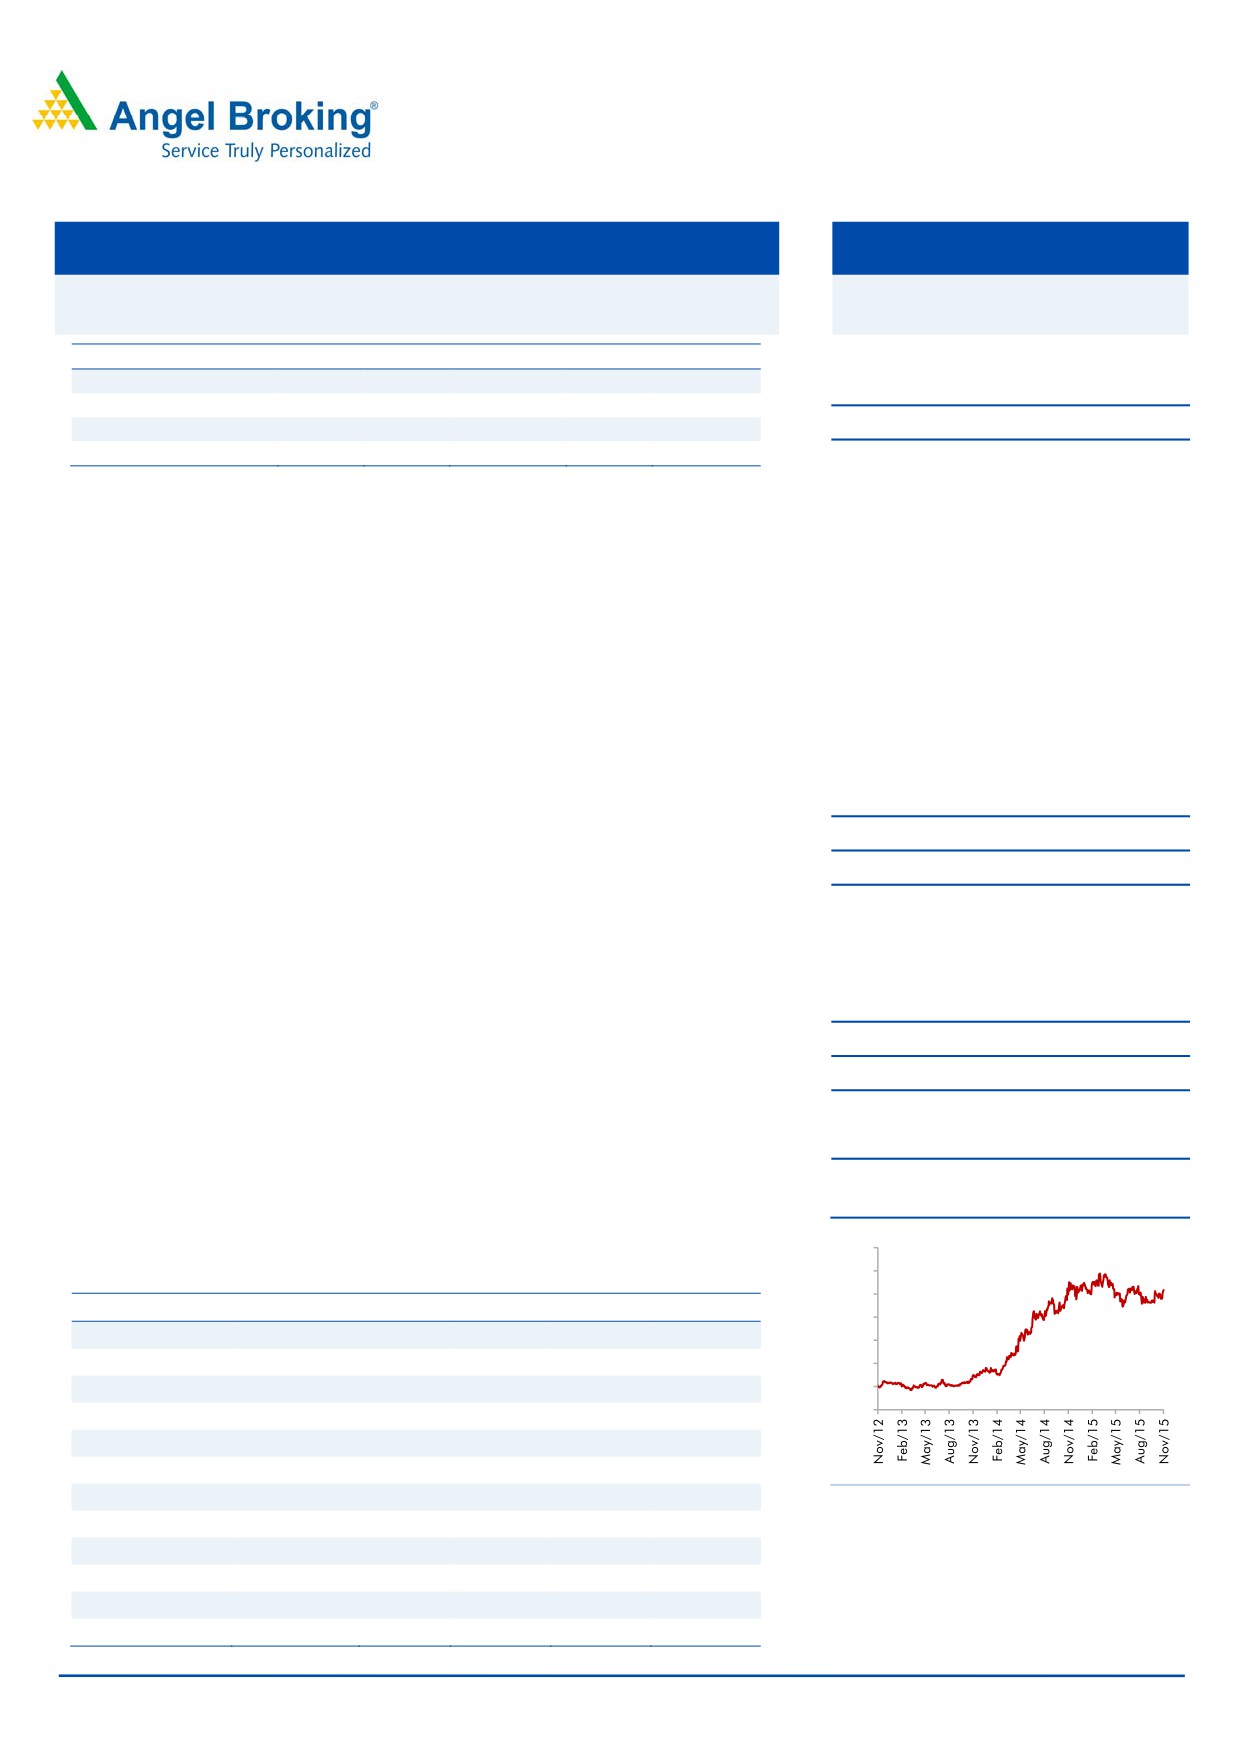
3-Year Daily Price Chart
period to `217cr. We recommend a Neutral rating on the stock as it trades at
fair valuations of 18.2x its FY2017E earnings.
350
300
Key Financials
250
Y/E March (` cr)
FY2013
FY2014
FY2015
FY2016E
FY2017E
200
Net Sales
2,271
2,359
2,449
2,520
2,883
150
% chg
10.0
3.9
3.8
2.9
14.4
100
50
Net Profit
145
208
199
194
217
-
% chg
47.9
43.0
(4.0)
(2.8)
12.1
EBITDA Margin (%)
10.1
10.5
10.6
12.2
12.0
FDEPS (`)
9.5
13.6
13.0
12.7
14.2
P/E (x)
27.2
19.0
19.8
20.4
18.2
Source: Company, Angel Research
P/BV (x)
4.3
3.6
3.1
2.8
2.5
RoE (%)
15.7
18.8
15.8
13.6
13.5
RoCE (%)
23.5
25.4
27.6
33.7
34.0
Milan Desai
EV/Sales (x)
1.7
1.5
1.4
1.3
1.1
+91 22 4000 3600 Ext: 6846
EV/EBITDA (x)
16.3
14.6
13.0
10.8
9.2
Source: Company, Angel Research; Note: CMP as of November 16, 2015
Please refer to important disclosures at the end of this report
1
Finolex Cables | 2QFY2016 Result update
Exhibit 1: 2QFY2016 performance highlights
Y/E March (` cr)
2QFY16
2QFY15
% chg (yoy) 1QFY16
% chg (qoq) 1HFY16 1HFY15
% chg
Total operating income
605
637
(4.9)
588
2.9
1,194
1,209
(1.3)
Net raw material
436
470
(7.2)
423
3.1
860
899
(4.4)
(% of Sales)
72.1
73.9
(178)bp
71.9
15bp
72.0
74.4
(238)bp
Employee cost
26
24
10.2
25
3.9
51
46
10.8
(% of Sales)
4.3
3.7
59bp
4.3
4bp
4.3
3.8
47bp
Other Expenses
67
63
7.8
67
0.7
134
127
5.7
(% of Sales)
11.1
9.8
131bp
11.4
(25)bp
11.3
10.5
74bp
Total expenditure
530
557
(4.8)
515
2.8
1,045
1,073
(2.6)
EBITDA
75
80
(5.9)
73
3.4
148
136
9.0
EBITDA Margin (%)
12.5
12.6
(12)bp
12.4
6bp
12.4
11.3
10bp
Interest
3
3
(19.8)
3
(14.8)
6
7
(12.4)
Depreciation
13
14
(6.5)
13
0.8
26
28
(6.1)
Other income
28
37
(24.4)
9
227.5
37
45
(18.0)
PBT
88
100
(12.2)
65
34.1
153
146
4.6
(% of Sales)
14.5
15.7
11.1
12.8
12.1
Tax
23
21
8.9
17
31.0
40
33
22.9
(% of PBT)
25.9
20.9
26.5
26.2
22.3
Reported PAT
65
79
(17.8)
48
35.2
113
114
(0.6)
Exceptional items
0
0
0
0
0
Adjusted PAT
65
79
(17.8)
48
35.2
113
114
(0.6)
PATM (%)
10.7
12.4
8.2
9.5
9.4
Source: Company, Angel Research
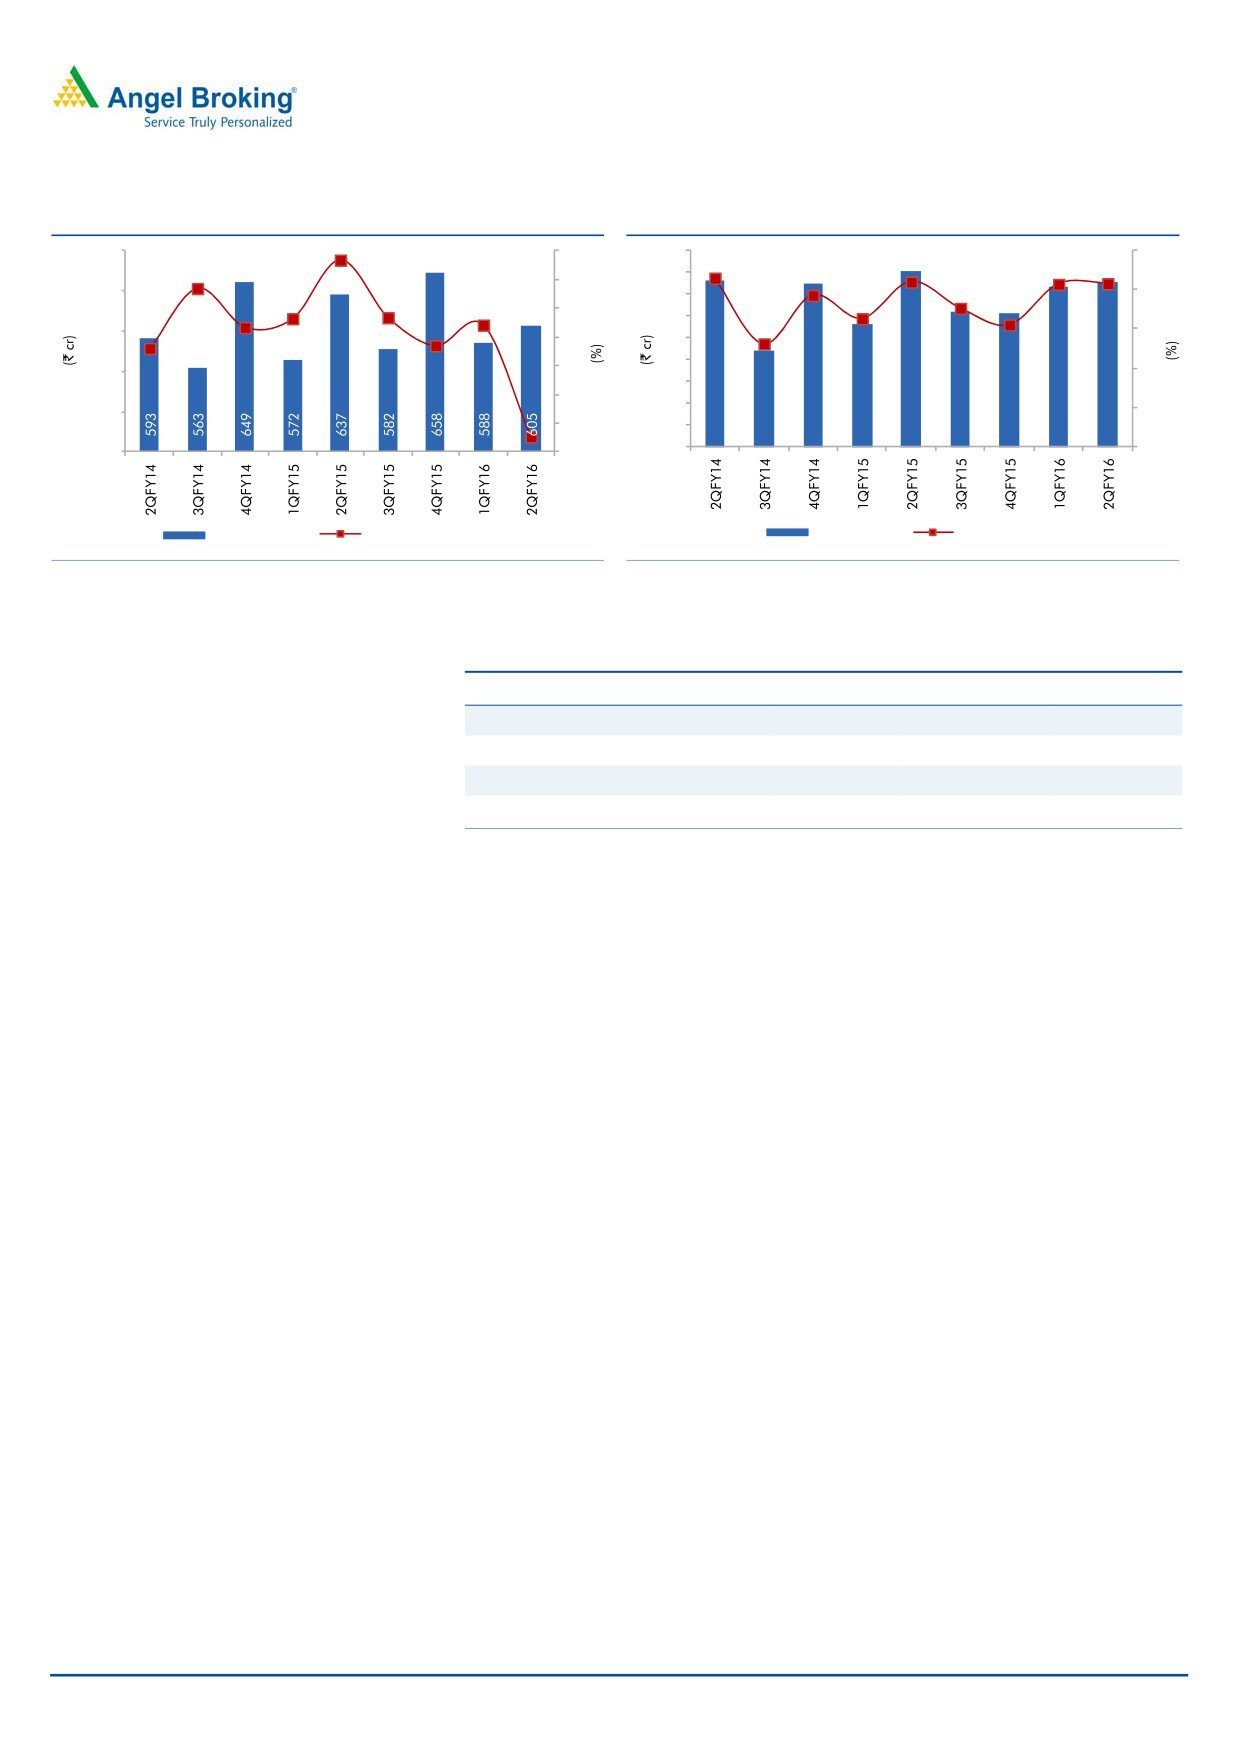
Performance below expectations
FCL’s 2QFY2016 numbers have come in below our estimates. The top-line
declined by 4.9% yoy to `605cr, which is below our estimate of `691cr. The
decline is on account of lower commodity prices, which were passed on, resulting
in lower realizations. In terms of volume growth, Electrical Cables posted modest
growth numbers while Communication Cables posted a more than 20% yoy
growth. The raw material cost declined by 178bp yoy to 72.1% of sales but the
same was negated by 59bp yoy increase in employee cost to 4.3% of sales and
131bp yoy increase in other expenses to 11.1% of sales. This resulted in the
EBITDA margin contracting by 12bp yoy to 12.5%. Other income during the
quarter declined by 24.4% yoy to `28cr, but the same is in-line with our estimate
of `27cr. As a result, the net profit declined by 17.8% yoy to `65cr as against
`79cr in the same quarter of the previous year.
November 17, 2015
2
Finolex Cables | 2QFY2016 Result update
Exhibit 2: Revenue growth continues to disappoint
Exhibit 3: EBIDTA margins declines further
680
2.7
7.4
8
90
15
5.4
12.9
12.6
12.4
12.5
(4.9)
6
80
11.6
640
10.6
12
2.8
70
1.2
3.3
3.4
9.8
9.3
4
60
1.4
7.9
600
9
2
50
40
560
0
6
30
(2)
20
3
520
(4)
10
76
44
75
56
80
62
61
73
75
480
(6)
0
0
Revenue (LHS)
Revenue growth yoy (RHS)
EBITDA (LHS)
EBITDA Margin (RHS)
Source: Company, Angel Research
Source: Company, Angel Research
Exhibit 4: Actual vs Angel’s Estimates for 2QFY2016
Particulars
Actual (` cr)
Estimate (` cr)
% Variation
Total Income (` cr)
605
691
(12.4)
EBITDA (`cr)
75
96
(21.2)
EBITDA Margin (%)
12.5
13.9
(139)bp
Adjusted PAT (` cr)
65
80
(19.0)
Source: Company, Angel Research
Segment-wise performance
For 2QFY2016, revenue from the Electrical cables (EC) segment declined by
10% yoy to `491cr. This was owing to lower realization as the company had to
pass on the benefit of lower copper prices to the customers. EBIT for the segment
declined by 13.4% yoy and came in at `70cr, while the EBIT margin contracted by
55bp yoy to 14.2%.
The Communication cables (CC) segment revenue grew by 113.1% yoy to `110cr.
EBIT increased by 668.3% yoy to `13cr, resulting in margin expanding by
824bp yoy to 11.4%.
The revenue from Continuous Copper Rods (CCR) segment declined by 91.0% yoy
to `4cr during the quarter. The EBIT margins came in at 14.0% vs. 3.5% in
2QFY2015. The segment’s contribution has been declining gradually since the
company is reducing its exposure to third parties owing to thin margins and
production is mainly for captive purpose.
November 17, 2015
3
Finolex Cables | 2QFY2016 Result update
Exhibit 5: Segment-wise performance
Y/E March (` cr)
2QFY16
2QFY15
% chg (yoy) 1QFY16
% chg (qoq)
Total Revenue
A) Electrical Cables
491
546
(10.0)
502
(2.2)
B) Communications Cables
110
52
113.1
63
75.8
C) Copper Rods
4
39
(91.0)
23
(84.8)
D) Others
15
72
(79.7)
8
72.1
Total Net sales
605
637
(4.9)
588
2.9
EBIT
A) Electrical Cables
70
80
(13.4)
81
(14.0)
B) Communications Cables
13
2
668.3
6
127.4
C) Copper Rods
0
1
(64.2)
0
345.5
D) Others
7
20
(61.9)
(18)
(141.0)
Total EBIT
90
103
(12.4)
68
31.9
EBIT Margin (%)
A) Electrical Cables
14.2
14.7
(55)bp
16.1
(195)bp
B) Communications Cables
11.4
3.2
824bp
8.8
259bp
C) Copper Rods
14.0
3.5
1,046bp
0.5
1,352bp
D) Others
51.2
27.3
2,392bp
(215.3)
26,658bp
Source: Company, Angel Research
November 17, 2015
4
Finolex Cables | 2QFY2016 Result update
Investment arguments
Capex plans to complement revival in user industry
FCL serves varied user industries through its EC segment with contribution from the
construction sector being the largest followed by industrial, automotive, power and
agriculture sectors. The construction sector growth appears to be coming in from
Tier 2 and Tier 3 cities rather than being restricted to larger cities. With the
government determined on developing a robust and stable infrastructure and
industrial activity expected to pick-up, potential demand outlook for the company’s
offering looks encouraging.
FCL has executed its capex plans which have lead to higher capacity at its existing
plants coupled with technological upgradation. In the CC segment, the company
has been awarded a tender of `200cr by the National Optical Fibre Network
(NOFN) backbone project and in order to service the tender, FCL has expanded its
capacity at Urse and Goa from 8,000 km-a-month to 10,000 km-a-month.
Organic growth and diversifying portfolio to drive earnings
FCL has a wide range of products in its offering, ranging within speaker wires, to
T5 tube lights and fittings in the lighting division. Further, FCL forayed into
manufacturing of electrical products like electric motors and transformers with a
separate dealer network for these products. The company has been expanding its
presence in north and central India by gradually adding dealers and distributors.
The company also has set up a new switchgear division that will initially make
miniature circuit breakers. Given its wide distribution network and strong brand
recall, we expect the company to take advantage of the same which will lead to
higher earnings growth going ahead. Further, with an expansion of its product
portfolio, FCL intends to change its legacy image of being a cable and wire
manufacturer to a ‘manufacturer of electrical products’.
Changing sales mix to boost margins
The company has expanded its product portfolio which includes high margin
products which will improve realizations and margins. Further, FCL is gradually
reducing its exposure to the copper rod segment as the surplus production was
used for third party sales which have low margins. The company has increased its
focus on creating brand awareness across product lines through increased
advertisement expense and increasing distribution reach.
Healthy balance sheet
The company has been successful in its debt reduction plans and has been utilizing
internal accruals to reduce debt. This will lead to saving in interest expense going
ahead which will improve its profit. The cash generation from operating activities
continues to be strong. The working capital days reduced to 34 days in FY2015,
led by lower trade receivables days and higher payable days.
November 17, 2015
5
Finolex Cables | 2QFY2016 Result update
Financials
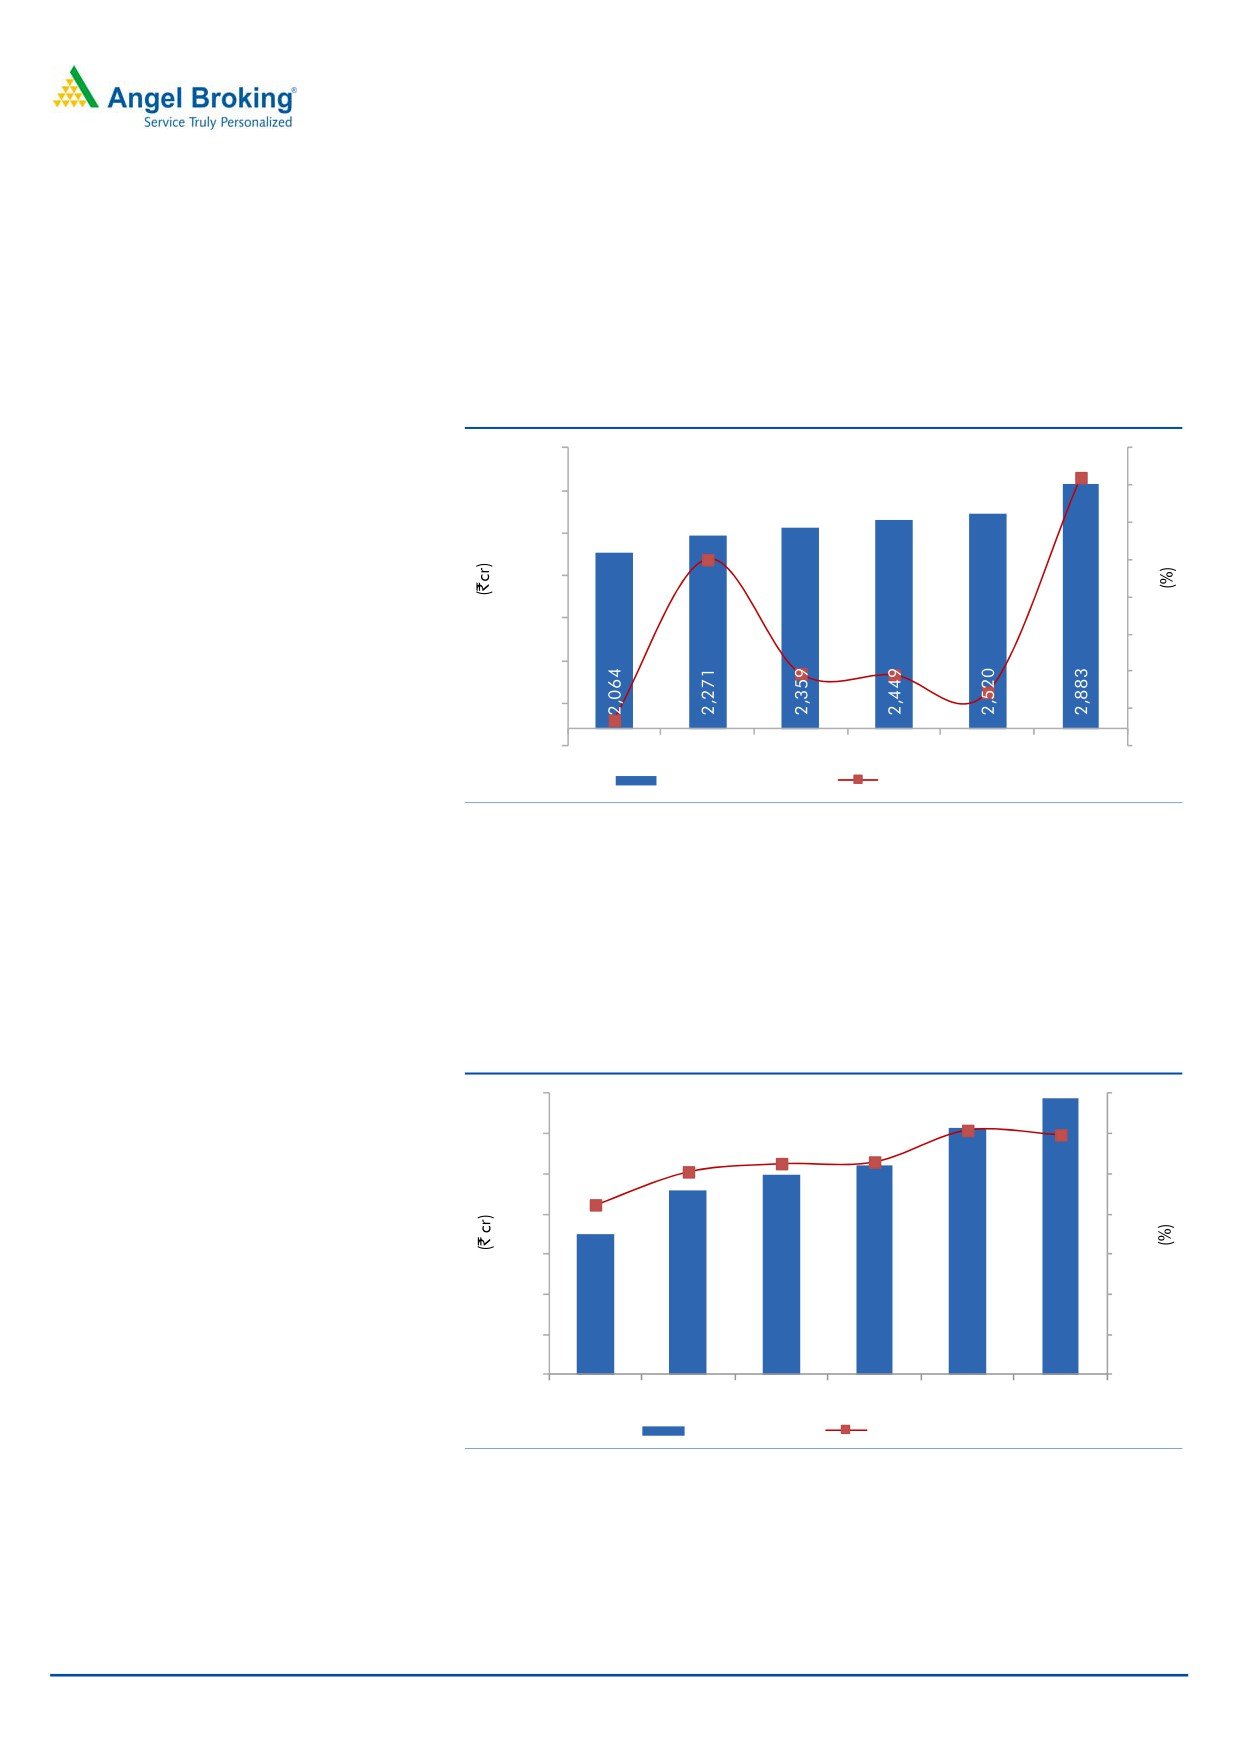
Net sales to grow at CAGR of 8.5% over FY2015-17E
The net sales for the company are expected to be driven by high single digit
volume growth. We expect the net sales to grow at a CAGR of 8.5% over FY2015-
FY2017E to `2,883cr.
Exhibit 6: Net Sales growth trend
3,300
16
14.4
14
2,800
12
2,300
10.0
10
1,800
8
1,300
6
800
3.9
3.8
4
2.9
300
2
1.4
(200)
FY2012
FY2013
FY2014
FY2015
FY2016E FY2017E
0
Net sales (LHS)
Net sales growth (RHS)
Source: Company, Angel Research
EBITDA to post CAGR of 15.2% over FY2015-17E
FCL’s EBITDA, on back of decent top-line growth and improved operational
efficiency, is expected to grow at a CAGR of 15.2% over FY2015-17E. The EBITDA
is expected to rise from `260cr in FY2015 to `345cr in FY2017E and EBITDA
margins are expected to be at 12.0% in FY2017E.
Exhibit 7: EBIDTA and EBIDTA margin trend
350
12.0
14
12.2
300
12
10.5
10.6
10.1
8.5
250
10
200
8
150
6
100
4
50
2
175
230
248
260
307
345
-
0
FY2012
FY2013
FY2014
FY2015
FY2016E FY2017E
EBITDA (LHS)
EBITDA margin (RHS)
Source: Company, Angel Research
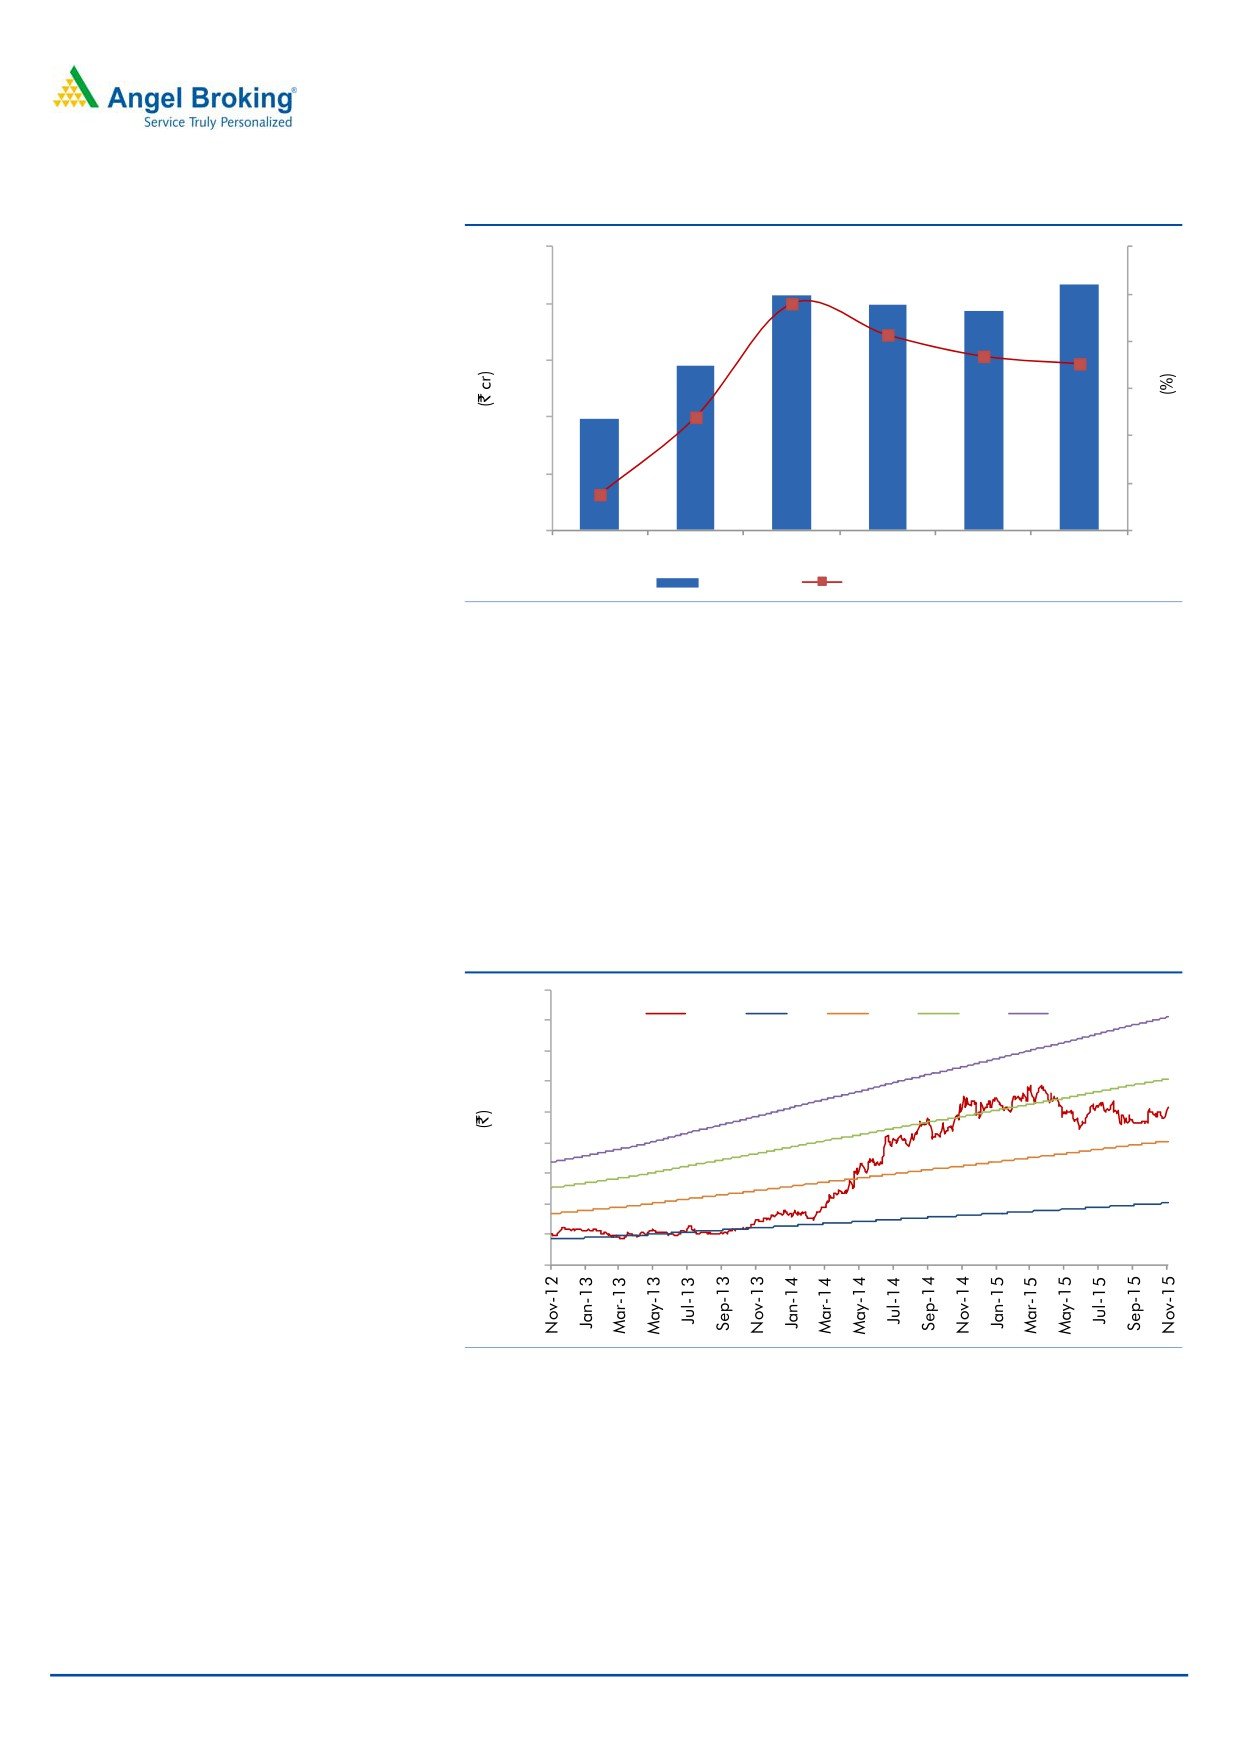
PAT to register modest CAGR of 4.3%
Despite decent top-line growth coupled with better operating performance the net
profit growth is expected to grow at a modest CAGR of 4.3%, largely owing to
higher tax rate.
November 17, 2015
6
Finolex Cables | 2QFY2016 Result update
Exhibit 8: PAT and PAT margin trend
250
10
9
8.8
200
8.1
8
150
7.7
7.5
7
100
6.4
6
50
5
4.8
98
145
208
199
194
217
-
4
FY2012
FY2013
FY2014
FY2015
FY2016E FY2017E
PAT (LHS)
PAT margin (RHS)
Source: Company, Angel Research
Outlook and Valuation
We expect the company’s top-line and EBITDA to post an 8.5% and 15.2% CAGR
over FY2015-17E to `2,883cr and `345cr respectively with EBITDA margin at
12.0% in FY2017E. However, benefit of low material cost and interest outgo is
expected to be offset by higher tax rate which will dent profitability. As a result, the
bottom-line is expected to post a modest CAGR of 4.3% for the same period to
`217cr. We recommend a Neutral rating on the stock as it trades at fair valuations
of 18.2x PE on FY2017E.
Exhibit 9: One-year forward PE
450
Price
5x
10x
15x
20x
400
350
300
250
200
150
100
50
-
Source: Company, Angel Research
November 17, 2015
7
Finolex Cables | 2QFY2016 Result update
Concerns
Competition from the unorganized sector is a concern since the products
available from them are relatively cheaper and they thus cannibalize into
market volumes.
Fluctuation in the price of copper, which is an essential raw material (~80% of
total raw material), is a key concern as it would directly impact operational
efficiency. Although prices have fallen recently, volatility in commodity markets
persists.
Slowdown in the user industry could hurt the company’s volumes.
Company background
FCL is India’s largest and leading manufacturer of electrical and communication
cables. Its wire and cable products are used in applications such as automobile,
lightning, cable TV, telephone and computers to industrial applications. The
company mainly operates through
4 divisions;
1) Electrical cables,
2) Communication cables, 3) Continuous Cast Copper rods and 4) Others-
comprising switches, compact fluorescent lamps manufactured and LED based
lamps through its facilities set up at Roorkee, Goa, and Pune (at Pimpri, Urse).
November 17, 2015
8
Finolex Cables | 2QFY2016 Result update
Profit and Loss statement
Y/E March (` cr)
FY2013
FY2014
FY2015
FY2016E
FY2017E
Gross sales
2,424
2,510
2,575
2,669
3,057
Less: Excise duty
153
151
126
149
174
Net Sales
2,271
2,359
2,449
2,520
2,883
% chg
10.0
3.9
3.8
2.9
14.4
Net Raw Materials
1,689
1,766
1,824
1,822
2,097
% chg
7.7
4.5
3.3
(0.1)
15.1
Personnel
85
85
94
103
121
% chg
21.7
0.3
10.8
9.9
17.2
Other Mfg costs
112
116
101
115
123
% chg
-
(4.0)
12.7
(13.3)
(6.8)
Other
156
144
170
173
198
% chg
-
7.2
(18.0)
(1.5)
(14.4)
Total Expenditure
2,041
2,111
2,189
2,213
2,538
EBITDA
230
248
260
307
345
% chg
31.4
8.1
4.7
18.2
12.3
EBITDA Margin
10.1
10.5
10.6
12.2
12.0
Depreciation& Amort.
47
48
64
55
63
EBIT
183
200
196
252
282
% chg
35.3
9.1
(2.0)
28.5
11.9
(% of Net Sales)
8.1
8.5
8.0
10.0
9.8
Interest & other Charges
13
14
13
9
7
Other Income
24
48
58
47
49
(% of Net Sales)
1.1
2.0
2.4
1.9
1.7
Recurring PBT
170
185
183
243
275
% chg
55.3
9.2
(1.3)
32.6
13.4
Exceptional Expense/(Inc.)
23
(10)
(23)
-
-
PBT (reported)
171
244
264
289
324
Tax
26
36
64
95
107
(% of PBT)
15.0
14.9
24.4
33.0
33.0
PAT (reported)
145
208
199
194
217
ADJ. PAT
145
208
199
194
217
% chg
47.9
43.0
(4.0)
(2.8)
12.1
(% of Net Sales)
6.4
8.8
8.1
7.7
7.5
Basic EPS (`)
9.5
13.6
13.0
12.7
14.2
Fully Diluted EPS (`)
9.5
13.6
13.0
12.7
14.2
% chg
48.0
43.0
(4.0)
(2.8)
12.1
November 17, 2015
9
Finolex Cables | 2QFY2016 Result update
Balance sheet
Y/E March (` cr)
FY2013
FY2014
FY2015
FY2016E
FY2017E
SOURCES OF FUNDS
Equity Share Capital
31
31
31
31
31
Preference Capital
-
-
-
-
-
Reserves& Surplus
894
1,073
1,234
1,392
1,574
Shareholders’ Funds
924
1,103
1,265
1,423
1,604
Total Loans
162
127
51
46
28
Other Long term liability
58
5
5
5
5
Net Deferred tax liability
34
30
30
30
30
Total Liabilities
1,179
1,265
1,351
1,504
1,667
APPLICATION OF FUNDS
Gross Block
929
1,031
1,059
1,112
1,223
Less: Acc. Depreciation
487
535
599
654
717
Net Block
412
496
460
457
505
Capital Work-in-Progress
36
11
11
60
45
Goodwill
-
-
-
-
-
Long term Loans & Adv.
17
5
4
4
4
Investments
324
403
494
544
625
Other non-current assets
19
26
19
19
19
Current Assets
596
623
646
714
805
Cash
40
65
138
155
169
Loans & Advances
77
61
70
72
82
Inventory
330
352
319
351
398
Debtors
150
145
119
136
155
Other current assets
0
0
-
-
-
Current liabilities
225
299
282
294
337
Net Current Assets
372
324
363
420
468
Mis. Exp. not written off
-
-
-
-
-
Total Assets
1,179
1,265
1,351
1,504
1,667
November 17, 2015
10
Finolex Cables | 2QFY2016 Result update
Cash flow statement
Y/E March (` cr)
FY2013
FY2014 FY2015 FY2016E FY2017E
Profit before tax
171
244
264
289
324
Depreciation
47
48
64
55
63
(Inc.)/ Dec. in Working Capital
(53)
73
34
(40)
(34)
Less: Other income
(24)
(48)
(58)
(47)
(49)
Direct taxes paid
(26)
(36)
(64)
(95)
(107)
Cash Flow from Operations
114
280
239
163
197
(Inc.)/ Dec. in Fixed Assets
(88)
(77)
(28)
(102)
(96)
(Inc.)/ Dec. in Investments
(100)
(67)
(91)
(49)
(82)
Other income
24
48
58
47
49
Cash Flow from Investing
(164)
(96)
(60)
(105)
(129)
Issue of Equity
-
-
-
-
-
Inc./(Dec.) in loans
33
(93)
(75)
(5)
(18)
Dividend Paid (Incl. Tax)
(21)
(29)
(32)
(36)
(36)
Others
28
(38)
1
-
-
Cash Flow from Financing
40
(160)
(106)
(41)
(54)
Inc./(Dec.) in Cash
(9)
25
74
17
14
Opening Cash balances
49
40
65
138
155
Closing Cash balances
40
65
138
155
169
November 17, 2015
11
Finolex Cables | 2QFY2016 Result update
Key ratios
Y/E March
FY2013
FY2014
FY2015E
FY2016E
FY2017E
Valuation Ratio (x)
P/E (on FDEPS)
27.2
19.0
19.8
20.4
18.2
P/CEPS
20.6
15.4
15.0
15.9
14.1
P/BV
4.3
3.6
3.1
2.8
2.5
Dividend yield (%)
0.5
0.6
0.7
0.8
0.8
EV/Sales
1.7
1.5
1.4
1.3
1.1
EV/EBITDA
16.3
14.6
13.0
10.8
9.2
EV / Total Assets
3.2
2.9
2.5
2.2
1.9
Per Share Data (`)
EPS (Basic)
9.5
13.6
13.0
12.7
14.2
EPS (fully diluted)
9.5
13.6
13.0
12.7
14.2
Cash EPS
12.6
16.8
17.2
16.3
18.3
DPS
1.2
1.6
1.8
2.0
2.0
Book Value
60.5
72.2
82.7
93.1
104.9
Dupont Analysis
EBIT margin
8.1
8.5
8.0
10.0
9.8
Tax retention ratio
0.9
0.9
0.8
0.7
0.7
Asset turnover (x)
2.9
3.0
3.5
3.4
3.5
ROIC (Post-tax)
20.0
21.6
20.9
22.6
22.8
Cost of Debt (Post Tax)
7.0
9.7
19.1
13.1
15.9
Leverage (x)
(0.2)
(0.3)
(0.5)
(0.5)
(0.5)
Operating ROE
17.1
17.9
20.0
18.2
19.5
Returns (%)
ROCE (Pre-tax)
15.5
15.8
14.5
16.7
16.9
Angel ROIC (Pre-tax)
23.5
25.4
27.6
33.7
34.0
ROE
15.7
18.8
15.8
13.6
13.5
Turnover ratios (x)
Asset Turnover (Gross Block)
2.4
2.3
2.3
2.3
2.4
Inventory / Sales (days)
49
53
50
48
47
Receivables (days)
21
23
20
20
20
Payables (days)
37
45
48
48
48
WC cycle (ex-cash) (days)
53
40
34
38
38
Solvency ratios (x)
Net debt to equity
(0.2)
(0.3)
(0.5)
(0.5)
(0.5)
Net debt to EBITDA
(0.9)
(1.4)
(2.2)
(2.1)
(2.2)
Interest Coverage (EBIT/Int.)
13.7
13.8
15.2
27.9
43.0
November 17, 2015
12
Finolex Cables | 2QFY2016 Result update
Research Team Tel: 022 - 39357800
DISCLAIMER
Angel Broking Private Limited (hereinafter referred to as “Angel”) is a registered Member of National Stock Exchange of India Limited,
Bombay Stock Exchange Limited and Metropolitan Stock Exchange of India Limited. It is also registered as a Depository Participant with
CDSL and Portfolio Manager with SEBI. It also has registration with AMFI as a Mutual Fund Distributor. Angel Broking Private Limited is
a registered entity with SEBI for Research Analyst in terms of SEBI (Research Analyst) Regulations, 2014 vide registration number
INH000000164. Angel or its associates has not been debarred/ suspended by SEBI or any other regulatory authority for accessing
/dealing in securities Market. Angel or its associates including its relatives/analyst do not hold any financial interest/beneficial
ownership of more than 1% in the company covered by Analyst. Angel or its associates/analyst has not received any compensation /
managed or co-managed public offering of securities of the company covered by Analyst during the past twelve months. Angel/analyst
has not served as an officer, director or employee of company covered by Analyst and has not been engaged in market making activity
of the company covered by Analyst.
This document is solely for the personal information of the recipient, and must not be singularly used as the basis of any investment
decision. Nothing in this document should be construed as investment or financial advice. Each recipient of this document should
make such investigations as they deem necessary to arrive at an independent evaluation of an investment in the securities of the
companies referred to in this document (including the merits and risks involved), and should consult their own advisors to determine
the merits and risks of such an investment.
Reports based on technical and derivative analysis center on studying charts of a stock's price movement, outstanding positions and
trading volume, as opposed to focusing on a company's fundamentals and, as such, may not match with a report on a company's
fundamentals.
The information in this document has been printed on the basis of publicly available information, internal data and other reliable
sources believed to be true, but we do not represent that it is accurate or complete and it should not be relied on as such, as this
document is for general guidance only. Angel Broking Pvt. Limited or any of its affiliates/ group companies shall not be in any way
responsible for any loss or damage that may arise to any person from any inadvertent error in the information contained in this report.
Angel Broking Pvt. Limited has not independently verified all the information contained within this document. Accordingly, we cannot
testify, nor make any representation or warranty, express or implied, to the accuracy, contents or data contained within this document.
While Angel Broking Pvt. Limited endeavors to update on a reasonable basis the information discussed in this material, there may be
regulatory, compliance, or other reasons that prevent us from doing so.
This document is being supplied to you solely for your information, and its contents, information or data may not be reproduced,
redistributed or passed on, directly or indirectly.
Neither Angel Broking Pvt. Limited, nor its directors, employees or affiliates shall be liable for any loss or damage that may arise from
or in connection with the use of this information.
Note: Please refer to the important ‘Stock Holding Disclosure' report on the Angel website (Research Section). Also, please refer to the
latest update on respective stocks for the disclosure status in respect of those stocks. Angel Broking Pvt. Limited and its affiliates may
have investment positions in the stocks recommended in this report.
Disclosure of Interest Statement
Finolex Cables
1. Analyst ownership of the stock
No
2. Angel and its Group companies ownership of the stock
No
3. Angel and its Group companies' Directors ownership of the stock
No
4. Broking relationship with company covered
No
Note: We have not considered any Exposure below ` 1 lakh for Angel, its Group companies and Directors
Ratings (Based on expected returns
Buy (> 15%)
Accumulate (5% to 15%)
Neutral (-5 to 5%)
over 12 months investment period):
Reduce (-5% to -15%)
Sell (< -15)
November 17, 2015
13