IPO Note | Financial Services
April 4, 2016
Equitas Holdings Limited
SUBSCRIBE
Issue Open: April 5, 2016
IPO Note
Issue Close: April 7, 2016
Equitas Holdings (Equitas) is a diversified financial services player with presence
across microfinance, vehicle & MSE finance and housing finance. With a humble
Issue Details
start in 2007, it has emerged as the fifth largest micro finance player in a short
Face Value: `10
period of time. Equitas is amongst the ten players to have received a small
Present Eq. Paid up Capital: `269.9cr
finance bank license from the Reserve Bank of India (RBI). The company has a
presence in 11 states through 539 branches, is backed by a strong Management
Fresh Issue**: 6.55cr Shares amounting to `720crs
team and with it being the second IPO in the micro finance segment, we expect
Offer for sale: 13.2cr Shares amounting to `1,456.7crs
strong subscription responses to the issue.
Post Eq. Paid up Capital: `335.4crs
Expect a smooth transition towards being a Small Finance bank: The proposed
small finance bank (SFB) will have access to low cost funds, ie below the current
Market Lot: 135 Shares
~12% rate via deposits. However, there will be initial expenses to be incurred
Fresh Issue (amount): `720cr
while transitioning to be a SFB as new processes will have to be implemented
along with maintenance of CRR and SLR. Meeting 75% Priority Sector Lending
Price Band: `109-110
(PSL) target will not be a challenge for Equitas as its entire portfolio qualifies for
Post-issue implied mkt. cap `3,662*- 3,689cr**
PSL and hence the migration from NBFC to SFB should be smooth. With leverage
of only 4x, we believe there would be enough scalability without further dilutions.
Note:*at Lower price band and **Upper price band
Scalable business model with presence across growing verticals: Equitas’
microfinance business has grown at a CAGR of 45% over FY2012-9MFY2016 to
Book Building
`2,935cr. There is a huge untapped opportunity in this segment as microfinance
is targeted to the lower income segment which often lacks access to formal
QIBs
50%
financing sources. With a loan portfolio of only ~`43,300cr for the industry and
Non-Institutional
15%
given the government’s focus on financial inclusion together with better clarity on
Retail
35%
regulatory aspects, the microfinance industry is positioned for healthy growth going
ahead. Within five years of operations Equitas’ used vehicle & MSE financing business
has scaled up to an AUM to `2,341cr, growing at a CAGR of 125% over FY12-15.
Pre Issue Shareholding Pattern(%)
Reducing dependence on microfinance: Equitas has successfully diversified its
Foreign Residents
92.6
business; the share of microfinance in terms of its total AUM has declined to 53%
in 9MFY2016 from 100% in FY2011, while that of vehicle finance and MSE has
Others
7.4
risen to 42.5% from nil over the same period. Despite aggressive growth, it has
been able to maintain strong asset quality with the GNPA at
0.2% for
Microfinance and 2.6% for vehicle & MSE finance as of Dec-15. Its NIM of 11.1%
and 12.5% respectively for the two aforementioned segments should help mitigate
against any serious deterioration in asset quality, going forward.
Outlook Valuation: At the upper band of the offer price `110 the issue is priced at
1.8x its diluted BV of `60 (pre-dilution 2.3x). The company has decent ROE and
ROA of 13% and 3.1%. Though post conversion to a SFB the return ratios might
be compressed, while we expect the same to scale up subsequently. We believe
the issue is attractively priced looking at the growth options the company offers in
the long run. We recommend SUBSCRIBE to the issue.
Key Financials
Y/E March (`cr)
FY2012
FY2013
FY2014
FY2015
9MFY2016
NII
125.3
155.3
259.6
401.3
423.3
% chg
-
23.9
67.2
54.6
-
Siddharth Purohit
Net profit
(2.7)
31.9
74.3
107.0
120.4
+91 22 39357800 Ext: 6872
% chg
-
-
133.0
43.9
-
NIM (%)
14.5
12.7
12.4
12.1
11.6
Book Value (`)
68.0
81.7
102.1
43.5
48.0
P/ABV (x)
1.6
1.3
1.1
2.5
1.8
Chintan Shah
RoA (%)
(0.7)
2.3
3.2
3.0
3.0
+91 22 4000 3600 Ext: 6828
RoE (%)
(2.4)
8.5
12.2
11.2
13.1
Source: Company, Angel Research; Note: Valuation ratios based on pre-issue outstanding shares and at upper end of the price band
Please refer to important disclosures at the end of this report
1
Equitas Holdings | IPO Note
Company background
Equitas is a diversified financial services player with strong presence across
microfinance, vehicle finance, MSE finance, and housing finance segments.
Incorporated in 2007 and headquartered in Chennai, Equitas operates across 11
states through 539 branches. Equitas, through its subsidiary Equitas Micro Finance
Ltd (EMFL) is the fifth largest microfinance company in India (on gross loan
portfolio basis). Equitas has also received in-principle approval from the RBI to set
up a SFB in October 2015.
Exhibit 1: Key Businesses - Segment-wise data (As on 31Dec 2015)
Micro
Vehicle
MSE
Affordable
Particulars
Finance
Finance
Finance
Housing
AUM `Cr
2,935
1,406
934
229
% of Total AUM
53.3%
25.5%
17.0%
4.2%
Micro Housing-
`2.4 Lakhs
` 2,000-
Ticket Size
`3.8 Lakhs
` 2.1 Lakhs
`35,000
Affordable
Housing `10.6
Lakhs
No of Loan Accounts
2.78 mn
52,274
45,992
4,022
CAR %
21.02%
31.45%
NA
32.11%
Source: Company, Angel Research
Regulatory aspect of Small Finance Bank:
Exhibit 2: Regulatory aspect of Small Finance Bank (SFB)
Key Regulations
Company’s Plan of Action
With MFI’s average ticket size of `9,364 and that of vehicle finance and
50% of a SFB’s loan portfolio should constitute of loans not
MSE at `3.8lakhs and `2.1 lakhs respectively, the proposed SFB will be
exceeding `25 lakhs.
meet the guidelines.
As per FDI rule SFB can have maximum 49% share holding by
The proposed IPO will reduce the foreign investors holding from 93% to
foreign stake holders.
35%.
SFBs need to operate 25% of their branches in unbanked rural
Existing branches of the company can be converted as SFB branches.
areas.
CRR & SLR to be maintained as per RBI norms.
SFB needs to have 75% of its loans under the priority sector.
Maximum exposure to single entity and group to be capped at 10%
Will be complied as per the guidelines by the RBI.
& 15% of net worth respectively.
SFBs are not permitted to set up any subsidiary.
Minimum CAR of 15% of its RWA, with Tier of 7.5%.
With the proposed IPO, capital not to be a concern.
Source: Company, Angel Research
Key Management Personnel:
P. N. Vasudevan, Managing Director. (worked with Cholamandalam Investment
and Finance Company Limited for about two decades)
S. Bhaskar, CFO, joined the Equitas Group in
2007. (worked with
Cholamandalam Investment and Finance Company Limited for about two
decades)
H.K.N. Raghavan, CEO of EMFL, joined the Equitas Group in 2008.
V. S. Murthy, CEO of Equitas Finance Ltd (EFL), joined the Equitas Group in 2010.
April 4, 2016
2
Equitas Holdings | IPO Note
Issue details
The company is raising `720cr through fresh issue of equity shares in the price
band of `109-110. The fresh issue will constitute 19.5% of the post-issue paid-up
equity share capital of the company assuming the issue is subscribed at the upper
end of the price band. Along with the fresh issue of equity shares, there is also an
Offer for Sale (OFS) of 13.2cr equity shares from the existing shareholders.
Exhibit 3: Offer Details
Amount (in crs.)
Offer Details
No. of equity shares
(at the upper price band)
Fresh Issue
6.5
720
Offer for Sale
13.2
1,457
Total Offering
19.8
2,177
Source: Company, Angel Research
The top 10 shareholders of the company are as follows:
Exhibit 4: Top10 Shareholders
No. of Equity Shares
Name of the Shareholder
Shareholding %
(in crs)
International Finance Corporation
3.9
14.3
CDC Group plc
2.7
9.9
India Financial Inclusion Fund
2.6
9.7
Lumen Investments Holdings Limited
2.3
8.4
Creation Investments Equitas Holdings, LLC
1.8
6.7
Credit Access Asia N.V
1.8
6.5
MVH S.p.A.
1.7
6.3
Nederlandse Financierings - Maatschappij
1.5
5.5
voor Ontwikkelingslanden N. V. (FMO)
DEG - Deutsche Investitions-
1.5
5.4
Entwicklungsgesellschaft mbH
Sequoia Capital India Investments III
1.3
4.8
Total
20.9
77.5
Source: Company, Angel Research
Objects of the offer
Investment in certain subsidiaries of the company, namely, EFL, EMFL and
Equitas Housing Finance Ltd (EHFL), to augment their capital base to meet
their future capital requirements arising out of growth in business. The amount
to be invested in these subsidiaries is `616cr.
The balance will be used for general corporate purposes.
In addition, the proceeds from the Offer for Sale portion of the total issue
proceeds, which may be a major portion of the total issue proceeds, would
accrue to the selling shareholders and will not be available for utilization by
the company for its requirements.
April 4, 2016
3
Equitas Holdings | IPO Note
Investment rationale
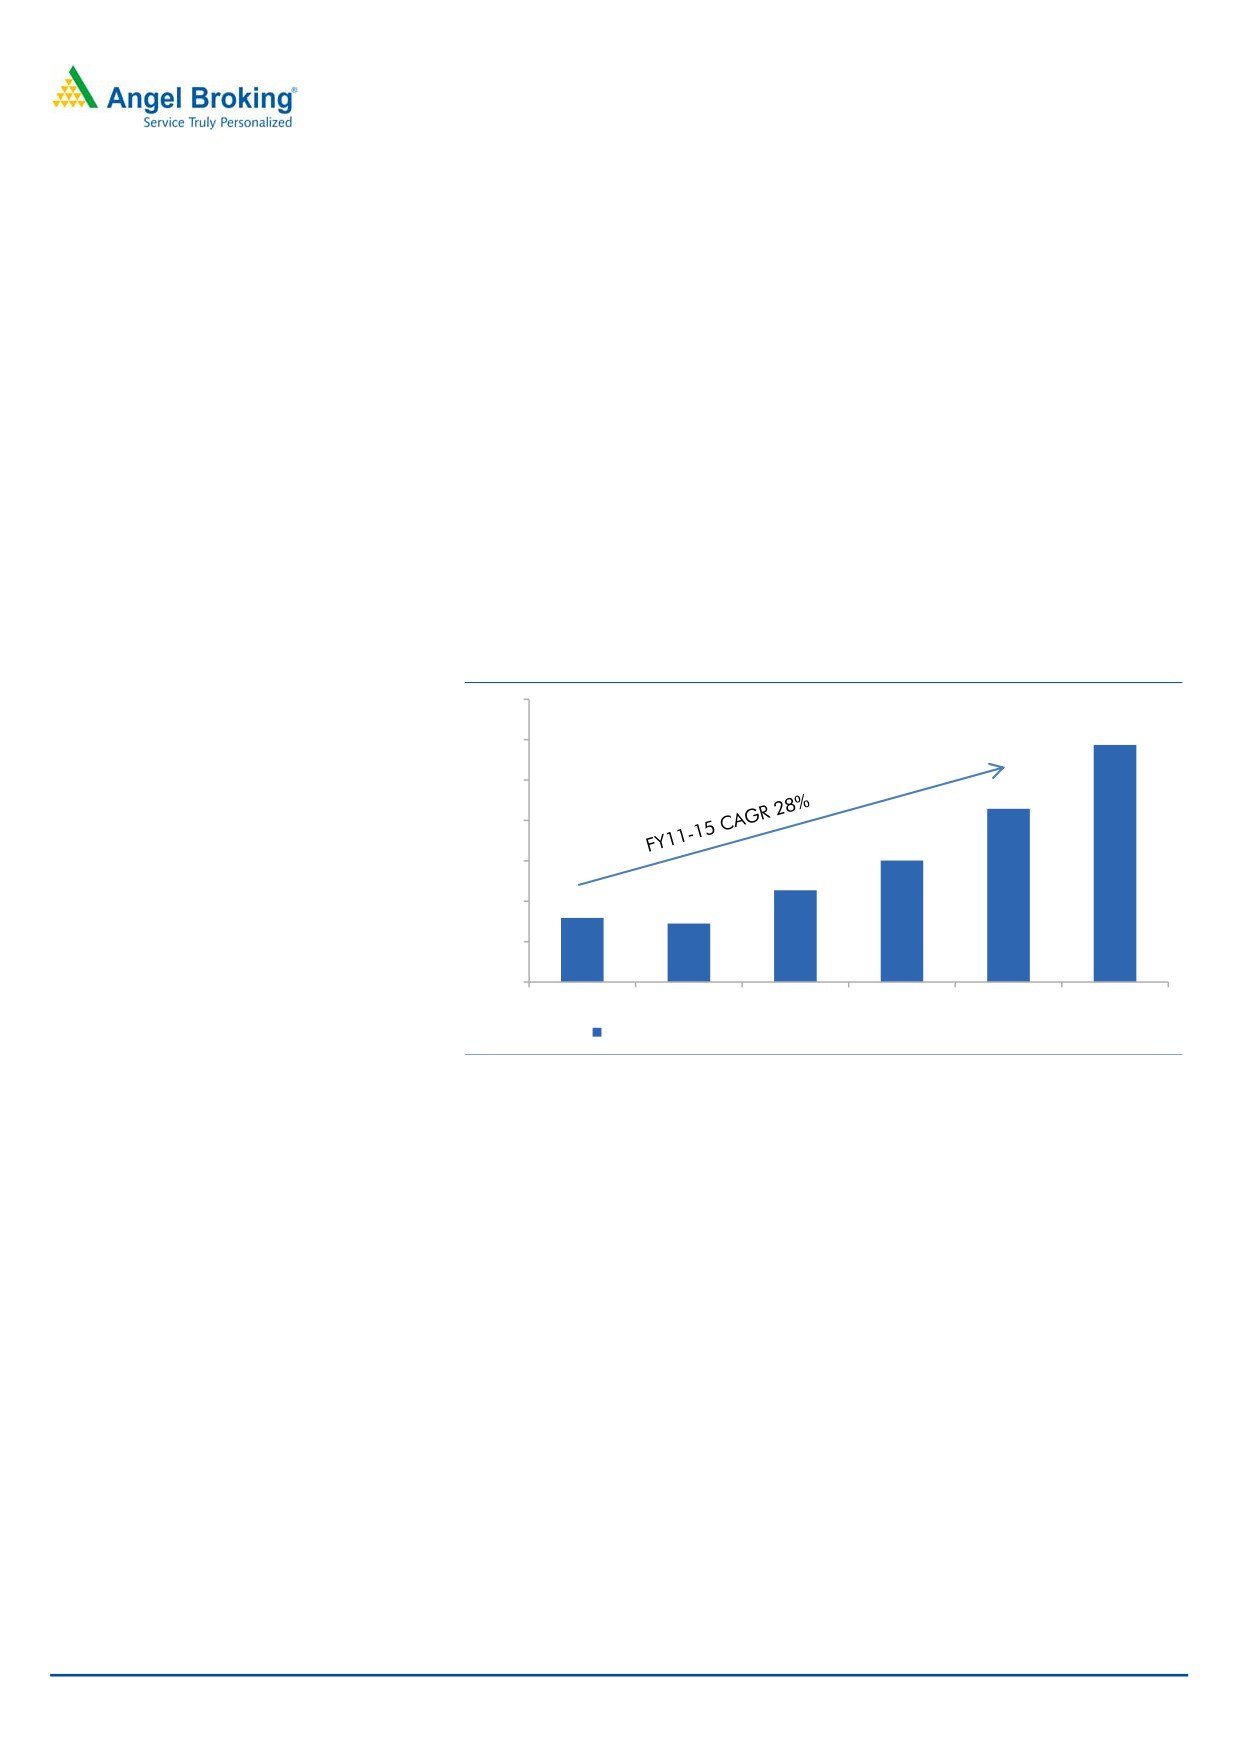
Micro finance business has huge scalability: Equitas’ microfinance business has
grown at a CAGR of 42% over FY2012-9MFY2016 to `2,935cr. There is a huge
untapped opportunity in this segment as microfinance is targeted to the lower
income segment which often lacks access to formal financing sources. Ideally the
ticket size of the loans range from `2,000-`35,000 (average ticket size of `9,634)
and more than 90% of the borrowers are female, who access loans via group
borrowings (Self Help Group) for very small businesses. Sharing the group liability
has resulted in maintaining credit discipline and hence the delinquency in this type
of business has been very low despite it being an unsecured form of loan. EMIs are
collected on 14 days or 28 days basis, which reduces the risk of any bad loans.
With a loan portfolio of only ~`43,300cr for the industry and the government’s
focus on financial inclusion together with better clarity on regulatory aspects, the
microfinance industry can look forward for healthy growth ahead.
Exhibit 5: Micro Finance AUM CAGR%
3,500
2,935
3,000
2,500
2,144
2,000
1,503
1,500
1,135
1,000
794
724
500
0
FY11
FY12
FY13
FY14
FY15
9MFY16
Assets Under Management (AUM) (`crs) - Micro Finance
Source: Company, Angel Research
Despite being a late entrant, Equitas has been able to scale up its operations very
fast and now ranks fifth in terms of gross loan portfolio within the microfinance
industry. Despite being perceived to be a risky segment, the company has
managed its loan portfolio quite strong with Gross NPAs of 0.17% and Net NPAs
at 0.10% at the end of 9MFY2016. Based on its historical trend, we believe the
company has developed robust processes for monitoring and collections and
hence any substantial deterioration in asset quality is unexpected. Backed by scale
of operations it has been able to reduce its operating expenses to 7.6% of sales in
9MFY2016 from 13.7% in FY2012. Though the ROA has come off from its peak of
4.3%, it still continues to be healthy at 2.9%, while ROE and NIM have been steady
at 19.1% and 11.1% respectively.
April 4, 2016
4
Equitas Holdings | IPO Note
Exhibit 6: Microfinance Business - Key Parameters
(` In Cr)
FY12
FY13
FY14
FY15
9MFY16
AUM
724
1,135
1,503
2,144
2,935
% Growth
(8.8)
56.7
32.5
42.6
36.9
NII
113
115
161
215
212
% Growth
(0.3)
0.0
0.4
0.3
(0.0)
NIM %
14.9
12.3
12.2
11.8
11.1
Operating Expenses/ Average AUM
12.5
9.5
7.8
7.6
7.6
ROA %
2.0
2.5
4.3
3.8
2.9
ROE %
7.2
12.0
20.0
19.8
19.1
Gross NPA/ On Book AUM(%)
1.3
0.0
0.1
0.1
0.2
Net NPA/ On Book AUM (%)
0.1
0.0
0.0
0.0
0.1
Source: Company, Angel Research
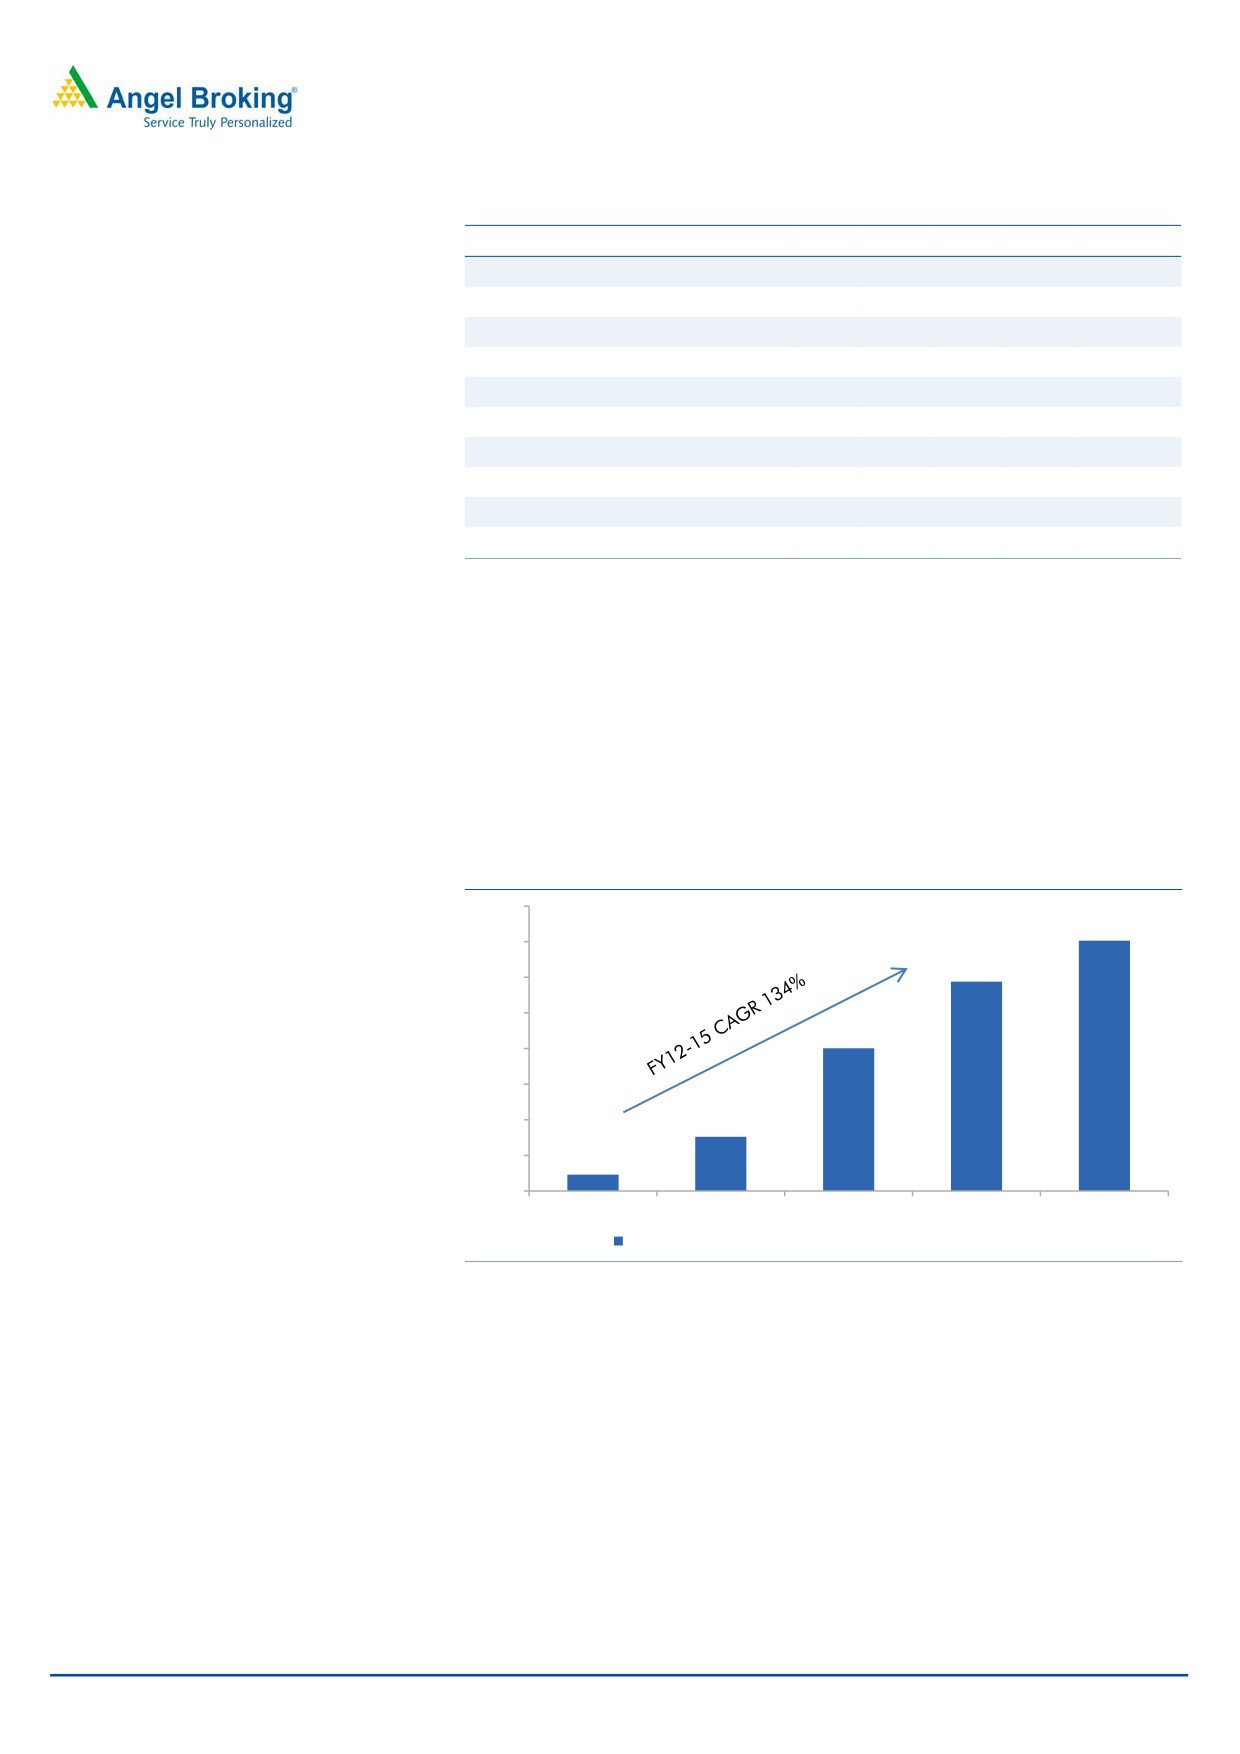
Diversifying into used vehicle finance and MSE financing a positive move: The
company earlier diversified into used vehicle & MSE financing and within 5 years it
has been able to scale up its AUM to `2,341cr, growing at a CAGR of 125% over
FY12-15. The segment now forms 43% of the company’s overall AUM. With
average ticket size of `3.8 lakhs the primary target customers are first time buyers
of used vehicles and the Management believes its experience in handling the
unsecured loan portfolio will help in further scaling up the vehicle & MSE portfolio.
Exhibit 7: Strong AUM growth under Vehicle Finance
1,600
1,406
1,400
1,175
1,200
1,000
801
800
600
400
305
200
92
0
FY12
FY13
FY14
FY15
9MFY16
Assets Under Management (AUM) (`crs) - Vehicle Finance
Source: Company, Angel Research
There are large players in the used vehicle financing business. However, the
company believes it has enough scope to penetrate the hinterland of the country
where a formal system of financing in this segment is still missing and borrowers
have to depend on high cost funds from local players.
April 4, 2016
5
Equitas Holdings | IPO Note
Exhibit 8: Vehicle Finance & MSE Business - Key Parameters
Vehicle Finance & MSE Business (` Cr)
FY12
FY13
FY14
FY15
9MFY16
AUM Combined
92
305
889
1,686
2,341
% Growth
232.1
191.9
89.7
38.8
Vehicle
92
305
801
1,175
1,406
% Growth
232.1
163.2
46.7
19.6
MSE
0
0
87
511
936
% Growth
NA
NA
484.5
83.1
NII
4
28
72
158
189
% Growth
696.3
157.4
119.9
19.3
NIM %
3.8
14.1
12.1
12.3
12.5
Operating Expenses/ Average AUM %
18.2
15.7
8.5
7.7
6.8
ROA %
(22.3)
1.1
2.6
2.7
3.6
ROE %
(46.5)
3.2
7.1
7.5
12.1
Gross NPA/ N Book AUM (%)
0.5
1.0
1.6
2.0
2.6
Net NPA/ On Book AUM (%)
0.4
0.7
1.4
1.5
2.0
Source: Company, Angel Research
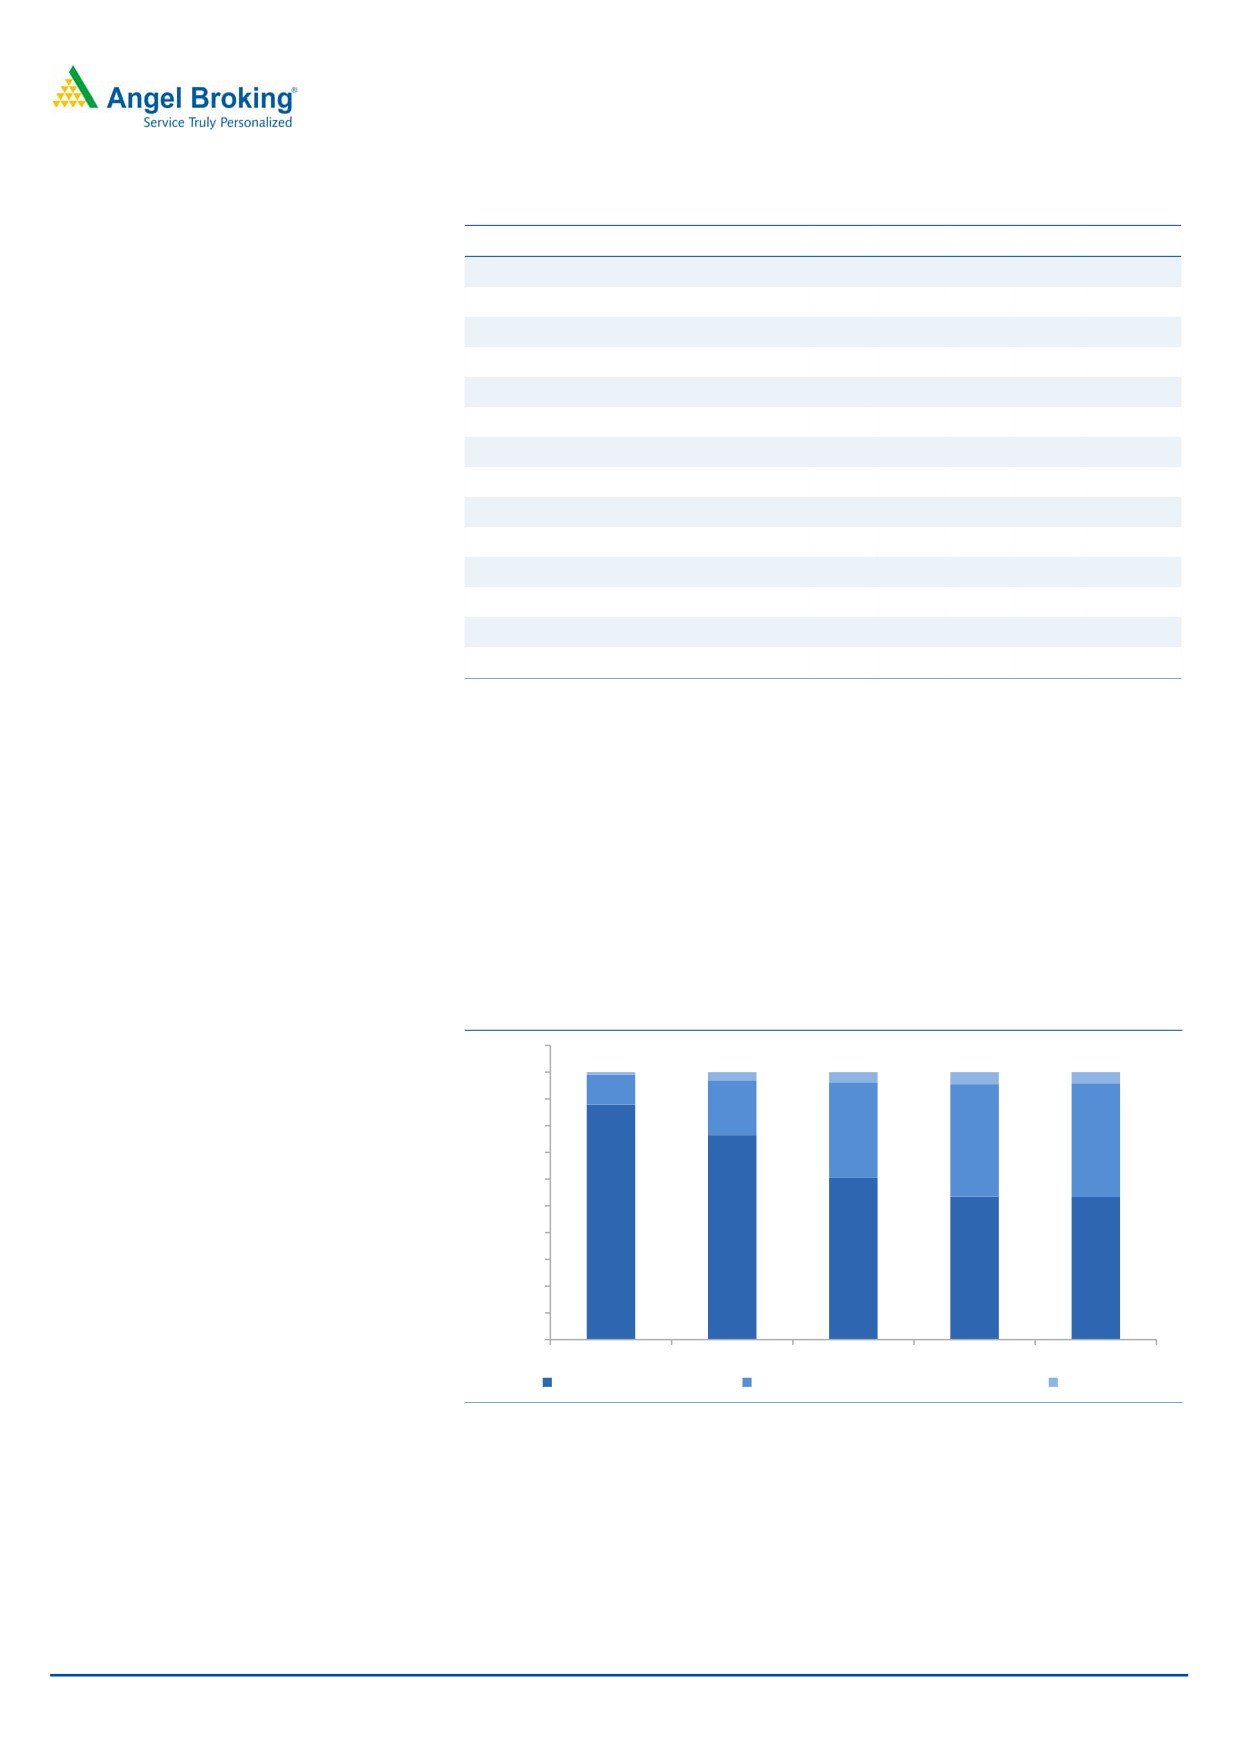
Reducing dependence on microfinance: Equitas has successfully diversified its
business; accordingly the share of microfinance in the total AUM has declined to
53% in 9MFY2016 from 100% in FY2011, while that of vehicle finance and MSE
finance has risen to 42.5% from nil over the same period. The company also
started Home Loans business in 2011, however intends to grow the same slow and
steady as the initial delinquencies in the same has been high. Contribution of
Home Loans continues to be very small at 4% of the AUM, and the management
doesn’t intend to scale it up fast in the near term.
Exhibit 9: Portfolio Distribution
110.0%
100.0%
1.0%
3.0%
3.8%
4.5%
4.2%
11.1%
90.0%
20.5%
80.0%
35.8%
42.1%
42.5%
70.0%
60.0%
50.0%
87.9%
40.0%
76.5%
30.0%
60.5%
53.5%
53.3%
20.0%
10.0%
0.0%
FY12
FY13
FY14
FY15
9MFY16
Micro Finance Business
Vehicle Finance & MSE Business Rs Cr
Home Loans
Source: Company, Angel Research
April 4, 2016
6
Equitas Holdings | IPO Note
Exhibit 10: Latest Portfolio Mix (%)
4.2%
17.0%
53.3%
25.5%
Microfinance
Vehicle Finance
MSE finance
Housing finance
Source: Company, Angel Research
Expect smooth transition to a SFB: Equitas is amongst the ten players to have
received a SFB license from the RBI. Migrating to become an SFB from being a
NBFC has its own pros and cons. On the positive side the proposed SFB will have
access to low cost funds via deposits and even borrowing costs can be reduced
further via NCDs and CP/CDs. It can also start other retail loans at par with other
banks. While on the flip side there will be initial expenses associated with being a
bank as new processes will have to be implemented. Further, the SFB will have to
comply with CRR and SLR requirements. Meeting 75% Priority Sector Lending (PSL)
target will not be a challenge for Equitas as its entire portfolio qualifies for PSL and
hence the migration from NBFC to SFB should be smooth These will impact the
overall NIM and ROA during the initial 2-3 years. Having said that, we believe with
an experienced Management and already diversified loan portfolio, the migration
from NBFC to SFB would be smooth.
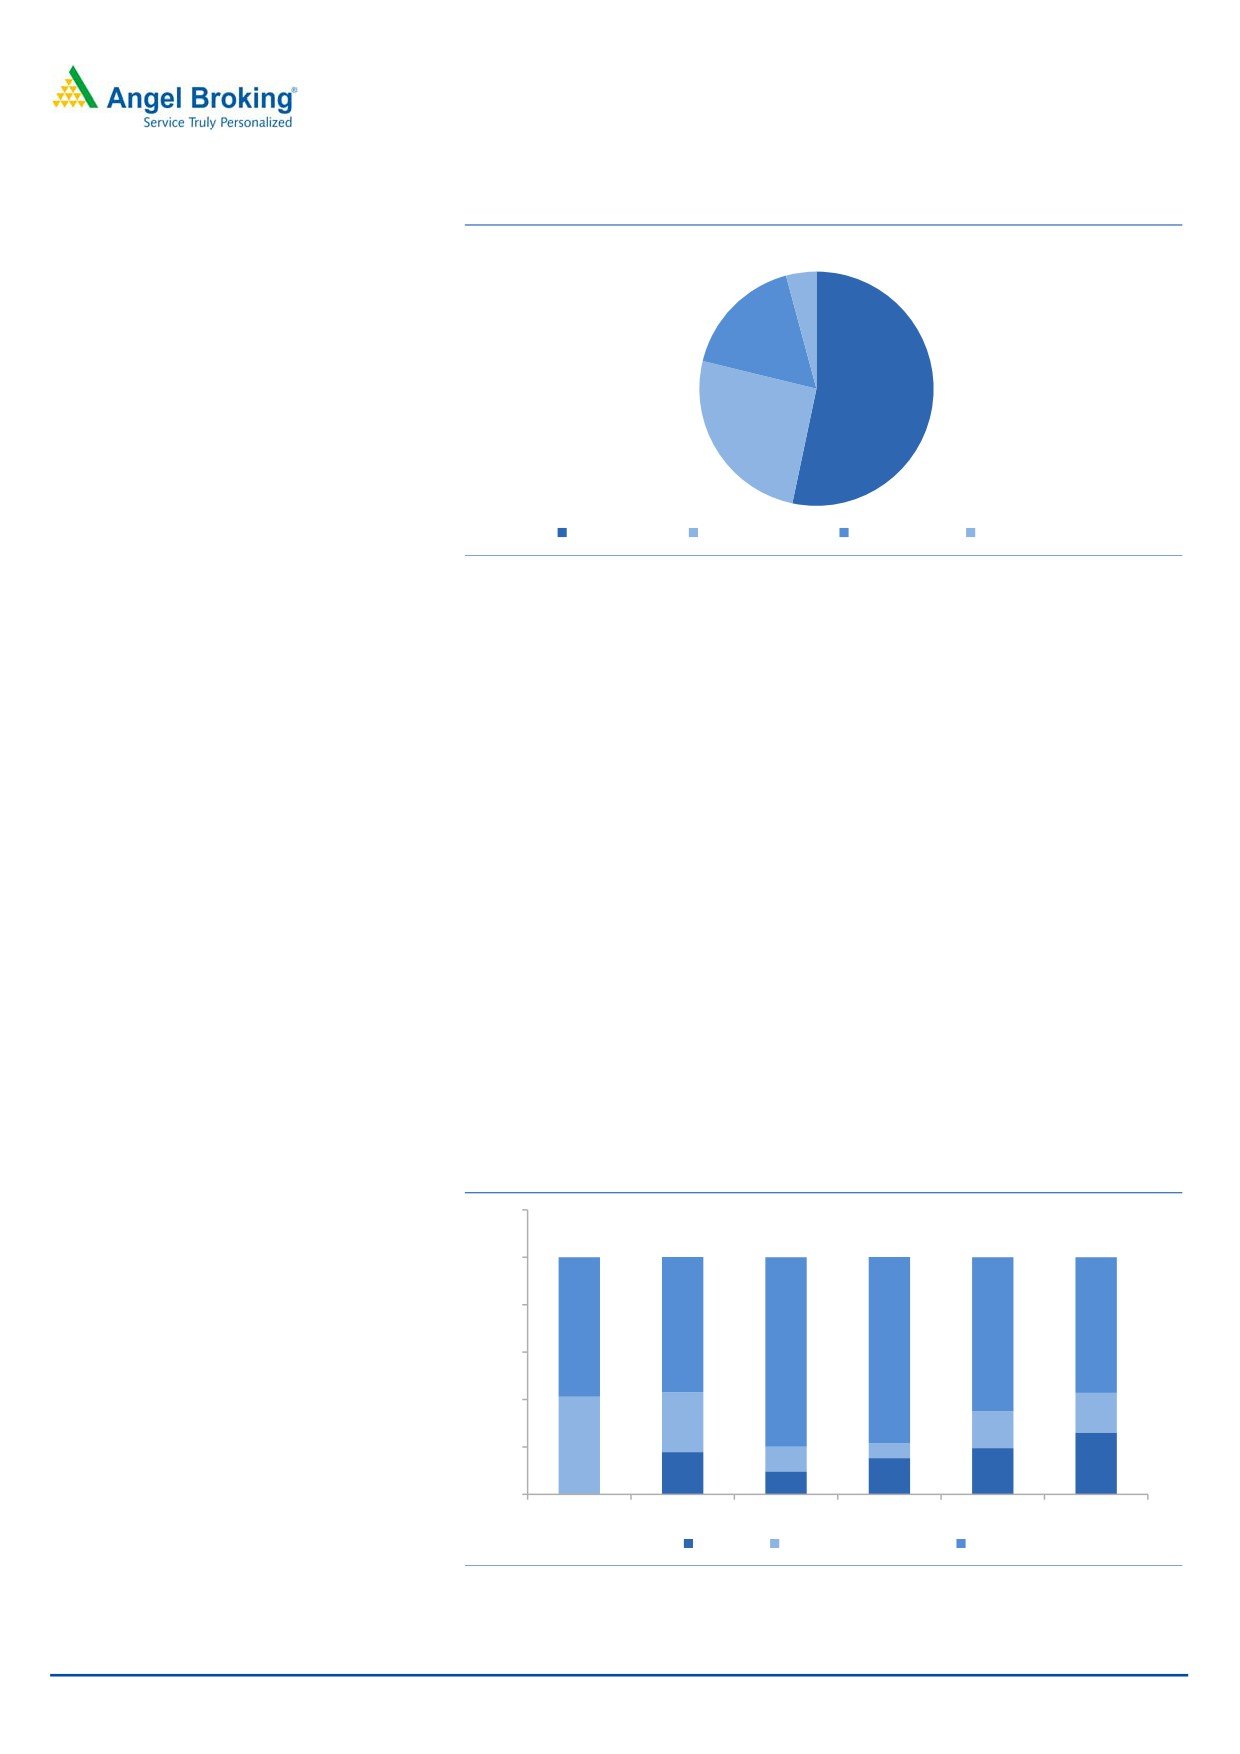
Borrowing Mix:
The Company has over the years tilted its borrowings mix more in favor of lending
from banks and reduced its exposure to Non Convertible Debentures. Upon
conversion of SFB, the bank will have more leeway of low cost funds in the form of
deposits and higher credibility will allow it to price its NCD’s at a competitive rate.
This will overall result in lower cost of funds going ahead.
Exhibit 11: Borrowing Mix
120.0
100.0
80.0
58.8
57.0
57.2
64.9
60.0
79.9
78.5
40.0
16.7
25.3
15.6
20.0
41.2
6.3
10.4
26.1
17.8
15.3
19.5
9.7
0.0
0.0
FY2011
FY2012
FY2013
FY2014
FY2015
9MFY2016
NCD's
Financial Institutions
Banks
Source: Company, Angel Research
April 4, 2016
7
Equitas Holdings | IPO Note
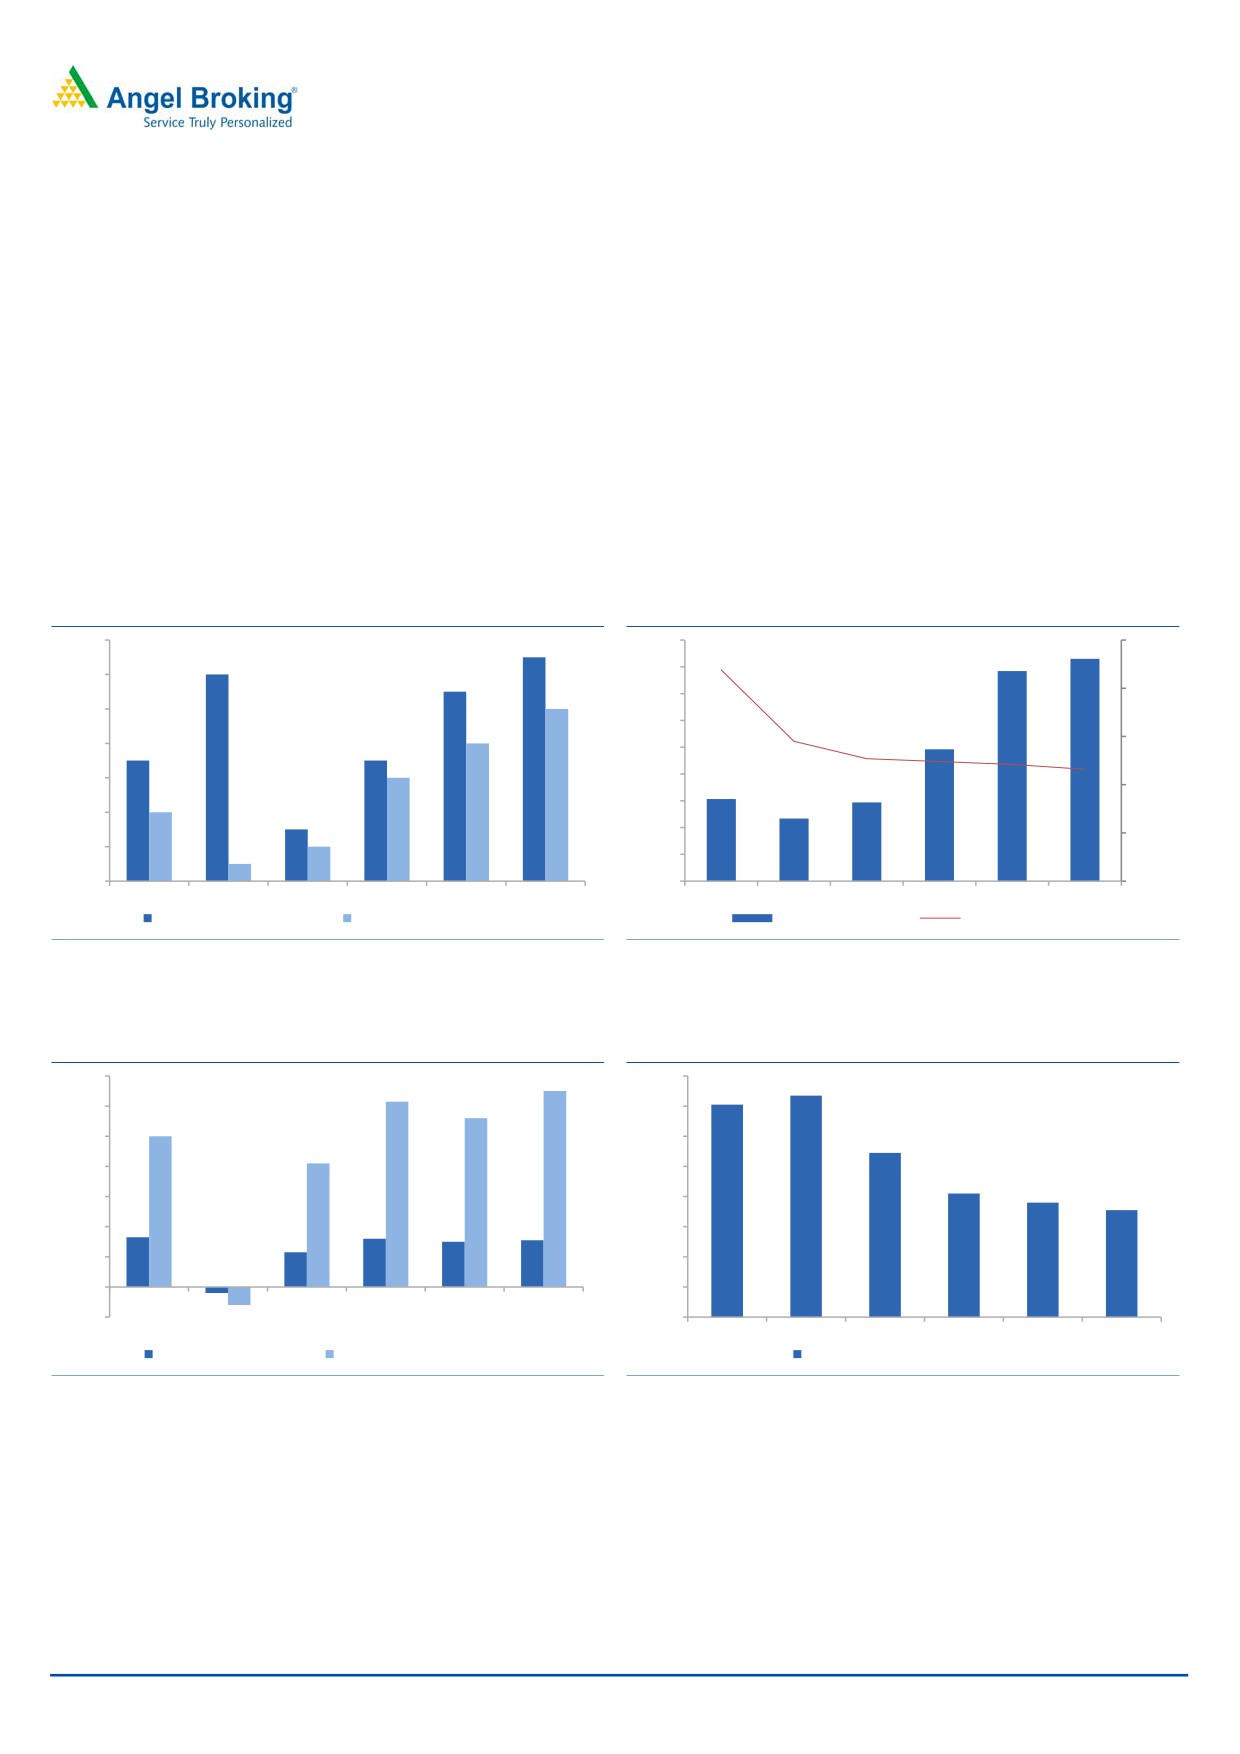
NIM’s and Asset Quality:
The company has managed its NPA level quite strong despite aggressive growth in
the last 4-5 years. Microfinance, though is an unsecured form of loan, the
company has achieved excellent track record of maintaining Gross NPA below
0.2% which is a commendable job.
However, in the vehicle finance business, Gross NPA is 2.6% which can be a cause
of concern if it escalates further. In the home loan business, Gross NPA has gone
upto 3% and hence management intends to go slow on expanding the same.
Net Interest Margins (NIM’s) for the company have been on a declining trend over
the past few years and we expect the same to decline further over the next few
quarters before it stabilises.
Exhibit 12: Gross & Net NPA (%)
Exhibit 13: NII & NIM
1.4%
4,500
25.0%
1.3%
21.9%
4,149
1.2%
3,921
4,000
1.2%
1.1%
1.0%
3,500
20.0%
1.0%
3,000
14.5%
0.8%
12.7%
12.4%
15.0%
0.8%
0.7%
0.7%
2,500
12.1%
11.6%
0.6%
0.6%
2,000
1,532
1,470
2,460
10.0%
0.4%
1,500
1,169
0.4%
0.3%
0.2%
1,000
5.0%
0.2%
0.1%
500
0.0%
0
0.0%
FY11
FY12
FY13
FY14
FY15
9MFY16
FY11
FY12
FY13
FY14
FY15
9MFY16
Gross NPA / On-Book AUM Net NPA / On-Book AUM
Net interest income
Net interest margin
Source: Company, Angel Research
Source: Company, Angel Research
Exhibit 14: Return rations are decent lower leverage
Exhibit 15: Operating expense/ Average AUM
allows scope for RoA & RoE expansions
14.0
13.0
16.0%
14.7%
12.3
14.1%
11.2
12.0
14.0%
10.0
10.0
12.0%
10.9%
8.2
8.0
10.0%
8.2%
7.6%
6.0
8.0%
7.1%
3.3
3.2
3.0
3.1
4.0
6.0%
2.3
2.0
4.0%
0.0
2.0%
(2.0)
(0.4)
(1.2)
0.0%
FY11
FY12
FY13
FY14
FY15
9MFY16
FY11
FY12
FY13
FY14
FY15
9MFY16
Return on average assets Return on average net worth
Operating expense/ Average AUM
Source: Company, Angel Research
Source: Company, Angel Research
April 4, 2016
8
Equitas Holdings | IPO Note
Exhibit 16: Consolidated Performance
FY12
FY13
FY14
FY15
9MFY16
AUM (Rs. crs)
824
1,484
2,486
4,010
5,505
% growth
3.8
80.1
67.5
61.3
37.3
On Book %
74.8
81.8
85.4
86.4
91.1
Off Book %
25.2
18.2
14.6
13.6
9.0
NIM %
14.5
12.7
12.4
12.1
11.6
ROA
(0.4)
2.3
3.2
3.0
3.1
ROE %
(1.2)
8.2
12.3
11.2
13.0
Cost/ Income %
88.3
71.8
55.0
53.6
52.4
Cost/ AUM %
14.7
10.9
8.2
7.6
7.1
Gross NPA/ On Book AUM (%)
1.2
0.3
0.7
1.1
1.3
Net NPA/ On Book AUM (%)
0.1
0.2
0.6
0.8
1.0
Leverage
3.2
3.6
3.8
3.8
4.5
Source: Company, Angel Research
Overview of Microfinance Industry:
The microfinance industry (MFI) witnessed rapid growth after 2001, after the RBI
granted priority sector status to bank loans advanced to MFIs. MFI had a problem
of high cost of funds and in order to tackle the problem the Union Budget 2016
announced setting up MUDRA Bank to refinance the microfinance sector. As a
result microfinance companies have better access to funds at lower costs and can
now scale up. Though there are ~60 microfinance companies in India, nearly 70%
of the gross loan portfolio is accounted by the top 10 players.
Exhibit 17: Top10 MFI’s in India
Top MFIs, gross loan portfolio (Rs. cr)
Q3FY16
Market Share (%)
Janalakshmi
8,096
19.1
SKS
6,177
14.5
Ujjivan
4,088
9.6
Satin
2,538
6.0
Equitas
2,320
5.5
Grameen Koota
1811
4.3
L & T Finance
1700
4.0
ESAF
1495
3.5
Spandana
1221
2.9
Grama Vidiyal
1147
2.7
Total of Top 10
30,593
72.0
Source: MFIN
April 4, 2016
9
Equitas Holdings | IPO Note
Exhibit 18: State-wise distribution of gross loan portfolio of the industry
State-wise distribution of gross loan portfolio
Q3FY16
Tamil Nadu
16.1%
Karnataka
13.8%
Maharashtra
11.9%
Uttar Pradesh
10.9%
Madhya Pradesh
7.8%
Odisha
6.1%
West Bengal
5.8%
Bihar
5.4%
Kerela
4.4%
Gujarat
3.7%
Others
14.1%
Total
100.0%
Source: MFIN
Other key observations:
Equitas is the first IPO in the proposed SFB segment. With current FII holding at
93%, participation of FIIs in the current IPO has not been allowed. Post IPO, the
foreign holding will come down to 35% and hence we expect value buyers to come
forward looking at the growth prospects the company offers in the long run.
Valuation
At the upper band of the offer price `110 the issue is priced at 1.8x its diluted BV
of `60 (pre-dilution 2.3x). The company has decent ROE and ROA of 13% and
3.1%. Though post conversion to a SFB the return ratios might be compressed,
while we expect the same to scale up subsequently. We believe the issue is
attractively priced looking at the growth options the company offers in the long
run. We recommend SUBSCRIBE to the issue.
April 4, 2016
10
Equitas Holdings | IPO Note
Comparative table
Within the listed space, we believe SKS Microfinance is the best comparable
company, while on others parameters we have tried to make a comparison with
other listed NBFCs as well.
Exhibit 19: Comparative - Micro Finance
Equitas
SKS Micro Fin
Janlakshmi
Ujjivan
Satin
Gross Loan Portfolio (crs)
2,935
6,177
8,096
4,088
2,538
Avg loan o/s per client
9,634
14,857
21,146
15,739
15,873
Branches
377
1,167
338
469
364
Employees
4,255
11,086
7,978
7,786
3,419
Clients (lakhs)
24.1
41.6
38.3
26.0
16.0
Source: MFIN
Exhibit 20: Comparative - Micro Finance
Equitas
SKS Micro Fin
NIM %
11.1%
10.5%
ROA%
2.9%
4.5%
ROE %
19.1%
25.0%
CAR %
21.0%
23.9%
GNPAs %
0.2%
0.1%
NNPAs%
0.1%
0.1%
P/BV
2.3x
4.2x
Leverage
4.0x
4.5x
Source: Company, Angel Research
Exhibit 21: Comparative - Vehicle Finance
Consolidated
Equitas
STFC Chola Sundaram Fin
Magma FinCorp
AUM Rs Crs
5,505
66,538
28,004
17,499
18,521
AUM CAGR
69.5%
13.7%
23.6%
6.4%
13.8%
3 yr (FY12-15)
NIM
11.6%
7.1%
8.5%
6.0
7.2%
GNPAs%
1.3%
4.3%
3.3%
2.1%
7.3%
NNPAs%
1.0%
0.9%
1.8%
1.1%
5.7%
Leverage
2.9
6.6
7.5%
5.6%
6.7%
ROA%
3.1%
2.2%
3.2%
2.3%
1.4%
ROE%
13.0%
14.2%
16.7%
13.8%
9.1%
Source: Company, Angel Research
April 4, 2016
11
Equitas Holdings | IPO Note
Risks
High concentration to a single state: Equitas derives ~63% of its AUM from Tamil
Nadu alone. Any change in socio political situation and natural calamity can
impact the economic condition of the borrowers and in turn impact the credit
quality of the company.
Ability to scale up its operations fast: The company is raising `720cr through fresh
issuance of shares, amounting to 56% of the existing net worth. Inability to scale
up its operations will result in ROE dilution in the near term.
Ability to meet deposit targets post SFB conversion: Post conversion to a SFB,
Equitas will be allowed to raise deposits from customers. Ability to raise deposits
from its existing client base will be limited looking at the average income profile of
the said borrowers. It might have to offer higher rates vis-a-vis other banks which
might have a negative impact on the NIM.
April 4, 2016
12
Equitas Holdings | IPO Note
Income statement
Y/E March (`cr)
FY2012
FY2013
FY2014
FY2015 9MFY2016
NII
125.3
155.3
259.6
401.3
423.3
- YoY Growth (%)
-
23.9
67.2
54.6
-
Other Income
9.1
20.2
34.4
59.9
63.1
- YoY Growth (%)
-
121.9
70.0
74.1
-
Operating Income
134.4
175.5
294.0
461.2
486.4
- YoY Growth (%)
-
30.6
67.5
56.9
-
Operating Expenses
118.7
126.0
161.8
247.2
254.7
- YoY Growth (%)
20.3
6.2
28.4
52.8
-
Pre - Provision Profit
15.8
49.6
132.2
214.0
231.7
- YoY Growth (%)
-
214.1
166.9
61.8
-
Prov. & Cont.
5.0
8.9
18.4
50.4
44.5
- YoY Growth (%)
-
78.5
106.5
174.1
-
Profit Before Tax
11.7
39.8
113.8
163.6
187.2
- YoY Growth (%)
-
240.8
186.3
43.7
-
Prov. for Taxation
14.4
7.9
39.5
56.6
66.9
- as a % of PBT
-
-
402.4
43.3
-
PAT
(2.7)
31.9
74.3
107.0
120.4
- YoY Growth (%)
-
-
133.0
43.9
-
Balance sheet
Y/E March (`cr)
FY2012 FY2013 FY2014
FY2015 9MFY2016
Share Capital
44.4
57.8
73.0
269.0
271.1
Reserve & Surplus
257.8
414.2
669.0
901.8
1,023.4
Loan Funds
563.8
1,274.4
1,849.2
3,032.2
4,154.9
- Growth (%)
-
126.0
45.1
64.0
37.0
Other Liab.& Prov.
94.8
107.6
160.4
261.9
347.3
Total Liabilities
960.8
1,853.9
2,751.6
4,464.9
5,796.7
Cash and Cash Equivalents
184.5
446.0
414.7
557.4
280.1
Investments
0.2
7.6
3.6
175.7
176.5
Advances
667.2
1,270.7
2,168.8
3,505.7
5,076.8
- Growth (%)
0.6
90.4
70.7
61.6
44.8
Fixed Assets
25.6
24.2
27.8
47.3
51.5
Other Assets
83.3
105.6
136.7
178.8
211.7
Total Assets
960.8
1,853.9
2,751.6
4,464.9
5,796.7
April 4, 2016
13
Equitas Holdings | IPO Note
Ratio analysis
Y/E March
FY2012
FY2013
FY2014
FY2015
9MFY2016
Profitability ratios (%)
NIMs
14.5
12.7
12.4
12.1
11.6
RoA
(0.7)
2.3
3.2
3.0
3.0
RoE
(2.4)
8.5
12.2
11.2
13.1
Asset Quality (%)
Gross NPAs
1.2
0.3
0.7
1.1
1.3
Net NPAs
0.1
0.2
0.6
0.8
1.0
Per Share Data (`)
EPS
(0.3)
2.1
4.0
4.5
4.5
BVPS
68.0
81.7
102.1
43.5
48.0
Valuation Ratios
PER (x)
(181.3)
19.9
10.7
27.6
24.6
P/ABVPS (x)
1.6
1.3
1.1
2.5
2.3
Dividend Yield (%)
0.0
0.0
0.0
0.0
0.0
DuPont Analysis
NII
26.1
11.0
11.3
11.1
10.3
(-) Prov. Exp.
1.0
0.6
0.8
1.4
1.0
Adj. NII
25.0
10.4
10.5
9.7
9.3
Other Inc.
1.9
1.4
1.5
1.7
1.5
Op. Inc.
26.9
11.8
12.0
11.4
10.9
Opex
24.7
9.0
7.0
6.9
6.2
PBT
2.2
2.9
4.9
4.5
4.6
Taxes
3.0
0.6
1.7
1.6
1.6
RoA
(0.7)
2.3
3.2
3.0
3.0
Leverage
3.2
3.6
3.8
3.8
4.4
RoE
(2.4)
8.5
12.2
11.2
13.1
April 4, 2016
14
Equitas Holdings | IPO Note
Research Team Tel: 022 - 39357800
DISCLAIMER
Angel Broking Private Limited (hereinafter referred to as “Angel”) is a registered Member of National Stock Exchange of India Limited,
Bombay Stock Exchange Limited and Metropolitan Stock Exchange of India Limited. It is also registered as a Depository Participant with
CDSL and Portfolio Manager with SEBI. It also has registration with AMFI as a Mutual Fund Distributor. Angel Broking Private Limited is
a registered entity with SEBI for Research Analyst in terms of SEBI (Research Analyst) Regulations, 2014 vide registration number
INH000000164. Angel or its associates has not been debarred/ suspended by SEBI or any other regulatory authority for accessing
/dealing in securities Market. Angel or its associates including its relatives/analyst do not hold any financial interest/beneficial
ownership of more than 1% in the company covered by Analyst. Angel or its associates/analyst has not received any compensation /
managed or co-managed public offering of securities of the company covered by Analyst during the past twelve months. Angel/analyst
has not served as an officer, director or employee of company covered by Analyst and has not been engaged in market making activity
of the company covered by Analyst.
This document is solely for the personal information of the recipient, and must not be singularly used as the basis of any investment
decision. Nothing in this document should be construed as investment or financial advice. Each recipient of this document should
make such investigations as they deem necessary to arrive at an independent evaluation of an investment in the securities of the
companies referred to in this document (including the merits and risks involved), and should consult their own advisors to determine
the merits and risks of such an investment.
Reports based on technical and derivative analysis center on studying charts of a stock's price movement, outstanding positions and
trading volume, as opposed to focusing on a company's fundamentals and, as such, may not match with a report on a company's
fundamentals.
The information in this document has been printed on the basis of publicly available information, internal data and other reliable
sources believed to be true, but we do not represent that it is accurate or complete and it should not be relied on as such, as this
document is for general guidance only. Angel Broking Pvt. Limited or any of its affiliates/ group companies shall not be in any way
responsible for any loss or damage that may arise to any person from any inadvertent error in the information contained in this report.
Angel Broking Pvt. Limited has not independently verified all the information contained within this document. Accordingly, we cannot
testify, nor make any representation or warranty, express or implied, to the accuracy, contents or data contained within this document.
While Angel Broking Pvt. Limited endeavors to update on a reasonable basis the information discussed in this material, there may be
regulatory, compliance, or other reasons that prevent us from doing so.
This document is being supplied to you solely for your information, and its contents, information or data may not be reproduced,
redistributed or passed on, directly or indirectly.
Neither Angel Broking Pvt. Limited, nor its directors, employees or affiliates shall be liable for any loss or damage that may arise from
or in connection with the use of this information.
Note: Please refer to the important ‘Stock Holding Disclosure' report on the Angel website (Research Section). Also, please refer to the
latest update on respective stocks for the disclosure status in respect of those stocks. Angel Broking Pvt. Limited and its affiliates may
have investment positions in the stocks recommended in this report.
April 4, 2016
15