Initiating coverage | Capital Goods
March 19, 2015
Elecon Engineering Company
BUY
CMP
`68
Initiating Coverage
Target Price
`84
Elecon Engineering Company (EECL) is one of the largest Power Transmission
Investment Period
12 Months
Equipment (PTE) and Material Handling Equipment (MHE) manufacturing
company in India. It has a leadership position in the PTE business with a market
Stock Info
share of ~30%. Its MHE business is through its 60.48% subsidiary - Elecon EPC
Sector
Capital Goods
Projects (promoters of EECL hold the balance share in the company). EECL
Market Cap (` cr)
745
acquired the Benzlers-Radicon group in 2010 from David Brown, thereby getting
Beta
1.3
a firm footing in the European and American markets. The Benzlers-Radicon
52 Week High / Low
70/25
group accounted for ~24.3% of the overall sales of the company in FY2014 with the
Avg. Daily Volume
128327
rest being equally split between the standalone PTE business and the MHE business.
Face Value (`)
2
Better times ahead for both MHE and PTE businesses: Owing to disappointing
BSE Sensex
28,622
operating environment over the past three years, the company, like many other
Nifty
8,686
players in the industry, saw disappointing or even negative growth rate. We
Reuters Code
ELCN.BO
expect the MHE business to benefit from the revival in capex in several core
Bloomberg Code
ELCN@IN
sectors in the economy, which it caters to. As far as the standalone PTE business is
concerned, it has managed to weather the storm, and has been able to maintain
a steady performance, largely due to its leadership position and diverse user
Shareholding Pattern (%)
base. The PTE business currently operates at utilization levels of 40-45% and is in
Promoters
58.1
a sweet spot in terms of capitalizing on the imminent improvement in demand.
MF / Banks / Indian Fls
9.9
Working capital situation to improve: The working capital cycle (excluding cash)
FII / NRIs / OCBs
1.2
witnessed a sharp jump in FY2014 to 194 days from 150 days in FY2013. EECL’s
Indian Public / Others
30.8
working capital cycle days are expected to come down to 166 days in FY2017E,
broadly in-line with its prior average, on account of revenue growth along with
lower inventory and lower expenditure. Additionally, there is no requirement of
Abs. (%)
3m 1yr
3yr
additional capex, which will result in a better asset turnover ratio.
Sensex
5.5
31.1
63.9
Elecon Engg
45.1
158.4
16.7
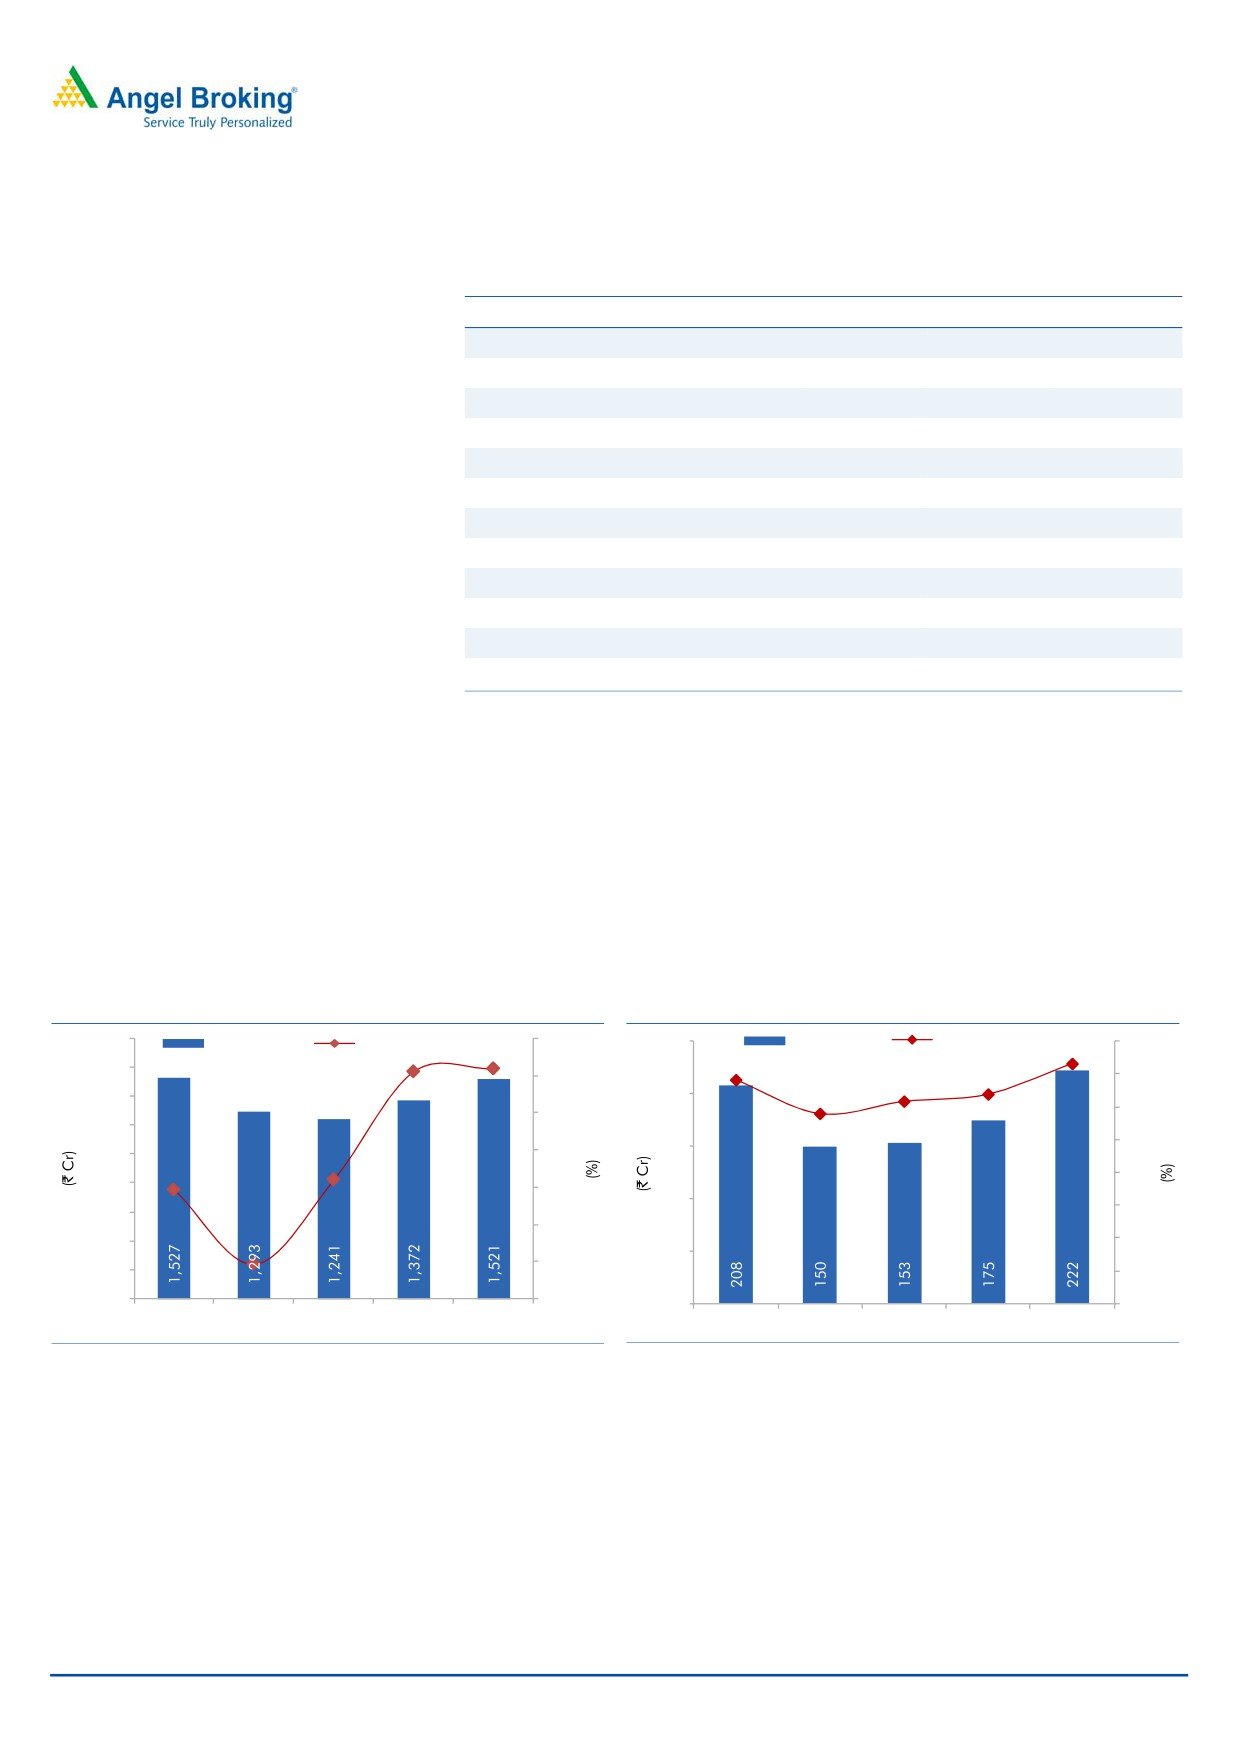
Outlook and Valuation: We expect ELCL’s consolidated revenues to post a CAGR
of 10.7% over FY2105E-17E to `1,521cr. Recovery in the MHE business margins
will result in EBITDA margins expanding by 230bp over FY2015E-17E to 14.6%.
3-year daily price chart
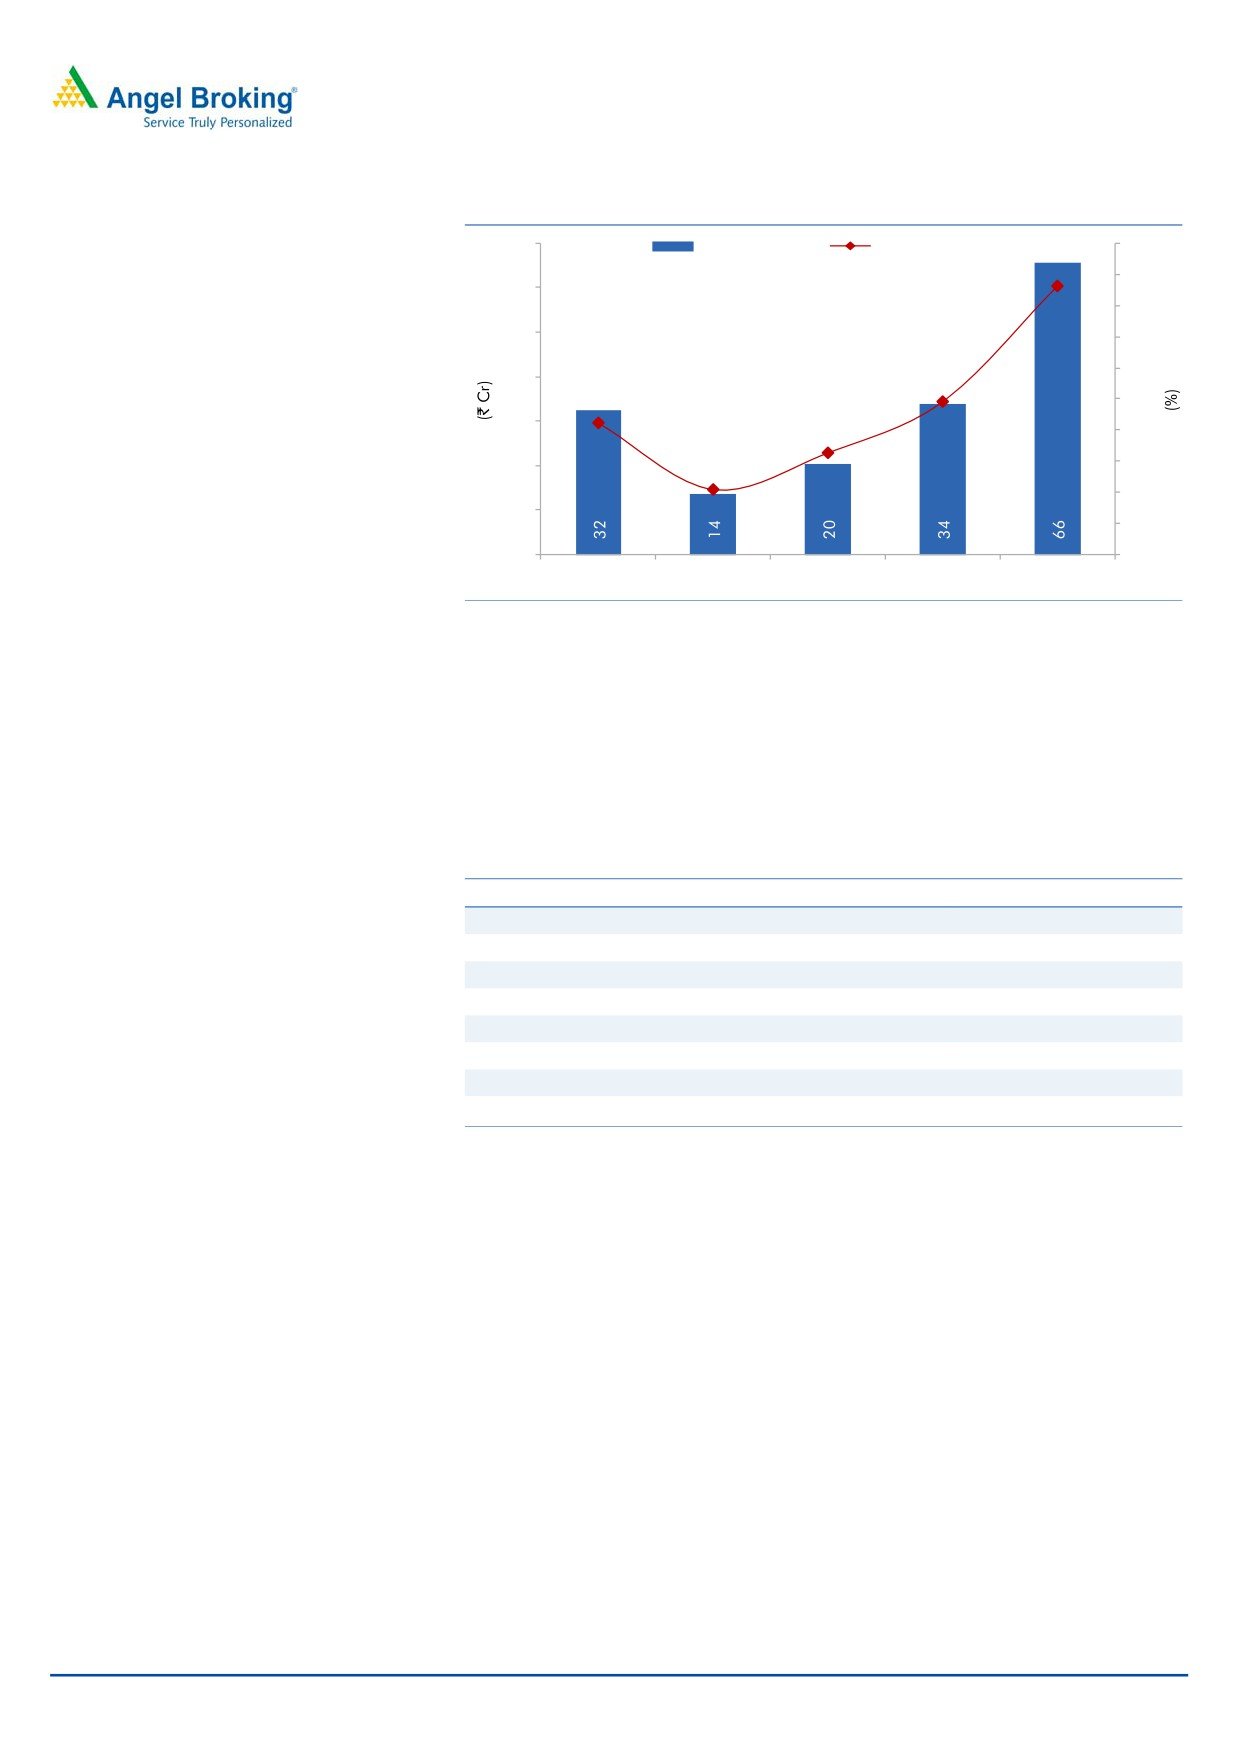
Consequently, the net profit is expected to improve to `66cr in FY2017E. At the
80
current market price, the stock is trading at 11.3x its FY2017E earnings. We
70
believe that these valuations are attractive considering its 5-year and 3-year
60
50
median P/E of 16.7x and 17.9x respectively. We initiate coverage on the company
40
with a Buy rating and with a target price of `84 based on a target PE of 14.0x.
30
20
Key Financials (Consolidated)
10
Y/E March (` cr)
FY2014 FY2015E FY2016E
FY2017E
0
Net Sales
1,293
1,241
1,372
1,521
% chg
(15.3)
(4.0)
10.5
10.9
Adj. Net Profit
14
20
34
66
% chg
(58.0)
49.6
66.0
94.5
Source: Company, Angel Research
EBITDA (%)
11.6
12.3
12.8
14.6
EPS (`)
1.2
1.9
3.1
6.0
P/E (x)
54.8
36.6
22.1
11.3
P/BV (x)
1.4
1.4
1.3
1.2
RoE (%)
2.5
3.8
6.0
10.9
RoCE (%)
6.2
6.7
8.4
11.6
Milan Desai
EV/Sales (x)
1.0
1.0
0.9
0.7
022 4000 3600
EV/EBITDA (x)
8.7
7.9
6.7
5.1
Source: Company, Angel Research; Note: CMP as of March 18, 2015
Please refer to important disclosures at the end of this report
1
Initiating coverage | Elecon Engineering
Investment Argument
Better times ahead, gradual elevation over long term
EECL is one of the largest manufacturers of MHE and power transmission solutions
in Asia. Its 60.48% subsidiary Elecon EPC Projects is the third largest MHE
company in India today. Its standalone business, which encompasses power
transmission, is the largest gear manufacturing unit in Asia and its market share in
India currently stands at 30%. Both the standalone and the MHE business of the
company accounted for ~39% (each) of the overall revenues.
Owing to disappointing operating environment over the past three years, EECL,
like many other players in the industry, saw disappointing or even negative growth
rate. Elecon EPC Projects serves the bulk material handling needs for the power,
mining, steel, cement, fertilizers and ports & marine industries while EECL’s
standalone business caters to power transmission equipment requirement of
various industries such as power, steel, cement, sugar, plastics, etc.
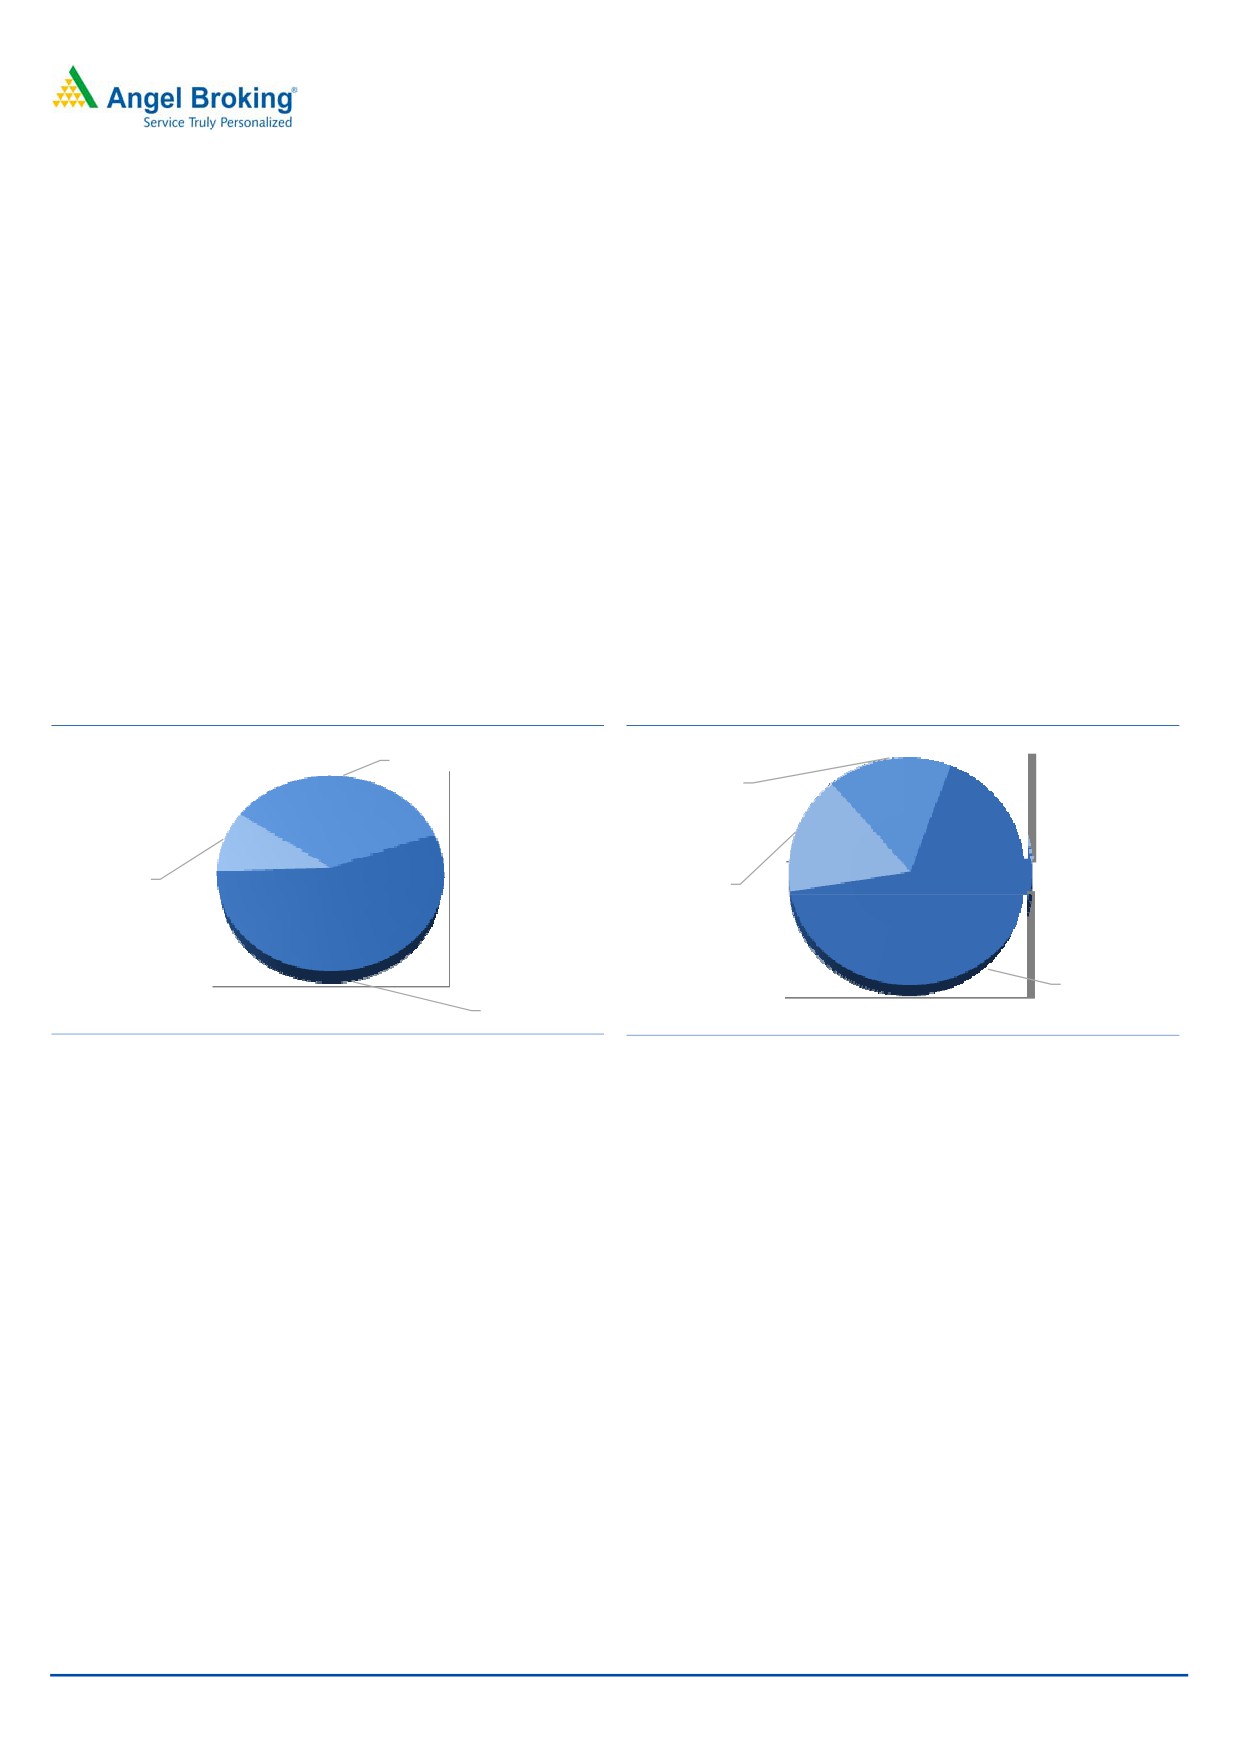
Exhibit 1: Standalone PTE Order book breakup
Exhibit 2: MHE Order book breakup
Others, 35%
Others, 15%
Sugar, 10%
Mining, 15%
Power, 60%
Power &
mining , 55%
Source: Company, Angel Research
Source: Company, Angel Research
We believe that the economy is set for a revival and gradual recovery at the macro
level will lead to better times for EECL. The company’s standalone business had
been managing to post good results with stable growth in the past (reporting EBIT
margins in the range of 15%), although the performance has been subdued in the
past two years, which we believe, will recover on the back of movement seen in key
industries like plastics, power and mining.
We expect the MHE business to be the main beneficiary of increase in capex in the
power, mining, and ports sectors. Speedier project clearances along with declining
interest rates should provide the much needed impetus to the sector, which in
recent times has been battling stalled projects, tightening cash flows and high
interest rates.
March 19, 2015
2
Initiating coverage | Elecon Engineering
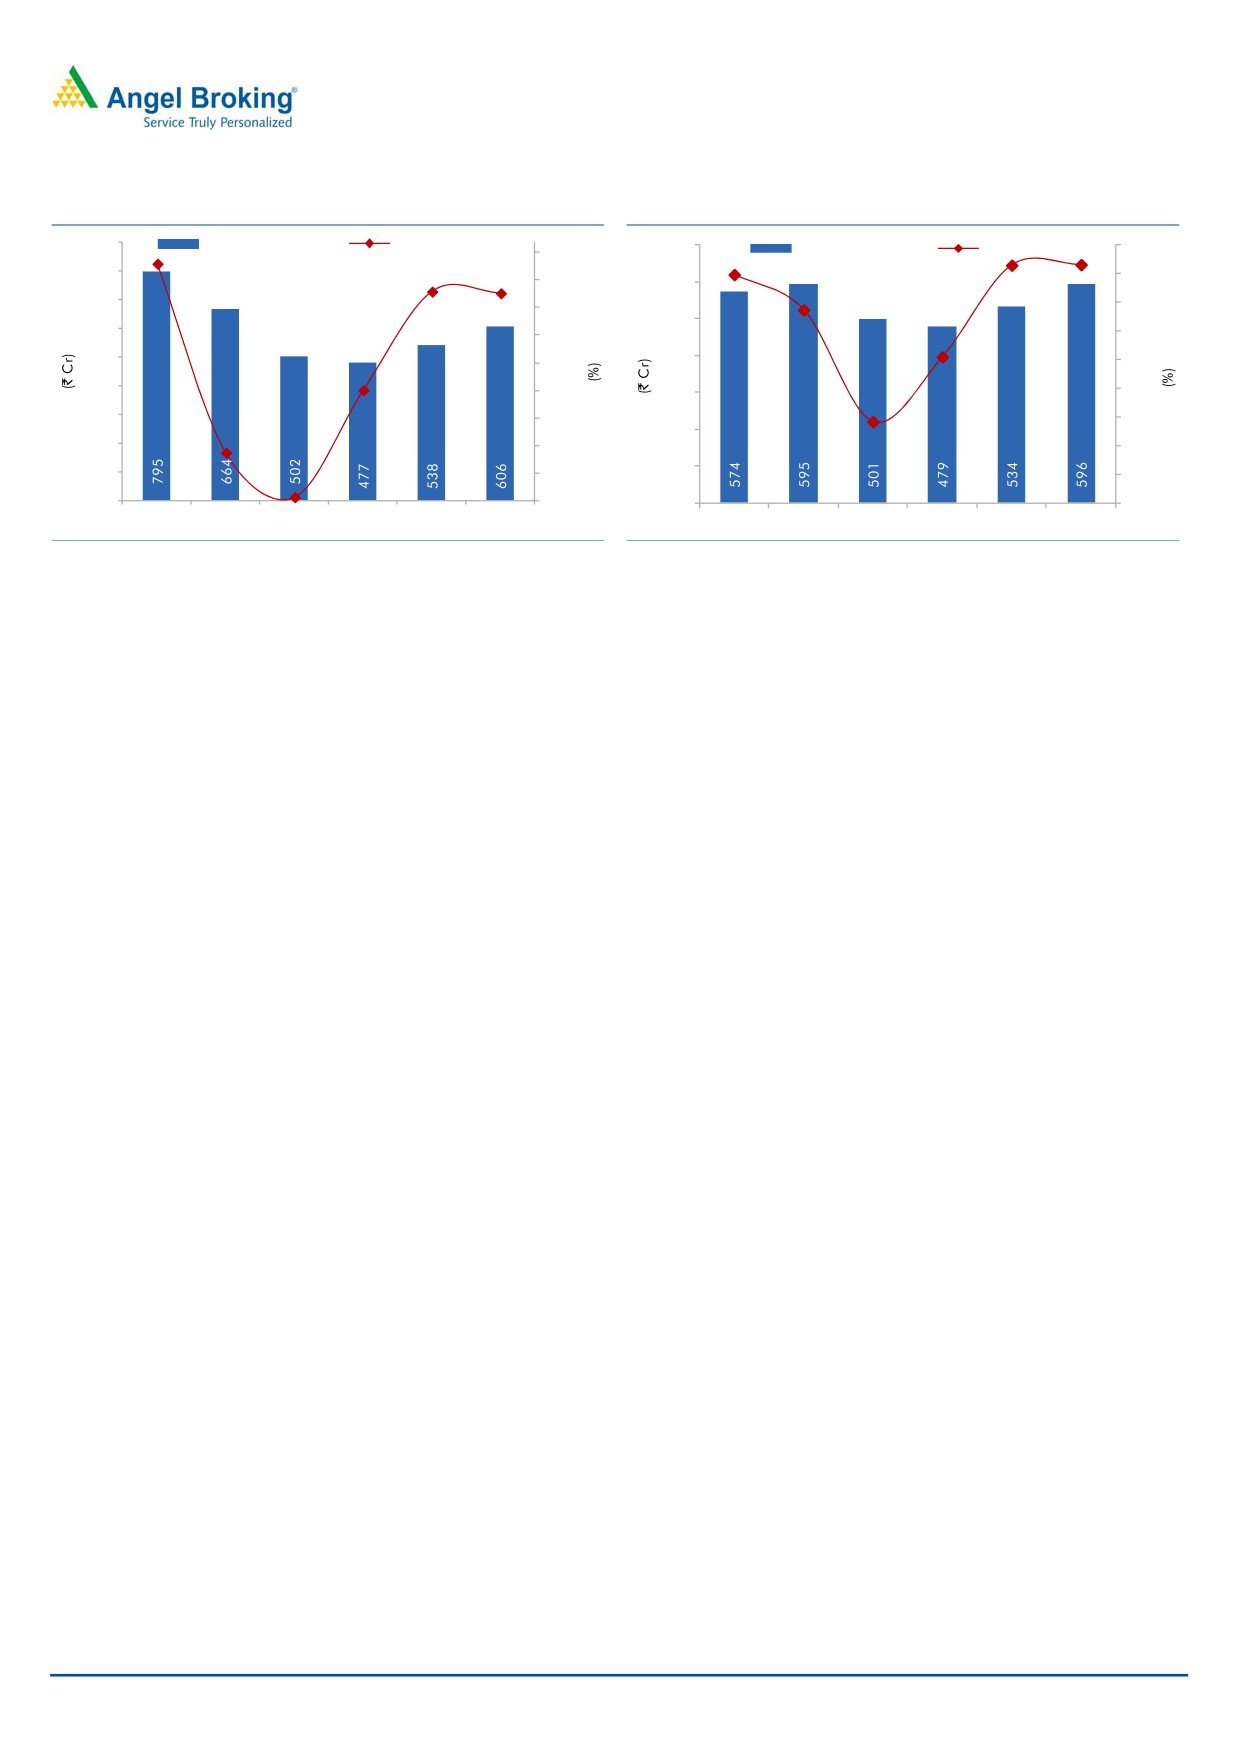
Exhibit 3: MHE Revenues and Growth trend
Exhibit 4: Standalone PTE Revenue and Growth trend
900
MHE Revenue (LHS)
MHE Growth (RHS)
700
20.0
PTE Revenue (LHS)
Growth (RHS)
15
18.0
11.
6
800
9.9
11.5
10
12.6
15.0
600
700
12.9
5
10.0
3.7
500
600
-
5.0
500
400
(4.5)
-
(5)
400
(10)
(5.0)
(5.0)
300
300
(10.0)
(15)
(15.8)
200
200
(15.0)
(20)
(16.4)
100
100
(20.0)
(25)
(24.4)
-
(25.0)
-
(30)
FY2012
FY2013
FY2014
FY2015E FY2016E FY2017E
FY2012
FY2013
FY2014
FY2015E FY2016E FY2017E
Source: Company, Angel Research
Source: Company, Angel Research
Key Opportunities for MHE business
Power, mining, cement, and manufacturing sectors are the demand drivers for the
MHE business. The company has strong experience, diversified skills and
capabilities in the MHE business in terms of catering to various sectors. Sizable
investments in the core sector industries are likely to boost demand for the MHE
business. The MHE business’ current order book stands at `1,200cr with the power
sector accounting for 60%, mining accounting for 15% and others accounting for
the remaining 15%.
Power: India’s per capita power consumption still lags the consumption levels of
that in the developed countries, thereby providing huge potential for investment in
the sector. The company has significant exposure (~60-70%) to this segment
through its MHE business, ie mainly coal handling system. In the 12th Five Year
Plan the planning commission has projected power capacity addition to the tune of
88,537MW and the share of coal based plants is expected to be at 69,280MW.
Additionally, the government has also proposed to set up five Ultra Mega Power
Projects, each of 4,000MW, in the plug-and-play mode, with all clearances and
linkages in place.
Mining: There reportedly exists a correlation between the mining and
manufacturing sectors. The mining sector is a significant contributor to our
country’s GDP. However, the sector has been underperforming over the past
3-4 years owing to projects being stalled due to lack of environmental clearances
and land acquisition issues. We believe that the NDA government at the centre will
take the necessary measures to revive the stalled projects.
In our view, a pick-up in infrastructure activities in the country will directly drive up
demand for the power, steel and cement sectors, which in turn will result in
additional capex in the said sectors.
PTE business a steady performer; to benefit from operating
leverage
Despite a poor macro environment, EECL’s PTE business (standalone) has been
able to post decent numbers. This is largely due to its leadership position in the
industrial gear box segment, better product mix and prudent measures taken by
the Management to sustain profitability by way of taking cost cutting measures. It
March 19, 2015
3
Initiating coverage | Elecon Engineering
has good revenue visibility with current order book at `280cr. Within this, 55% is
constituted by the power and mining sector, sugar accounts for 10%, and the
balance is constituted by various industries like cement, steel, plastic, ports, etc.
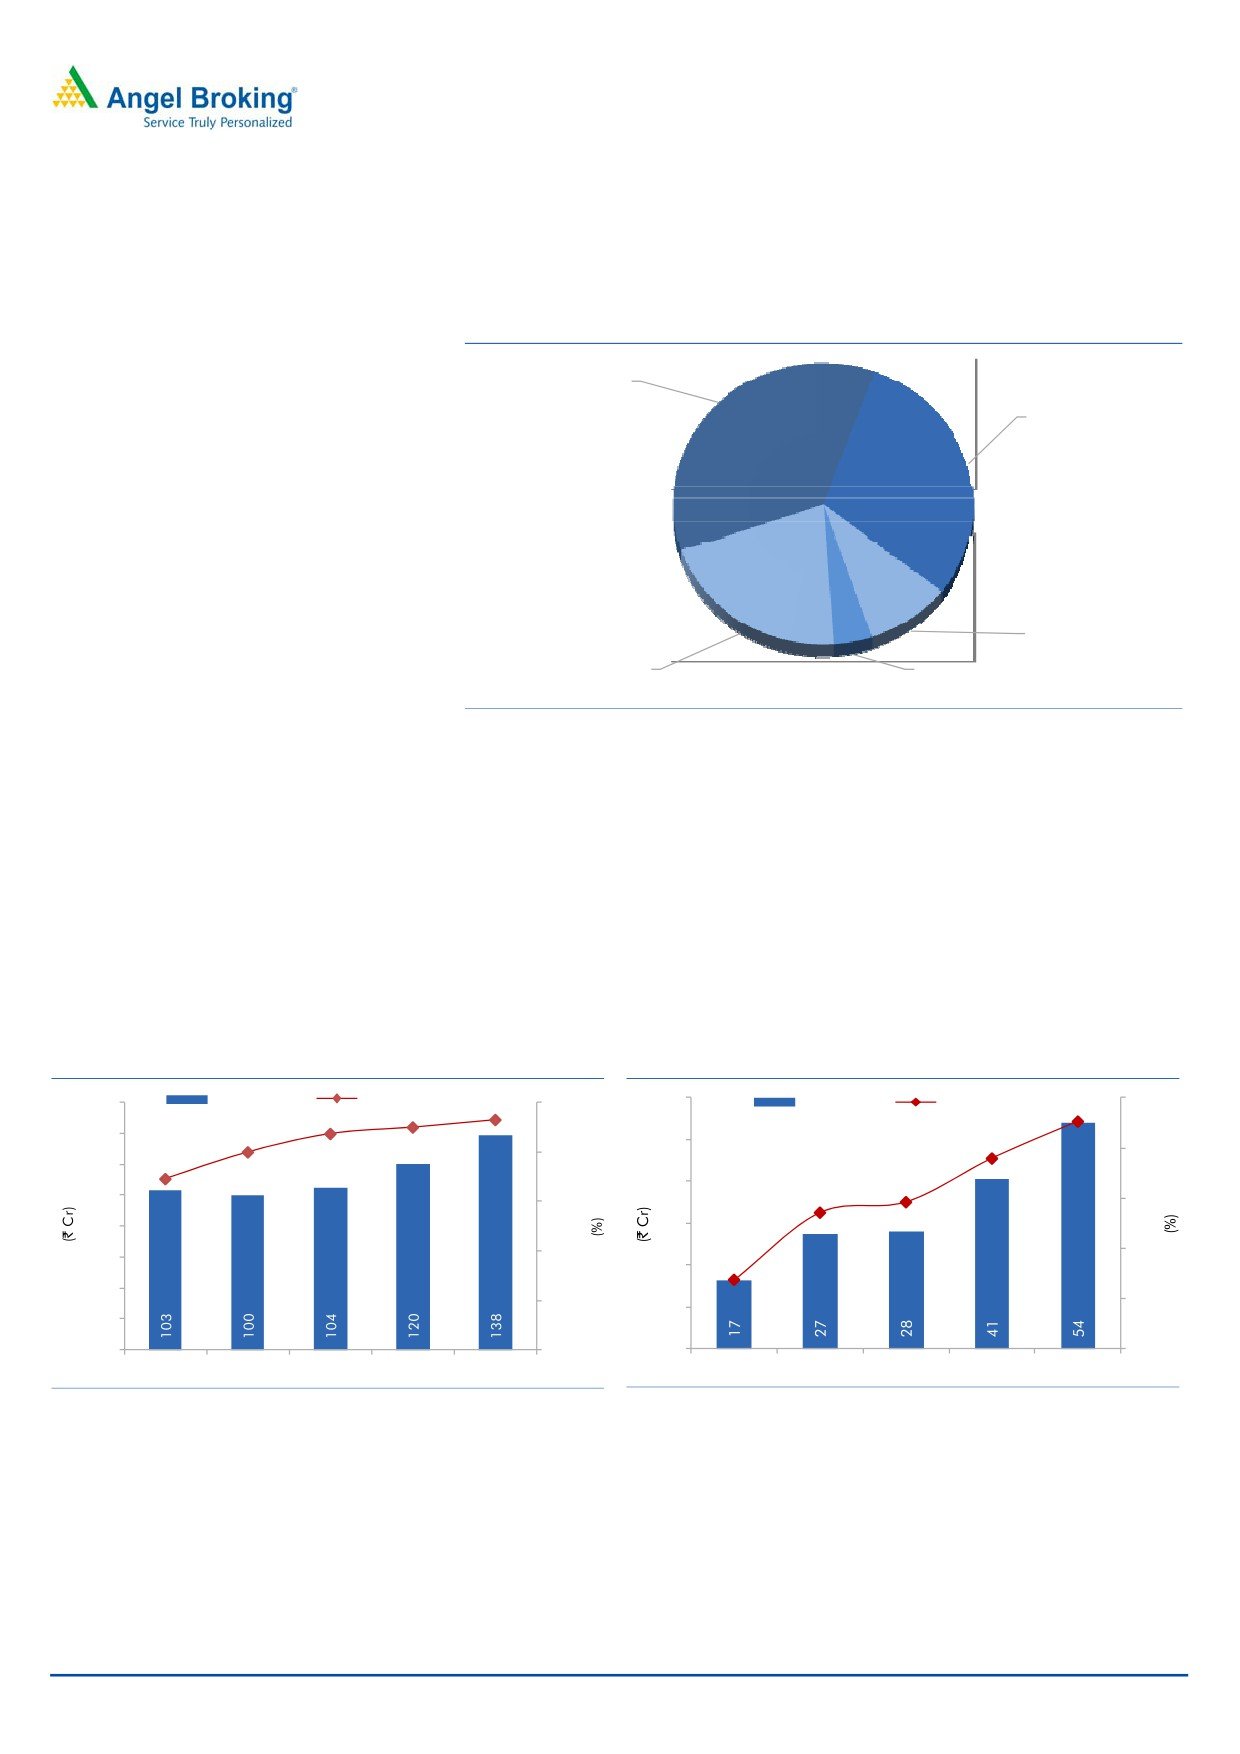
Exhibit 5: Share of ~`1,670 Domestic gear industry
Others, 36%
Elecon
Engineering, 30%
Shanthi Geras,
Premium
9%
Transmission,
New Allenberry
21%
Works, 4%
Source: Company, Angel Research
Since the company has exposure to various industries, we expect the standalone
PTE business to benefit from an imminent improvement in the capex cycle.
Moreover, as per our estimation, the capacity utilization currently stands at 40-
45%. With an expected surge in demand, the standalone business will stand to
benefit from operating leverage. Going forward, we expect the standalone
business to post a CAGR of 11.5% over FY2015E-17E to `596cr. Owing to
operating leverage coming into play, we expect the EBITDA margins to improve to
23.2% in FY2017E and expect the net profit to post a CAGR of 38.7% over
FY2015E-17E to `54cr.
Exhibit 6: Standalone EBITDA & EBITDA Margins
Exhibit 7: Standalone PAT and PAT Margins
160
EBITDA (LHS)
EBITDA Margins (RHS)
25.0
60
PAT (LHS)
PAT Margins (RHS)
10.0
23.2
9.1
140
22.5
50
21.8
8.0
20.0
20.0
120
7.6
17.3
40
100
15.0
6.0
5.9
5.4
80
30
10.0
4.0
60
20
2.8
40
5.0
2.0
10
20
-
-
-
-
FY2013
FY2014
FY2015E FY2016E FY2017E
FY2013
FY2014
FY2015E FY2016E FY2017E
Source: Company, Angel Research
Source: Company, Angel Research
Benzlers-Radicon restructuring to have a meaningful impact in the long
run: EECL bought Benzlers and Radicon, the gear divisions of David Brown
Systems (DB) in 2010, which were the catalogue business of DB. The acquisition
was made at a valuation of ~20mn GBP at the time (~`150cr). Although the
general consensus was that the acquisition would yield results from the get-go, the
economic scenario in Europe resulted in subdued performance by the subsidiary.
March 19, 2015
4
Initiating coverage | Elecon Engineering
EECL is in the process of restructuring its operations in Europe, which is more likely
to be along the lines of shifting of some production to India to develop higher
quality products that meets European standards at a lower cost. The company will
most likely shift a major portion of production to India in the longer run. This along
with other cost cutting measures undertaken by the Management and with a
gradual recovery in Europe, the subsidiary should have a meaningful contribution
over the longer term. At present the EBITDA margins for Benzlers-Radicon are
more likely to continue to be in lower single digits, which although would improve
to ~10% over the longer run.
Working capital situation to improve
The receivables for the company had spiked to `853cr in FY2014 to 66% of sales
(from 55% in FY2013), thus resulting in the working capital cycle jumping to 194
days in FY2014_from 150 days in FY2013. We believe the higher receivables
could mainly be attributed to Elecon EPC Projects with a major portion of it related
to retention money which is paid at the time of project completion. As far as the
retention money is concerned, the risk is almost non-existent and we expect the
company to recover the money once the projects get completed.
We expect that with faster completion of the projects, the company will see some
improvement in terms of working capital cycle. With improving overall top-line
growth and improving margins, we expect the working capital days (ex-cash) to
come down from 192 days in FY2015E to 166 days in FY2017E. With minimal
maintenance capex required, we expect the asset turnover ratio (gross block) to
improve from 1.3x in FY2015E to 1.6x in FY2017E.
March 19, 2015
5
Initiating coverage | Elecon Engineering
Consolidated Financials
Exhibit 8: Revenue and profit break up
FY2015E
FY2016E
FY2017E
Revenue
Elecon EPC Projects
477
538
606
EECL Standalone
479
534
596
Radicon-Benzler
308
324
346
Less: Inter Company
22
25
27
Consolidated
1,241
1,372
1,521
Profit
Elecon EPC Projects
15
25
33
EECL Standalone
28
41
54
Radicon-Benzler
(20)
(18)
2
Less: Inter Company
6
12
23
Consolidated
17
35
66
Source: Company, Angel Research
Recovery in Capex across industry to improve top-line
The impending improvement in the economic environment is expected to boost the
demand for both the PTE business as well as the MHE business of the company.
Judging by the standalone performance in the current year, we have accounted for
a decline in top-line for all businesses in FY2015E and gradually scaled up our
estimates from thereon. We believe that the above mentioned scenario will result in
a CAGR of 10.7% over FY2015E-17E to `1,521cr.
Exhibit 9: Revenues to improve on revival in capex
Exhibit 10: EBITDA Margins to witness improvement
1,800
15.0
EBITDA (LHS)
EBITDA Margins (RHS)
Revenue (LHS)
Revenue Growth (RHS)
250
16.0
1,600
10
.9
14.6
10.0
14.0
10.5
13.6
1,400
200
12.8
12.0
5.0
12.3
11.6
1,200
10.0
-
150
1,000
8.0
800
(5.4)
(5.0)
(4.0)
100
6.0
600
(10.0)
400
4.0
50
(15.0)
200
(15.3)
2.0
-
(20.0)
-
-
FY2013
FY2014
FY2015E FY2016E FY2017E
FY2013
FY2014
FY2015E FY2016E FY2017E
Source: Company, Angel Research
Source: Company, Angel Research
EBITDA margin to expand
We expect the consolidated EBITDA margins to witness a 230bp expansion over
FY2015E-17E to 14.6%, mainly on back of revenue growth, particularly in the
MHE business. We have reduced the debt quantum for FY2015E in our estimates
and also taken lower reduction in debt in our estimates going forward. The
resultant lowered interest outgo will directly add on to the bottom-line. Adjusting
for minority interest, the company’s net profit is expected to be at `66cr for
FY2017E.
March 19, 2015
6
Initiating coverage | Elecon Engineering
Exhibit 11: PAT trajectory
70
PAT (LHS)
PAT Margins (RHS)
5.0
4.5
60
4.3
4.0
50
3.5
3.0
40
2.5
2.5
30
2.1
2.0
20
1.6
1.5
1.1
1.0
10
0.5
-
-
FY2013
FY2014
FY2015E
FY2016E
FY2017E
Source: Company, Angel Research
Sensitivity Analysis
Currently, we are building in a revenue growth of -4% over FY2014-15E while the
same is expected to be 10.9% over FY2016E-17E. Assuming operating margins to
be above 14%, the net profit is expected to be at `66cr for FY2017E. However, if the
revenue growth slumps to ~6%, then the net profit would decline to ~`30cr levels.
Exhibit 12: Sensitivity Analysis
FY2017E Revenue growth rate (%)
PAT (` Cr)
6.4
37
7.9
46
9.4
56
10.9
66
12.4
75
13.9
85
15.4
95
16.9
104
Source: Company, Angel Research
Outlook and Valuation
The impending improvement in the economic scenario and the resultant capex is
expected to drive up demand for the MHE business. Also its PTE business stands to
benefit for the same reason. On account of operating environment turning
favorable, we expect EECL’s consolidated revenues to post a CAGR of 10.7% over
FY2105E-17E to `1,521cr. EBITDA margins of the MHE business had declined to
8.8% in FY2014 (from 13.3% in FY2013) on account of 24.4% yoy decline in
revenues. Recovery in the MHE business margins will result in the company’s
EBITDA margins expanding by 230bp over FY2015E-17E to 14.6%. Consequently,
the net profit is expected to improve to `66cr in FY2017E.
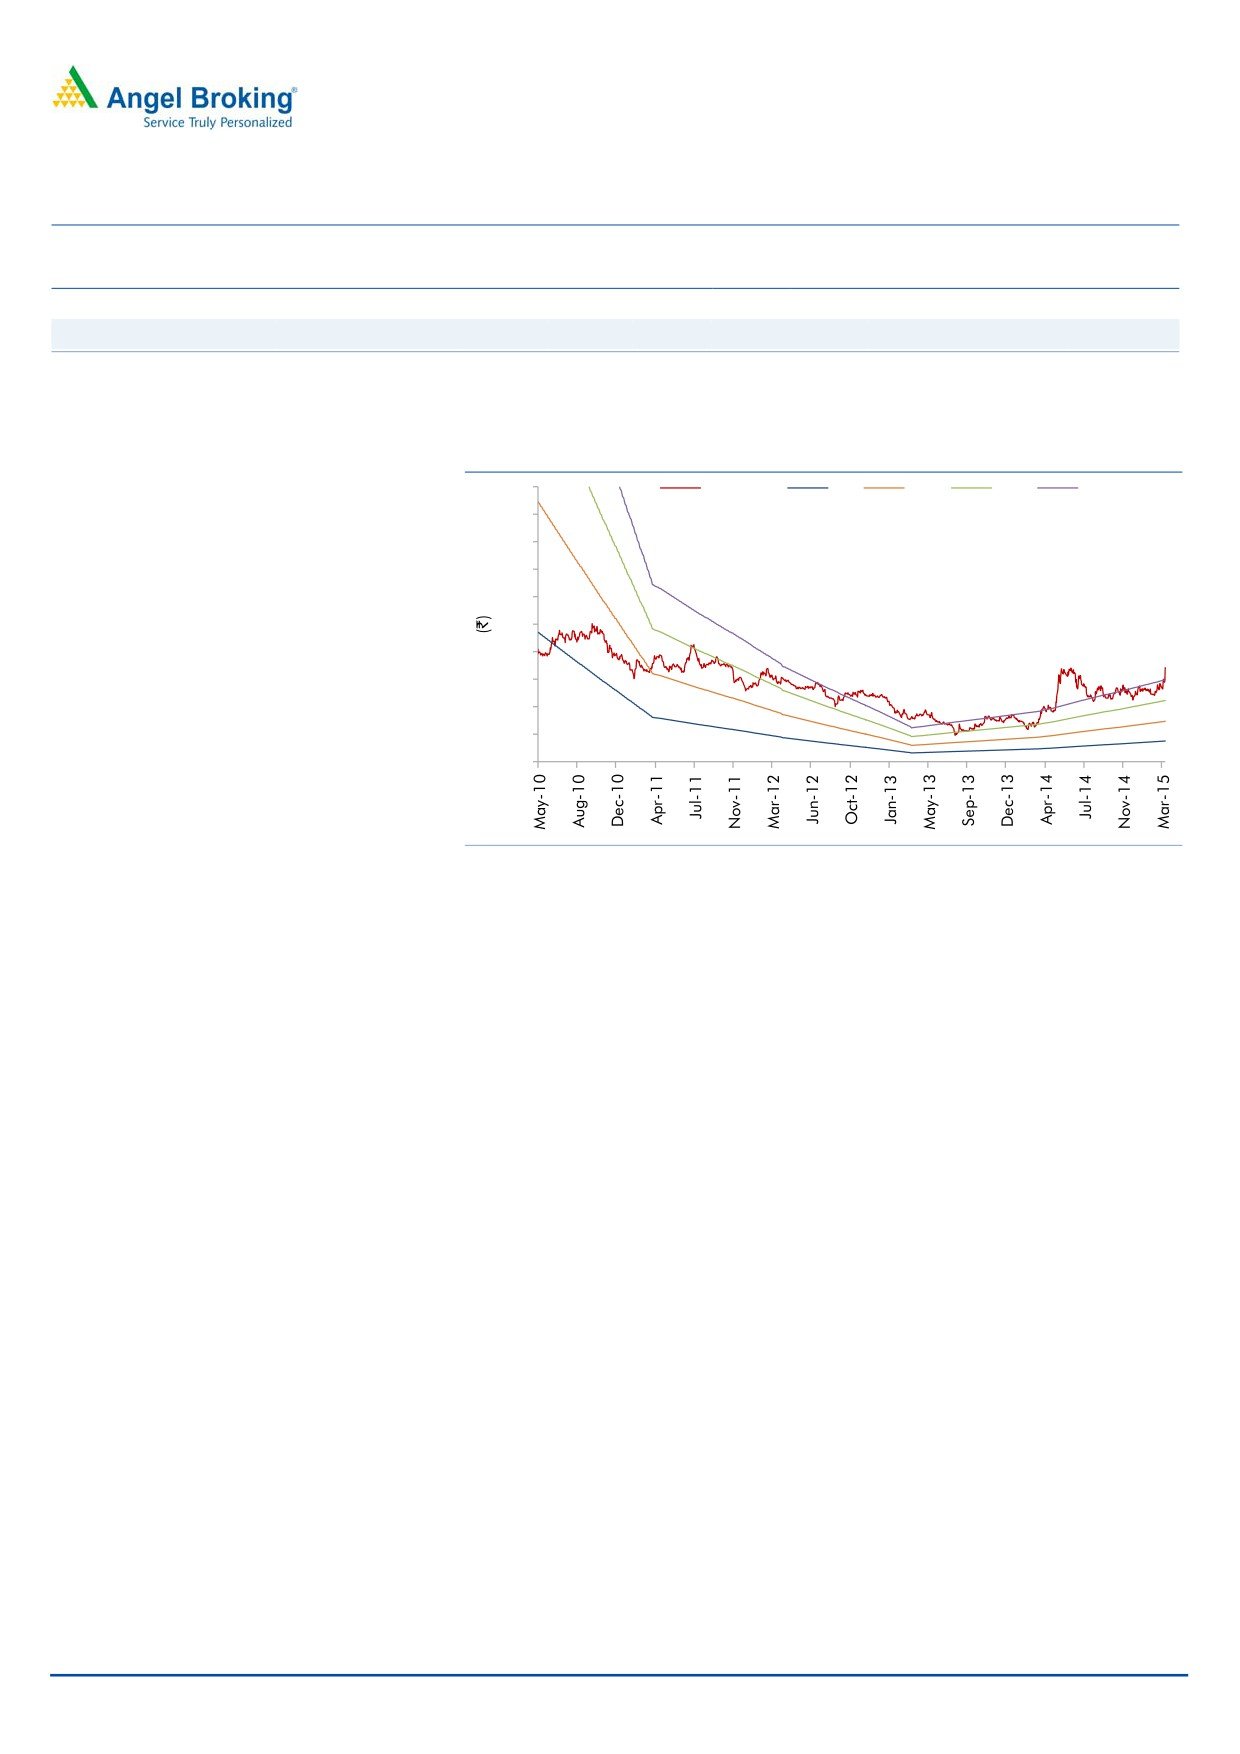
At the current market price, the stock is trading at 11.3x its FY2017E earnings. We
believe that these valuations are attractive considering its 5-year and 3-year
median P/E of 16.7x and 17.9x. We initiate coverage on the company with a Buy
rating and with a target price of `84 based on a target PE of 14.0x.
March 19, 2015
7
Initiating coverage | Elecon Engineering
Exhibit 13: Peer Comparison TTM
Company
Mcap
Sales
OPM
PAT
EPS
RoE
P/E
P/BV
EV/BITDA
EV/Sales
(` cr)
(` cr)
(%)
(` cr)
(`)
(%)
(x)
(x)
(x)
(x)
Elecon Engineering*
745
473
20.7
21
2.0
4.2
30.3
1.3
8.3
1.7
Shanthi Gears
1,012
140
16.9
12
1.4
4.2
87.6
3.7
40.1
6.8
Source: Company, Angel Research; Note: *Standalone numbers
Exhibit 14: One-year forward P/E band
200
Price (`)
5x
10x
15x
20x
180
160
140
120
100
80
60
40
20
0
Source: Company, Angel Research
Key Risks
Competition - Competition from other smaller players who bid at lower margins
will have a negative impact on the company’s business growth.
Failure of revival in capex - Both main businesses of EECL benefit indirectly from
improvement in infrastructure as well as capex in core sectors. Contraction in
capex will have a negative impact on the business.
Higher exposure to Coal Handling - EECL’s MHE business derives most of its
revenues (60-70%) from the coal handling segment for power projects. Further
delay in allocation of blocks, environmental clearances, land acquisition and other
policy related issues will have a negative impact on the business.
Foreign Exchange - The Benzlers-Radicon group has transferred some lines of
production (~30% of subsidiary’s turnover) from Sweden to India. It plans on
scaling it up to ~60-80% in a gradual manner. Depreciating Euro against the INR
will have a negative impact on the margins of the subsidiary.
March 19, 2015
8
Initiating coverage | Elecon Engineering
Company Background
Established in 1951, EECL pioneered breakthrough innovations in the manufacture
of MHE and power transmission solutions and is one of the largest manufacturers
of MHE and industrial gears in Asia. EECL has expanded its skills and expertise to
execute EPC contracts and has transformed into a fully integrated EPC company
executing several projects in India. EECL’s acquisition of Benzlers - Radicon from
David Brown Gear Systems Group in 2010 adds to the expertise in manufacturing
customized gearboxes for steel mills, high speed turbines, and satellites for Indian
Space Research Program and Naval aircraft carriers.
Structure
During 2012, the company restructured its operations by transferring EECL’s MHE
business into its Aakaaish Projects Ltd., a wholly owned subsidiary of EECL.
Aakaaish Projects was later renamed Elecon EPC Projects Ltd. The sale was for a
consideration of `127cr. Additionally, the MHE businesses of its other group
companies, Prayas Engineering Ltd and EMTICI Engineering Ltd were transferred
to Elecon EPC Projects in return for issuance of shares in following ratio.
14 shares of Aakaaish for 143 shares of Prayas Engineering (Promoter).
3 shares of Aakaaish for 19 shares of EMTICI Engineering (Promoter).
Post the scheme of arrangement, Elecon EPC Projects became a 60.48% subsidiary
with the balance share held by the Promoters.
The second leg of the restructuring involved transfer of the GEAR business of its
group companies Prayas and EMTICI to EECL by the latter allotting shares in the
following ratio.
49 shares of EECL (FV `2/-) for 4 shares of Prayas Engineering (Promoter).
39 shares of EECL (FV `2/-) for 4 shares of EMTICI Engineering (Promoter).
EECL allotted 1,60,74,333 equity shares to the Shareholders of these two group
companies, thereby increasing its paid up share capital to 10,89,35,843 equity
shares of `2 each. As a result, the share holding of the promoter group increased
from 46% to 58%.
Post restructuring format is as follows -
Standalone Business - The Power Transmission business of EECL, is the largest
gear manufacturing company in Asia. Its market share currently stands at ~30%
with customer presence across India and countries like Australia, Africa, South East
Asia, Middle East, and Europe. As on FY2014, the standalone revenues accounted
for ~39% of its overall sales.
Elecon EPC Projects Ltd - Elecon EPC Projects became a 60.48% subsidiary of
the company with the balance held by the Promoter family. It was formed to
manage the core MHE business of the company and today it is the third largest
MHE company in India with products and solutions for various industrial sectors in
India. Its FY2014 revenues accounted for ~39% of EECL’s overall sales.
March 19, 2015
9
Initiating coverage | Elecon Engineering
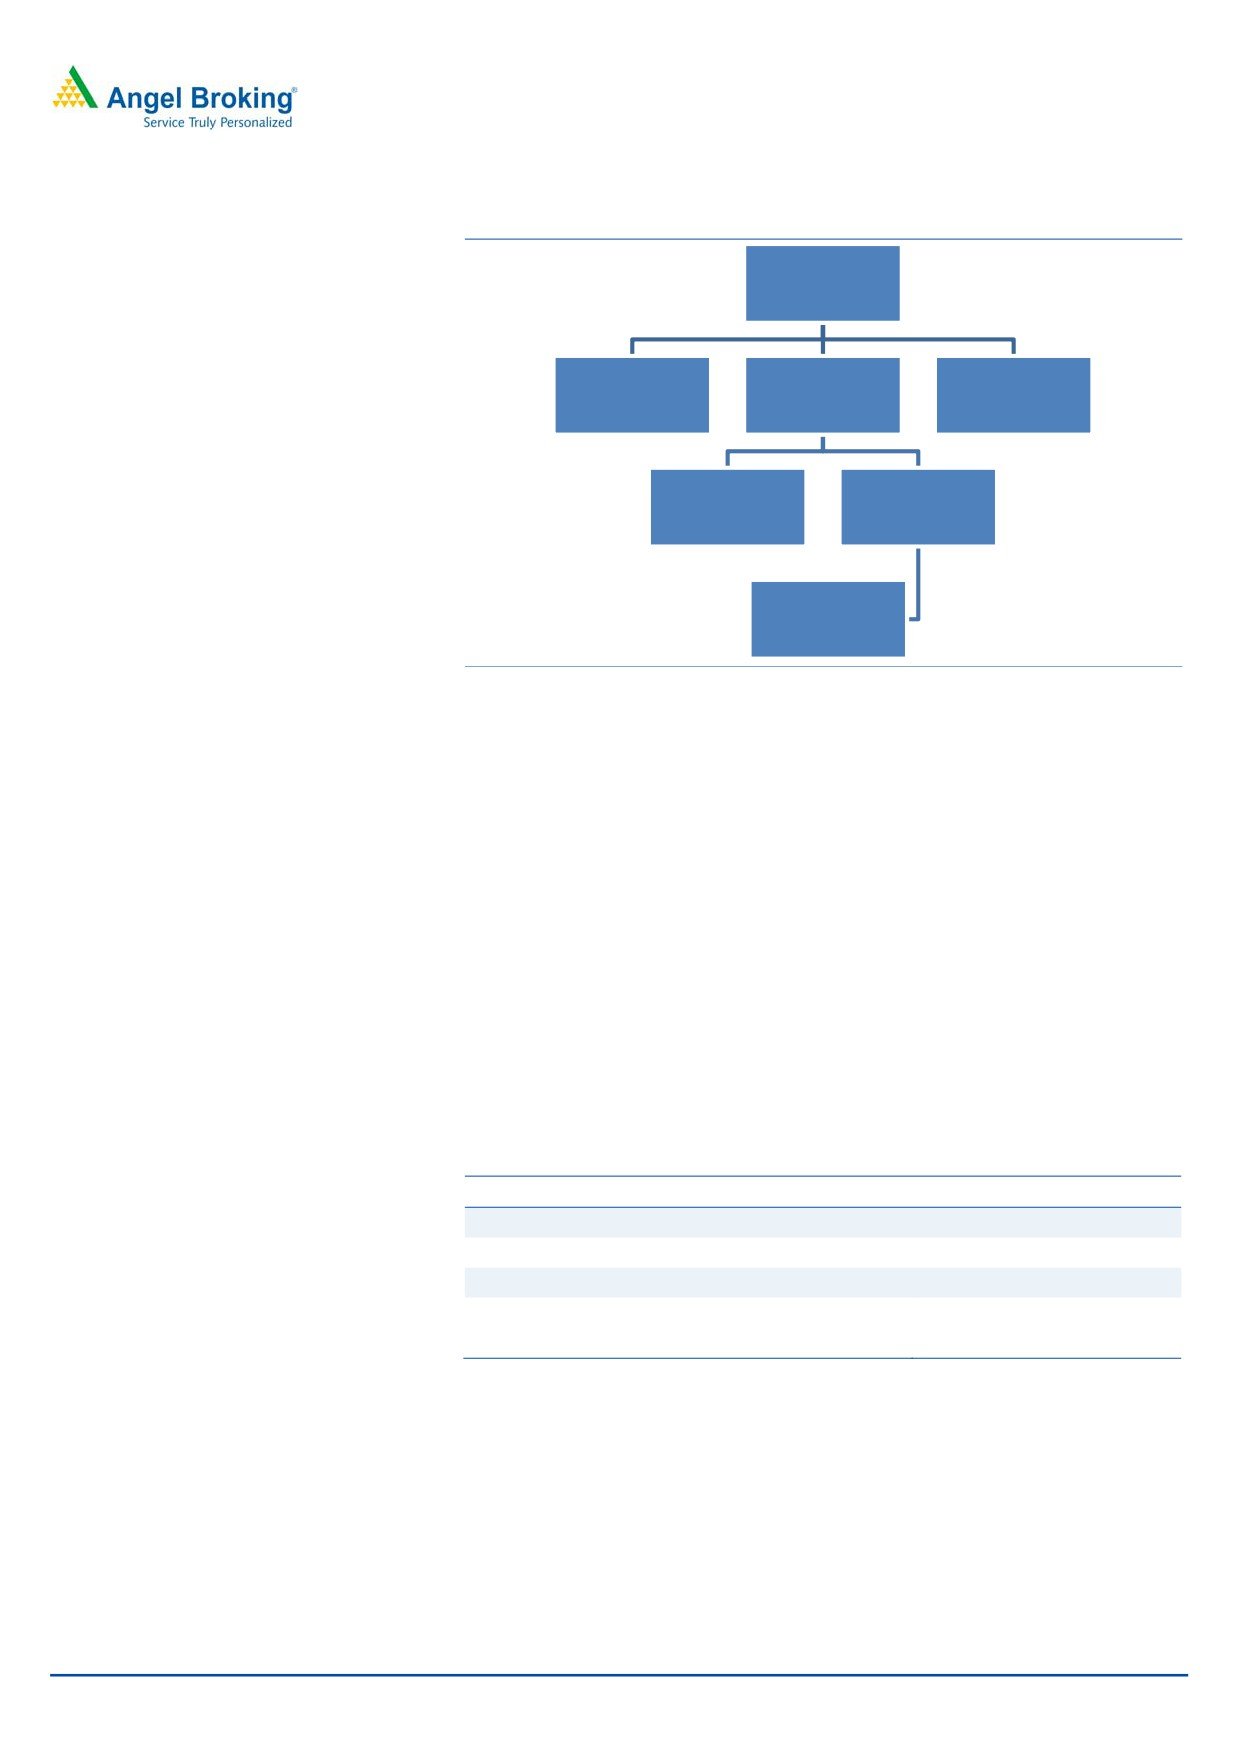
Exhibit 15: Business Structure
Elecon Engineering
Co. Ltd
Elecon Transmission
Elecon EPC Projects
Standalone (PTE)
Inernational Ltd (PTE)
(MHE)
100%
60.48%
AB Benzlers
Radicon UK
Radicon US
Source: Company, Angel Research
Benzler-Radicon Group - EECL acquired Benzler-Radicon in October 2010
from the UK based engineering company David Brown. Benzler-Radicon have over
60 years of experience and have a reputation for being market leaders in the
design and manufacture of screw jacks, shaft mounted gearboxes and industrial
reducers.
The main motive behind the restructuring was to create separate entities and to
enhance operational efficiency of the businesses by consolidating the MHE and PTE
businesses domestically. Both Prayas and EMTICI manufactured equipments and
parts for the both the PTE as well as the MHE business. The business was relatively
small in nature mainly comprising of smaller job work.
Products
Its Power Transmission division involves design and manufacturing of the
following:
Power Transmission Solutions
Helical and Bevel Helical Gear boxes
Wind Mill Gear boxes
Planetary Gear boxes
Elevator Traction
Worm Gear boxes
Marine Gear boxes
Geared & Flexible Couplings
Loose Gear boxes
High Speed Gear boxes
Special Gear boxes
Its product range in the MHE segment includes design, engineering, manufacture,
supply, erection and commissioning of the following -
March 19, 2015
10
Initiating coverage | Elecon Engineering
Material Handling Equipment
Wagon tipplers
Wagon tipplers
Bucket wheel stacker/reclaimers
Bucket wheel stacker/reclaimers
Barrel-type blender reclaimers
Barrel-type blender reclaimers
Fertilizer reclaiming scrapers
Fertilizer reclaiming scrapers
Limestone pre-homegenizing and blending
Limestone pre-homegenizing and blending
plants
plants
Single and twin bucket wheel bridge-type
Single and twin bucket wheel bridge-type
reclaimers
reclaimers
March 19, 2015
11
Initiating coverage | Elecon Engineering
Profit and loss statement (Consolidated)
Y/E March (` cr)
FY2013
FY2014
FY2015E
FY2016E
FY2017E
Total operating income
1,527
1,293
1,241
1,372
1,521
% chg
(5.4)
(15.3)
(4.0)
10.5
10.9
Net Raw Materials
807
624
584
645
693
% chg
(14.1)
(22.6)
(6.5)
10.5
7.4
Mfg. Exp. & Erection Charges
131
142
112
123
137
% chg
35.9
8.4
(21.1)
10.5
10.9
Personnel
185
174
181
197
216
% chg
27.9
(5.8)
4.0
9.0
9.5
Other
196
203
211
230
252
% chg
(12.4)
3.6
4.0
9.0
9.5
Total Expenditure
1,319
1,143
1,088
1,197
1,299
EBITDA
208
150
153
175
222
% chg
(0.2)
(28.1)
2.2
14.4
27.1
(% of Net Sales)
13.6
11.6
12.3
12.8
14.6
Depreciation& Amortisation
57
62
63
64
65
EBIT
151
88
90
111
157
% chg
(5.6)
(41.7)
2.2
23.1
41.6
(% of Net Sales)
9.9
6.8
7.3
8.1
10.3
Interest & other Charges
82
74
60
57
53
Other Income
7
15
7
8
9
(% of Net Sales)
0.5
1.2
0.6
0.6
0.6
Recurring PBT
69
14
30
54
104
% chg
(25.9)
(79.8)
114.6
78.3
92.8
Exceptional items
(27)
-
-
-
-
PBT (reported)
50
29
37
62
112
Tax
21
15
11
19
34
(% of PBT)
41.4
51.4
30.0
30.0
30.0
PAT (reported)
29
14
26
43
79
Minority Interest (after tax)
12
1
6
10
13
Profit/Loss of Associate Company
0
0
0
0
0
Net Profit after Minority Int.
18
14
20
34
66
& P/L Asso.Co.
Extraordinary Expense/(Inc.)
(14)
0
-
-
-
ADJ. PAT
32
14
20
34
66
% chg
(46.0)
(58.0)
49.6
66.0
94.5
(% of Net Sales)
2.1
1.1
1.6
2.5
4.3
Basic EPS (`)
3.5
1.2
1.9
3.1
6.0
Fully Diluted EPS (`)
3.5
1.2
1.9
3.1
6.0
% chg
(46.0)
(64.2)
49.6
66.0
94.5
Dividend
11
11
11
13
20
Retained Earning
16
2
14
29
57
March 19, 2015
12
Initiating coverage | Elecon Engineering
Balance sheet (Consolidated)
Y/E March (` cr)
FY2013
FY2014
FY2015E
FY2016E
FY2017E
SOURCES OF FUNDS
Equity Share Capital
22
22
22
22
22
Reserves& Surplus
516
510
525
554
611
Shareholders’ Funds
538
532
546
575
633
Minority Interest
34
35
35
35
35
Total Loans
697
633
545
534
523
Other Long Term Liabilities
128
139
139
139
139
Long Term Provisions
5
3
3
3
3
Deferred Tax Liability
44
43
43
43
43
Total Liabilities
1,446
1,386
1,311
1,330
1,376
APPLICATION OF FUNDS
Gross Block
904
908
928
946
965
Less: Acc. Depreciation
360
400
463
527
593
Less: Impairment
-
-
-
-
-
Net Block
544
508
465
419
372
Capital Work-in-Progress
10
7
11
11
11
Lease adjustment
-
-
-
-
-
Goodwill
81
87
85
83
81
Investments
13
14
14
14
14
Long Term Loans and advances
11
19
19
19
19
Other Non-current asset
39
65
65
65
65
Current Assets
1,425
1,357
1,246
1,371
1,522
Cash
32
22
31
60
79
Loans & Advances
155
115
110
122
135
Inventory
393
358
347
354
383
Debtors
838
853
748
827
917
Other current assets
8
9
9
9
9
Current liabilities
679
675
596
656
712
Net Current Assets
746
682
649
715
811
Misc. Exp. not written off
-
-
-
-
-
Deferred Tax Assets
3
3
3
3
3
Total Assets
1,446
1,386
1,311
1,330
1,376
March 19, 2015
13
Initiating coverage | Elecon Engineering
Cash flow statement (Consolidated)
Y/E March (` cr)
FY2013
FY2014
FY2015E FY2016E FY2017E
Profit before tax
50
29
37
62
112
Depreciation
57
62
63
64
65
Change in Working Capital
(171)
55
42
(37)
(77)
Direct taxes paid
(21)
(15)
(11)
(19)
(34)
Others
260
29
(7)
(8)
(9)
Cash Flow from Operations
176
160
124
62
58
(Inc.)/Dec. in Fixed Assets
(120)
(1)
(21)
(17)
(16)
(Inc.)/Dec. in Investments
1
(2)
-
-
-
(Incr)/Decr In LT loans & adv.
32
(34)
-
-
-
Others
(11)
7
7
8
9
Cash Flow from Investing
(98)
(30)
(14)
(9)
(8)
Issue of Equity
3
-
-
-
-
Inc./(Dec.) in loans
32
(64)
(89)
(11)
(11)
Dividend Paid (Incl. Tax)
(14)
(12)
(12)
(14)
(21)
Others
(87)
(64)
-
-
-
Cash Flow from Financing
(65)
(140)
(101)
(25)
(32)
Inc./(Dec.) in Cash
13
(9)
9
28
19
Opening Cash balances
19
32
22
31
60
Closing Cash balances
32
22
31
60
79
March 19, 2015
14
Initiating coverage | Elecon Engineering
Key ratios (Consolidated)
Y/E March
FY2013
FY2014
FY2015E
FY2016E
FY2017E
Valuation Ratio (x)
P/E (on FDEPS)
23.0
54.8
36.6
22.1
11.3
P/CEPS
8.3
9.9
8.9
7.6
5.7
P/BV
1.4
1.4
1.4
1.3
1.2
EV/Net sales
0.9
1.0
1.0
0.9
0.7
EV/EBITDA
6.5
8.7
7.9
6.7
5.1
EV / Total Assets
0.9
0.9
0.9
0.9
0.8
Per Share Data (`)
EPS (Basic)
3.5
1.2
1.9
3.1
6.0
EPS (fully diluted)
3.5
1.2
0.0
0.1
0.1
Cash EPS
9.6
6.9
7.6
9.0
12.0
DPS
1.2
1.0
1.0
1.2
1.8
Book Value
57.9
48.8
50.2
52.8
58.1
DuPont Analysis
EBIT margin
9.9
6.8
7.3
8.1
10.3
Tax retention ratio
0.6
0.5
0.7
0.7
0.7
Asset turnover (x)
1.3
1.0
1.0
1.2
1.3
ROIC (Post-tax)
7.4
3.3
5.2
6.7
9.3
Cost of Debt (Post Tax)
7.0
5.4
7.1
7.4
7.1
Leverage (x)
1.2
1.1
0.9
0.8
0.7
Operating ROE
7.9
1.0
3.4
6.1
10.9
Returns (%)
ROCE (Pre-tax)
11.3
6.2
6.7
8.4
11.6
Angel ROIC (Pre-tax)
12.7
6.9
7.4
9.5
13.3
ROE
6.5
2.5
3.8
6.0
10.9
Turnover ratios (x)
Asset TO (Gross Block)
1.8
1.4
1.4
1.5
1.6
Inventory / Net sales (days)
90
106
104
93
88
Receivables (days)
194
239
220
220
220
Payables (days)
189
216
200
200
200
WC cycle (ex-cash) (days)
150
194
188
169
166
Solvency ratios (x)
Net debt to equity
1.2
1.1
0.9
0.8
0.7
Net debt to EBITDA
3.1
4.0
3.3
2.6
1.9
Int. Coverage (EBIT/ Int.)
1.9
1.2
1.5
1.9
2.9
March 19, 2015
15
Initiating coverage | Elecon Engineering
Research Team Tel: 022 - 39357800
DISCLAIMER
Angel Broking Private Limited (hereinafter referred to as “Angel”) is a registered Member of National Stock Exchange of India Limited,
Bombay Stock Exchange Limited and MCX Stock Exchange Limited. It is also registered as a Depository Participant with CDSL and
Portfolio Manager with SEBI. It also has registration with AMFI as a Mutual Fund Distributor. Angel has received in-principal approval
from SEBI for registering as a Research Entity in terms of SEBI (Research Analyst) Regulations, 2014. Angel or its associates has not
been debarred/ suspended by SEBI or any other regulatory authority for accessing /dealing in securities Market. Angel or its associates
including its relatives/analyst do not hold any financial interest/beneficial ownership of more than 1% in the company covered by
Analyst. Angel or its associates/analyst has not received any compensation / managed or co-managed public offering of securities of
the company covered by Analyst during the past twelve months. Angel/analyst has not served as an officer, director or employee of
company covered by Analyst and has not been engaged in market making activity of the company covered by Analyst.
This document is solely for the personal information of the recipient, and must not be singularly used as the basis of any investment
decision. Nothing in this document should be construed as investment or financial advice. Each recipient of this document should
make such investigations as they deem necessary to arrive at an independent evaluation of an investment in the securities of the
companies referred to in this document (including the merits and risks involved), and should consult their own advisors to determine
the merits and risks of such an investment.
Reports based on technical and derivative analysis center on studying charts of a stock's price movement, outstanding positions and
trading volume, as opposed to focusing on a company's fundamentals and, as such, may not match with a report on a company's
fundamentals.
The information in this document has been printed on the basis of publicly available information, internal data and other reliable
sources believed to be true, but we do not represent that it is accurate or complete and it should not be relied on as such, as this
document is for general guidance only. Angel Broking Pvt. Limited or any of its affiliates/ group companies shall not be in any way
responsible for any loss or damage that may arise to any person from any inadvertent error in the information contained in this report.
Angel Broking Pvt. Limited has not independently verified all the information contained within this document. Accordingly, we cannot
testify, nor make any representation or warranty, express or implied, to the accuracy, contents or data contained within this document.
While Angel Broking Pvt. Limited endeavors to update on a reasonable basis the information discussed in this material, there may be
regulatory, compliance, or other reasons that prevent us from doing so.
This document is being supplied to you solely for your information, and its contents, information or data may not be reproduced,
redistributed or passed on, directly or indirectly.
Neither Angel Broking Pvt. Limited, nor its directors, employees or affiliates shall be liable for any loss or damage that may arise from
or in connection with the use of this information.
Note: Please refer to the important `Stock Holding Disclosure' report on the Angel website (Research Section). Also, please refer to the
latest update on respective stocks for the disclosure status in respect of those stocks. Angel Broking Pvt. Limited and its affiliates may
have investment positions in the stocks recommended in this report.
Disclosure of Interest Statement
Elecon Engineering
1. Analyst ownership of the stock
No
2. Angel and its Group companies ownership of the stock
No
3. Angel and its Group companies' Directors ownership of the stock
No
4. Broking relationship with company covered
No
Note: We have not considered any Exposure below ` 1 lakh for Angel, its Group companies and Directors
Ratings (Based on expected returns
Buy (> 15%)
Accumulate (5% to 15%)
Neutral (-5 to 5%)
over 12 months investment period):
Reduce (-5% to -15%)
Sell (< -15
March 19, 2015
16