2QFY2016 Result Update | Capital Goods
5 November 2015
Elecon Engineering Company
ACCUMULATE
CMP
`79
Performance Highlights
Target Price
`85
Standalone
Investment Period
12 Months
Y/E March (` cr)
2QFY2016
2QFY2015
% chg (yoy) 1QFY2016
% chg (qoq)
Net Sales
111
118
(5.5)
98
14.1
Stock Info
EBITDA
28
19
44.4
23
20.8
Sector
Capital Goods
EBIDTA margin(%)
24.9
16.3
859bp
23.5
137bp
Market Cap (` cr)
859
Adjusted PAT
7
3
158.9
4
93.8
Beta
1.5
Source: Company, Angel Research
52 Week High / Low
97/45
For 2QFY2016, Elecon Engineering Company (Elecon) reported standalone
Avg. Daily Volume
2,79,321
numbers broadly below our estimates, except at the operating level. The top-line
Face Value (`)
2
for the quarter declined by
5.5% yoy to
`111cr. However, the operating
BSE Sensex
26,553
performance improved significantly, led by a 1,516bp yoy decline in raw material
Nifty
8,040
cost to 43.9% of sales. Although, this benefit was partially offset by a 394bp yoy
Reuters Code
ELCN.BO
and 236bp yoy increase in employee and other expenses to 12.4% and 18.9% of
Bloomberg Code
ELCN@IN
sales, respectively; overall, the EBITDA margin expanded by 859bp yoy to 24.9%.
Led by the favorable operating performance, the standalone net profit increased
by 158.9% yoy to `7cr.
Shareholding Pattern (%)
Recovery in capex taking longer than expected, long term prospects intact: The
Promoters
57.3
Material Handling Equipment (MHE) business of the company continued to
MF / Banks / Indian Fls
5.2
remain under pressure on account of delay in capex in core sectors and due to
FII / NRIs / OCBs
1.3
slower execution at the customer level. On the other hand, the Power
Transmission Equipment (PTE) business, which had been holding its ground, has
Indian Public / Others
36.1
now been facing some pressure (in 1HFY2016). However, the margins have
improved considerably, which is a positive sign for the business. Although the
recovery in capex in core sectors has been slower than expected, the long term
Abs. (%)
3m 1yr
3yr
prospects for the MHE business remain intact. Additionally, the underperforming
Sensex
(5.4)
(4.9)
41.5
European subsidiary has now turned profitable post restructuring and reported a
Elecon Engg
(11.3)
47.4
55.3
PAT of `6cr for 1HFY2016.
Outlook and Valuation: We expect Elecon’s consolidated revenues to post a
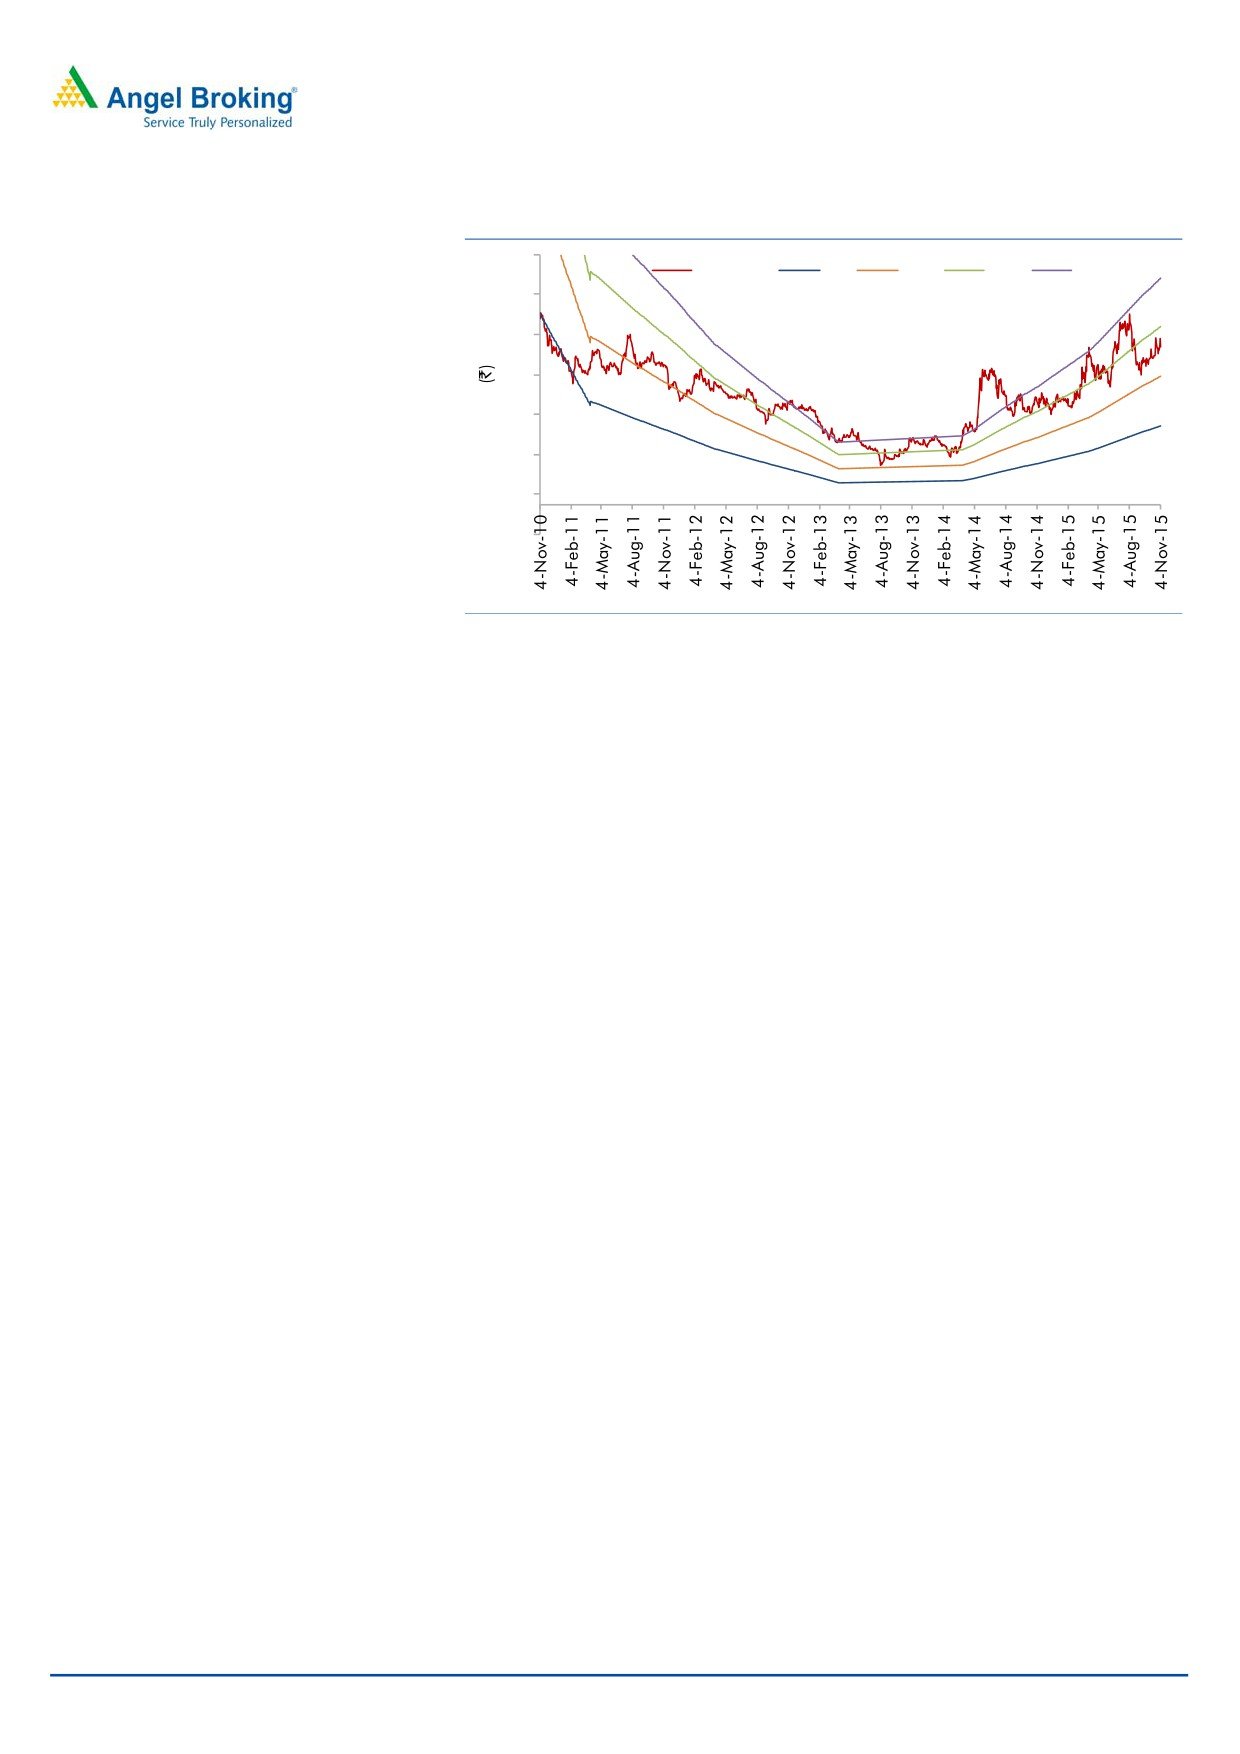
3-year daily price chart
CAGR of 7.4% over FY2105E-17E to `1,533cr. Recovery in the MHE business’
100
margins will result in EBITDA margins expanding by 214bp over FY2015E-17E to
90
14.9%. Consequently, the net profit is expected to improve to `66cr in FY2017E.
80
70
At the current market price, the stock is trading at 13.0x its FY2017E earnings.
60
We believe that these valuations are attractive considering its 5-year and 3-year
50
40
median P/E of 18.7x and 20.7x, respectively. We have an Accumulate rating on the
30
stock with a revised target price of `85 based on a target PE of 14.0x for FY2017E.
20
10
Key Financials (Consolidated)
0
Y/E March (` cr)
FY2014
FY2015 FY2016E
FY2017E
Net Sales
1,293
1,329
1,369
1,533
% chg
(15.3)
2.8
3.0
12.0
Source: Company, Angel Research
Adj. Net Profit
15
16
36
66
% chg
(54.1)
9.8
121.3
82.5
EBITDA (%)
11.7
12.8
13.7
14.9
EPS (`)
1.4
1.5
3.3
6.1
P/E (x)
57.7
52.5
23.7
13.0
P/BV (x)
1.6
1.6
1.5
1.4
RoE (%)
2.8
3.1
6.6
11.4
RoCE (%)
6.3
7.4
9.4
12.3
Milan Desai
EV/Sales (x)
1.2
1.1
1.0
0.9
022 4000 3600 ext- 6846
EV/EBITDA (x)
9.9
8.2
7.2
5.9
Source: Company, Angel Research; Note: CMP as of March 18, 2015
Please refer to important disclosures at the end of this report
1
Elecon Engineering | 2QFY2016 Result Update
Exhibit 1: 2QFY2016 Standalone performance
Y/E March (` cr)
2QFY16
2QFY15
yoy chg (%)
1QFY16
qoq chg (%)
1HFY16
1HFY15
% chg
Net Sales
111
118
(5.5)
98
14.1
209
214
(2.2)
Net raw material
49
70
(29.7)
47
4.3
96
122
(21.2)
(% of Sales)
43.9
59.0
48.0
45.8
56.9
Staff Costs
14
10
38.7
10
39.5
24
19
25.5
(% of Sales)
12.4
8.4
10.1
11.3
8.8
Other Expenses
21
19
9.9
18
17.2
39
37
6.6
(% of Sales)
18.9
16.2
18.4
18.6
17.1
Total Expenditure
84
99
(15.1)
75
12.1
158
177
(10.5)
Operating Profit
28
19
44.4
23
20.8
51
37
37.6
OPM
24.9
16.3
23.5
24.2
17.2
Interest
9
7
28.9
8
14.1
17
15
16.2
Depreciation
12
11
10.8
12
1.4
23
25
(5.1)
Other Income
3.2
2.4
36.4
2.3
38.9
6
8
(32.0)
PBT
10
4
158.4
6
76.7
16
6
12.6
(% of Sales)
9.1
3.3
5.9
7.6
2.7
Tax
3
1
2
5
2
(% of PBT)
32
32
38
34
32
Reported PAT
7
3
158.9
4
93.8
10
4
167.5
PATM
6.2
2.3
3.7
5.0
1.8
Source: Company, Angel Research
Exhibit 2: Actual vs. Estimate (Standalone 2QFY2016)
Particulars (` cr)
Actual
Estimate
Variation (%)
Total Income
111
145
(22.9)
EBIDTA
28
32
(13.1)
EBIDTA margin (%)
24.9
22.1
282bp
Adjusted PAT
7
10
(27.5)
Source: Company, Angel Research
Top-line below expectation, margins improve yoy
Elecon’s standalone numbers for the quarter have broadly come in below our
estimates. The top-line for the quarter declined by 5.5% yoy to `111cr, as against
our estimate of `145cr. As per the Management, the company’s top-line in the last
couple of quarters has been bearing the impact of subdued infrastructure activity in
the country, although the same is expected to pick up, going forward. However,
the operating performance improved significantly during the quarter led by a
1,516bp yoy decline in raw material cost to 43.9% of sales. Although, this benefit
was partially neutralized by a 394bp yoy and 236bp yoy increase in employee and
other expenses to 12.4% and 18.9% of sales, respectively; overall, the EBITDA
margin expanded by 859bp yoy to 24.9% (as against our estimate of 22.1%). Led
by a favorable operating performance, the standalone net profit increased by
158.9% yoy to `7cr, which although is below our estimate of `10cr.
5 November 2015
2
Elecon Engineering | 2QFY2016 Result Update
Consolidated Division-wise Performance
Exhibit 3: Segment-wise performance (Consolidated)
Y/E March (` cr)
2QFY16 2QFY15 % chg (yoy) 1QFY16 % chg (qoq)
Total Revenue
A) Material Handling Equipment
101
104
(2.6)
89
13.0
B) Transmission Equipment
190
205
(7.8)
179
5.9
C) Others
6
8
(27.4)
4
40.8
Total
296
317
(6.6)
273
8.8
Less: Inter-Segmental Revenue
13
19
15
Net Sales
283
298
(5.1)
257
10.1
Segmental Profit
A) Material Handling Equipment
(6)
(3)
84.8
(2)
162.4
B) Transmission Equipment
25
14
78.6
19
29.2
C) Others
1
1
26.9
0
158.9
Segmental Margin (%)
A) Material Handling Equipment
(6.2)
(3.3)
(294)bp
(2.7)
(354)bp
B) Transmission Equipment
13.1
6.7
631bp
10.7
235bp
C) Others
16.0
9.2
685bp
8.7
730bp
Source: Company, Angel Research
MHE business continues to be under pressure: The MHE business’ revenues
declined by 2.6% yoy to `101cr for 2QFY2016. The segment reported a loss of
`6cr for the quarter against a loss of `3cr in the same quarter of the previous year.
The business is facing a tough time with no uptick in capex in the core sector,
along with slow execution at the customer level.
PTE business’ performance remains stable: The PTE business witnessed a
7.8% yoy decline in revenues to `190cr. The standalone gear business’ top-line
declined by 5.5% to `111cr. Excluding inter-segmental revenues, the Radicon
Benzlers’ top-line is estimated to have declined by `7.9% yoy to `71cr. The PTE
business reported a 78.6% yoy increase in profits to `25cr, mainly due to better
operational performance by the standalone gear business.
5 November 2015
3
Elecon Engineering | 2QFY2016 Result Update
Con-call Takeaways
The Management commentary suggests that the near-term outlook for the
company remains bleak. Things are not moving at the customer level and
there has not been an uptick in capex in the core sector.
Slow execution at the customer level has impacted the MHE business. Clients
are not picking up finished products, which is resulting in lower invoicing.
The company is hopeful of a pick-up in ordering in 2HFY2016 as there is
typically a pick-up in manufacturing activity in the second half of the fiscal. In
the past quarter, the company had been unsuccessful in winning orders as it
bided more conservatively.
The margins of the standalone business have improved on account of higher
contribution from sale of spares, cost cutting measures undertaken, and
redesigning of certain products.
The company’s international subsidiary has turned PAT positive since the past
two quarters. The Management expects the EBITDA margin for the subsidiary
to be at 7-8%.
Tech-Pro situation remains unchanged. Elecon is being approached by end
customers to complete the unfinished jobs left by Tech-Pro. Elecon recovered
~`20cr of retention money in 1HFY2016 and plans to recover ~`60cr for the
year.
The MHE business’ order book as of 2QFY2016-end stood at ~`1,000cr
while Benzlers Group’s order book stood at ~`60cr.
The debt quantum has increased. However, the company has indicated at it
getting normalized, given that the company is in the process of converting
some of its short term debt to long term.
Investment Argument
Capex in core sectors yet to pick up, long term prospects intact
The MHE business of the company has been undergoing a rough phase with
slower execution and lack of uptick in orders on the back of a poor operating
environment. The performance has remained under pressure as pick-up in capex
in core sectors is taking longer than expected. However, the outlook remains intact
for the MHE business on account of imminent improvement in capex in power
mining and port sectors. Further, the declining interest rate scenario should
improve liquidity in the market that has hampered execution at the client level. We
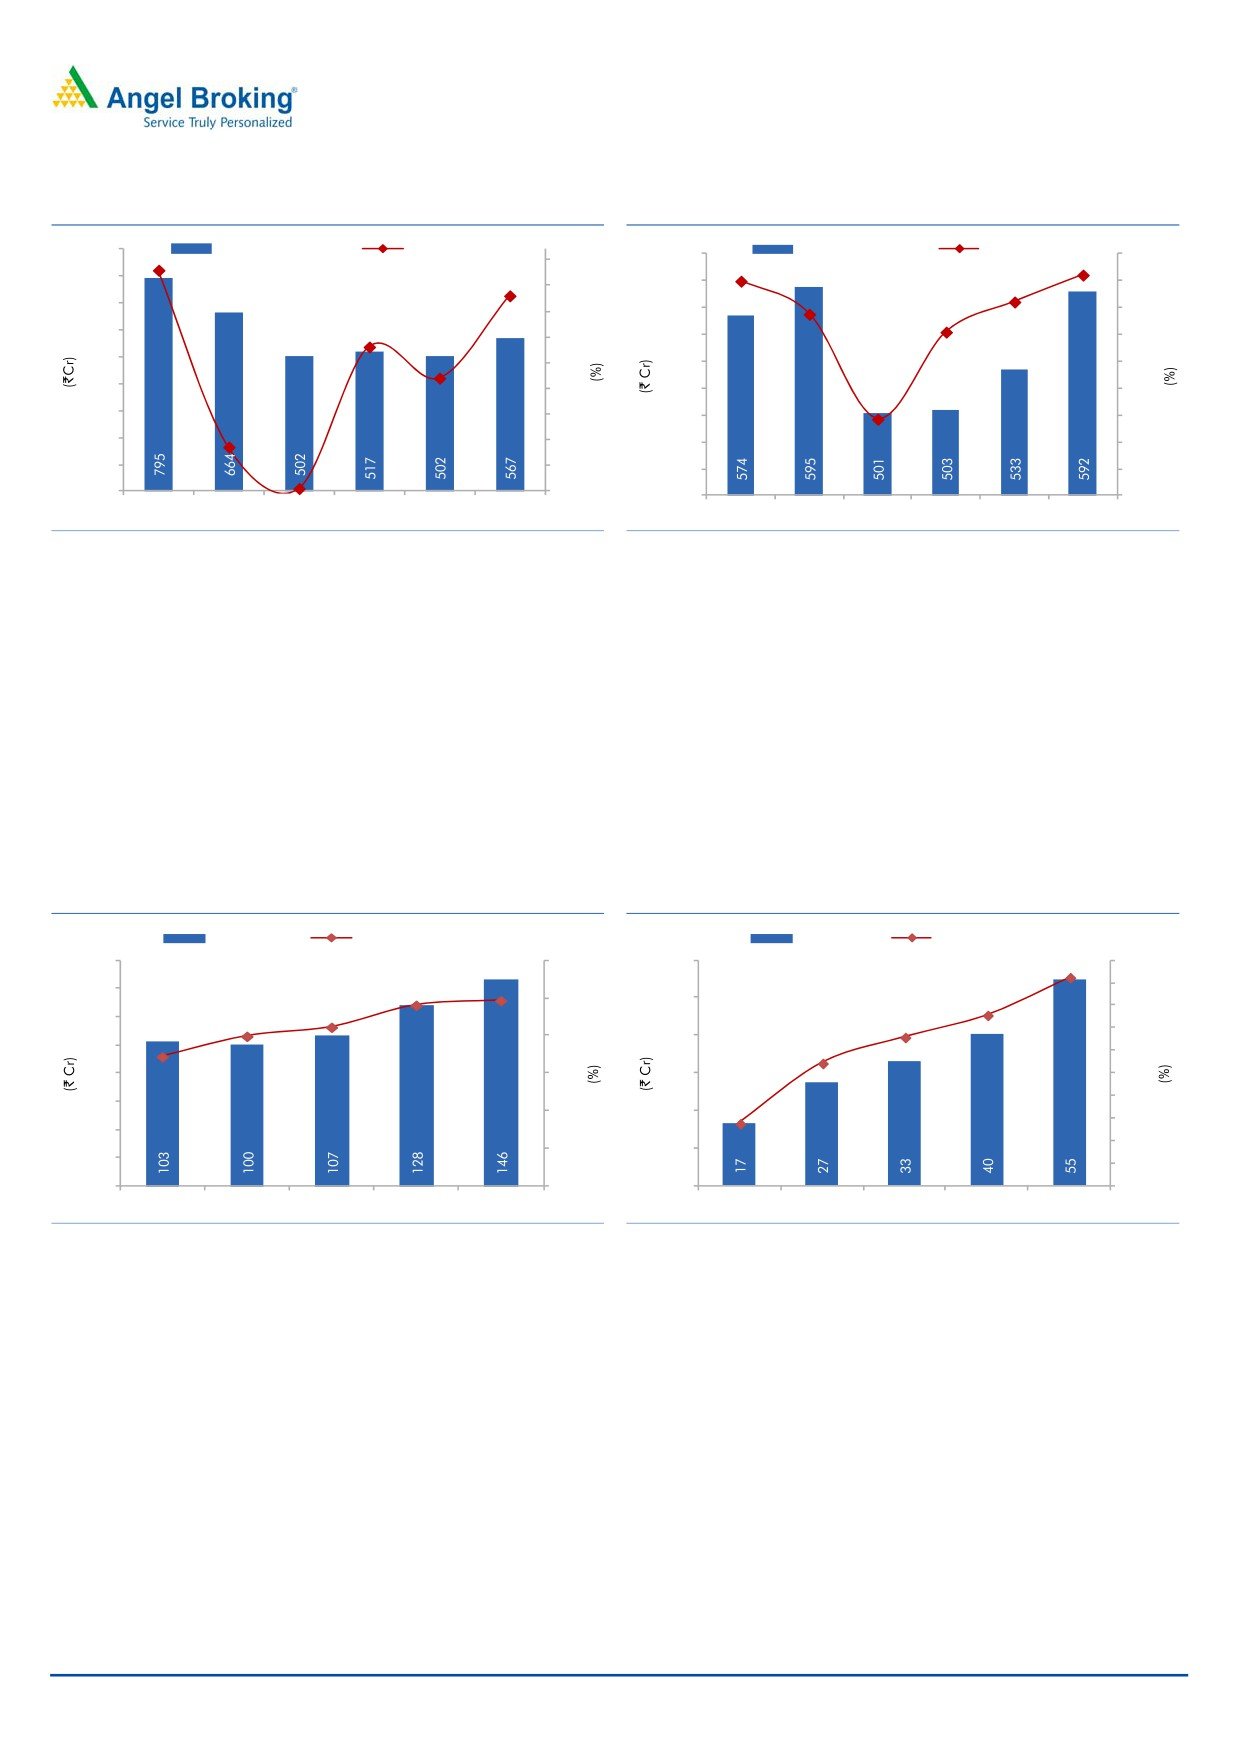
expect the MHE business’ revenue to decline by 3.0% yoy in FY2016E to `502cr
and grow by 13.0% yoy to `567cr_in FY2017E.
5 November 2015
4
Elecon Engineering | 2QFY2016 Result Update
Exhibit 4: MHE Revenue and Growth trend
Exhibit 5: Standalone PTE Revenue and Growth trend
900
MHE Revenue (LHS)
MHE Growth (RHS)
PTE Revenue (LHS)
Growth (RHS)
620
15
20.0
18.0
11.
800
600
0 10
13.0
15.0
9.9
700
580
5
10.0
3.7
6.0
600
560
0.4
-
5.0
3.1
500
-
540
(5)
400
(3.0)
(5.0)
520
(10)
300
(10.0)
500
(15)
(15.8)
200
(15.0)
480
(20)
(16.4)
100
(20.0)
460
(25)
(24.4)
-
(25.0)
440
(30)
FY2012
FY2013
FY2014
FY2015
FY2016E FY2017E
FY2012
FY2013
FY2014
FY2015
FY2016E FY2017E
Source: Company, Angel Research
Source: Company, Angel Research
The standalone PTE business which was holding its ground till now has come
under pressure owing to the above mentioned reasons. However, the operational
efficiency has improved, thus providing support in 1HFY2016. The order book
remains healthy at `258cr, providing revenue visibility. The utilization levels remain
low at 40-45%, which should improve once the capex cycle turns around.
Going forward, we expect the standalone PTE business to post a revenue CAGR of
8.5% over FY2015-17E to `592cr. Owing to operating leverage coming into play,
we expect the EBITDA margin to improve to 24.7% in FY2017E and expect the net
profit to post a CAGR of 28.4% over FY2015-17E to `55cr.
Exhibit 6: Standalone EBITDA & EBITDA Margins
Exhibit 7: Standalone PAT and PAT Margins
EBITDA (LHS)
EBITDA Margins (RHS)
PAT (LHS)
PAT Margins (RHS)
160
30.0
60
10.0
9.2
140
9.0
24.7
25.0
50
8.0
120
24.1
7.6
7.0
20.0
21.2
20.0
40
100
6.6
6.0
17.3
5.4
80
15.0
30
5.0
4.0
60
10.0
20
2.8
3.0
40
2.0
5.0
10
20
1.0
-
-
-
-
FY2013
FY2014
FY2015
FY2016E
FY2017E
FY2013
FY2014
FY2015
FY2016E
FY2017E
Source: Company, Angel Research
Source: Company, Angel Research
Benzlers-Radicon restructuring to have a meaningful impact in
the long run
Elecon is in the process of restructuring its operations in Europe, which is more
likely to be along the lines of shifting of some production to India to develop
higher quality products that meet European standards at a lower cost. The
company will shift a major portion of production to India in the longer run. This
along with other cost cutting measures undertaken by the Management and with a
gradual recovery in Europe, should enable the subsidiary to make a meaningful
contribution to the overall business over the longer term. At present the EBITDA
margin for Benzlers-Radicon is likely to continue to be at 7-8% levels, which
although would improve to ~10% over the longer run. The subsidiary has turned
PAT positive so far in the year, reporting a PAT of ~`6cr in 1HFY2016.
5 November 2015
5
Elecon Engineering | 2QFY2016 Result Update
Consolidated Financials
Exhibit 8: Revenue Assumptions
(` cr)
FY2015
FY2016E
FY2017E
Revenue
Elecon EPC
517
502
567
Elecon Standalone
503
533
592
Radicon Benzlers
352
376
418
Others
33
36
43
Less: Inter Company
76
78
87
Consolidated
1,329
1,369
1,533
Source: Company, Angel Research
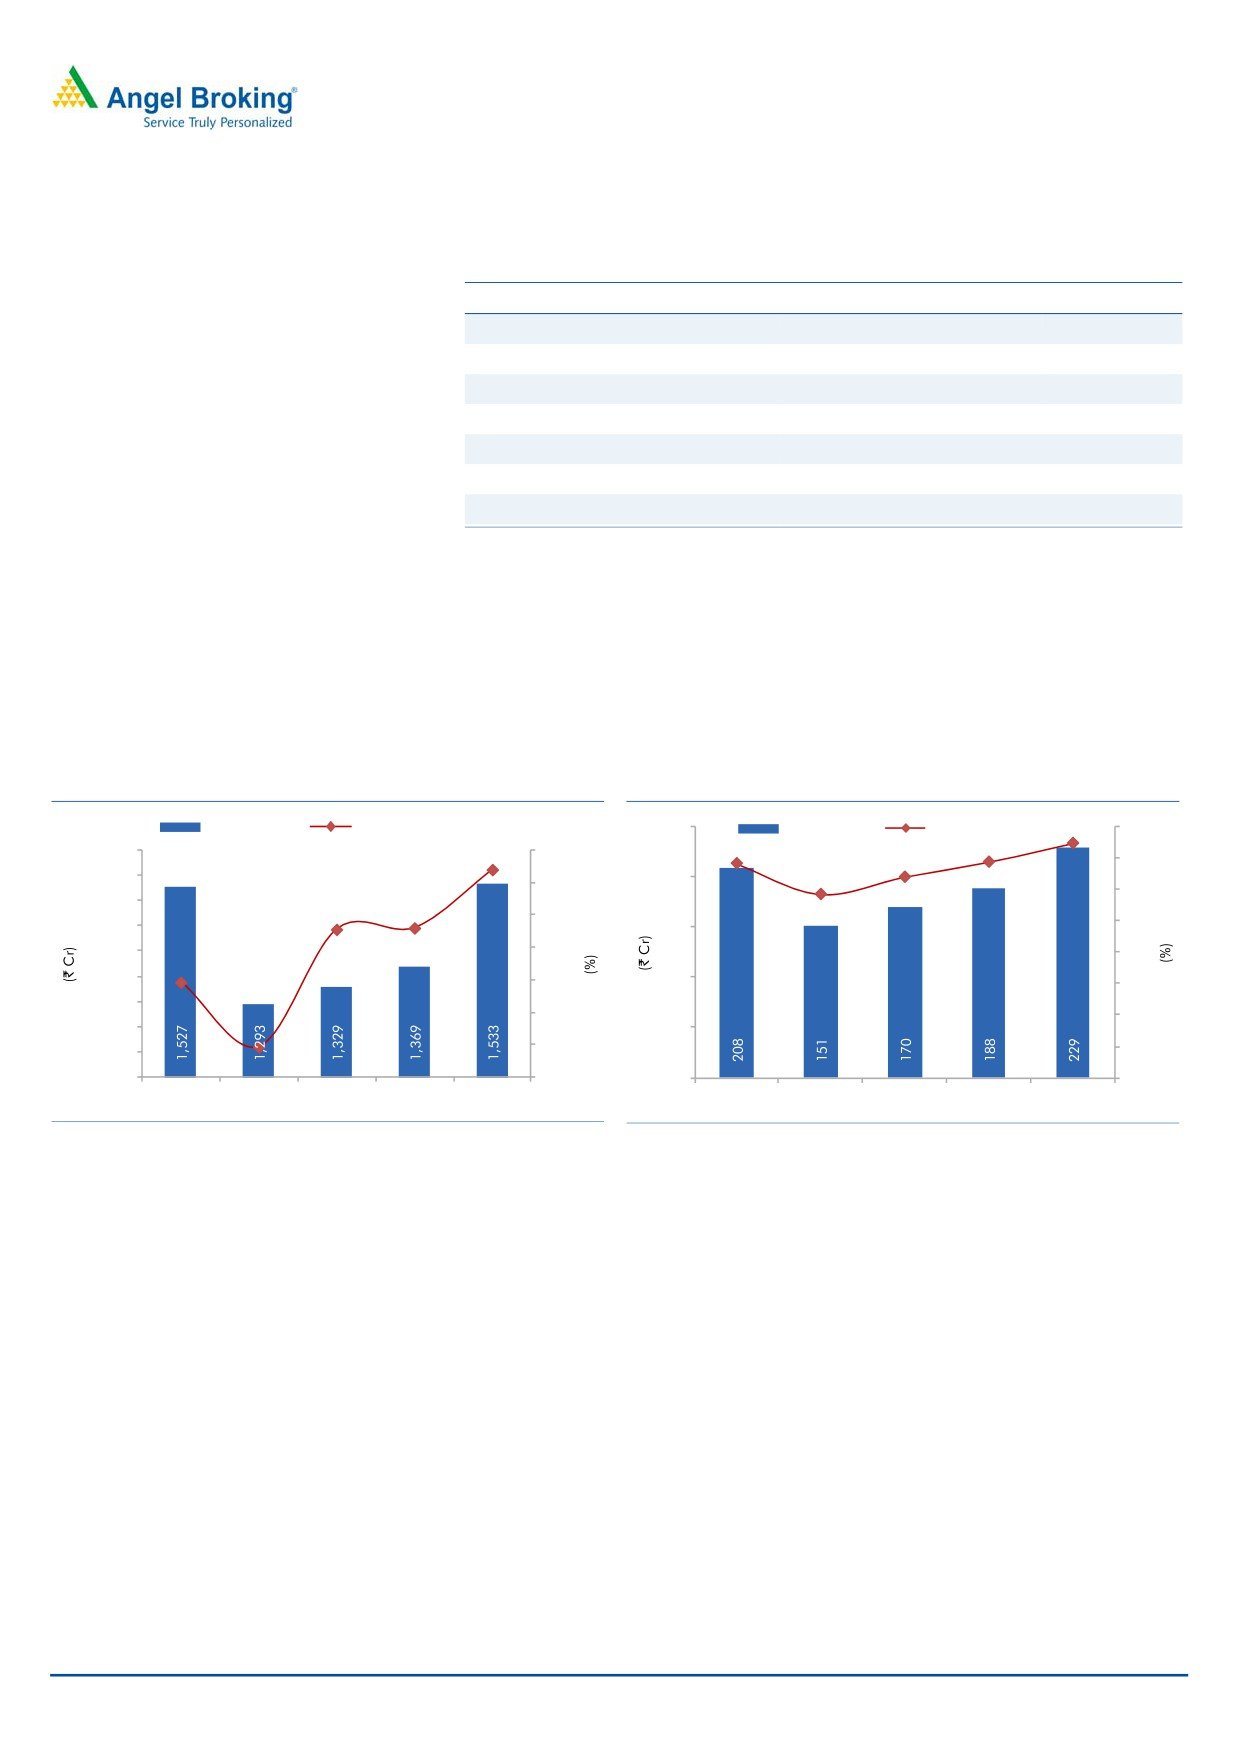
Recovery in capex across industry to improve top-line
We have scaled down our expectations for the company in the near term as the
recovery at the ground level is taking longer than expected. We expect the recovery
to gather steam only after FY2016. We have built in a revenue CAGR of 7.4% over
FY2015-17E to `1,533cr for the company.
Exhibit 9: Revenues to improve on revival in capex
Exhibit 10: EBITDA Margin to witness improvement
Revenue (LHS)
Revenue Growth (RHS)
250
EBITDA (LHS)
EBITDA Margins (RHS)
16.0
14.
9
1,600
15.0
14.0
13.6
12
.0
13.7
1,550
200
10.0
12.8
12.0
1,500
11.7
5.0
1,450
150
10.0
2.8
3.0
1,400
-
8.0
1,350
(5.0)
100
(5.4)
6.0
1,300
(10.0)
4.0
1,250
50
(15.0)
2.0
1,200
(15.3)
1,150
(20.0)
-
-
FY2013
FY2014
FY2015
FY2016E FY2017E
FY2013
FY2014
FY2015
FY2016E
FY2017E
Source: Company, Angel Research
Source: Company, Angel Research
EBITDA margin to expand
We expect the consolidated EBITDA margin to witness a 214bp expansion over
FY2015E-17E to 14.9%, mainly on back of revenue growth, particularly in the
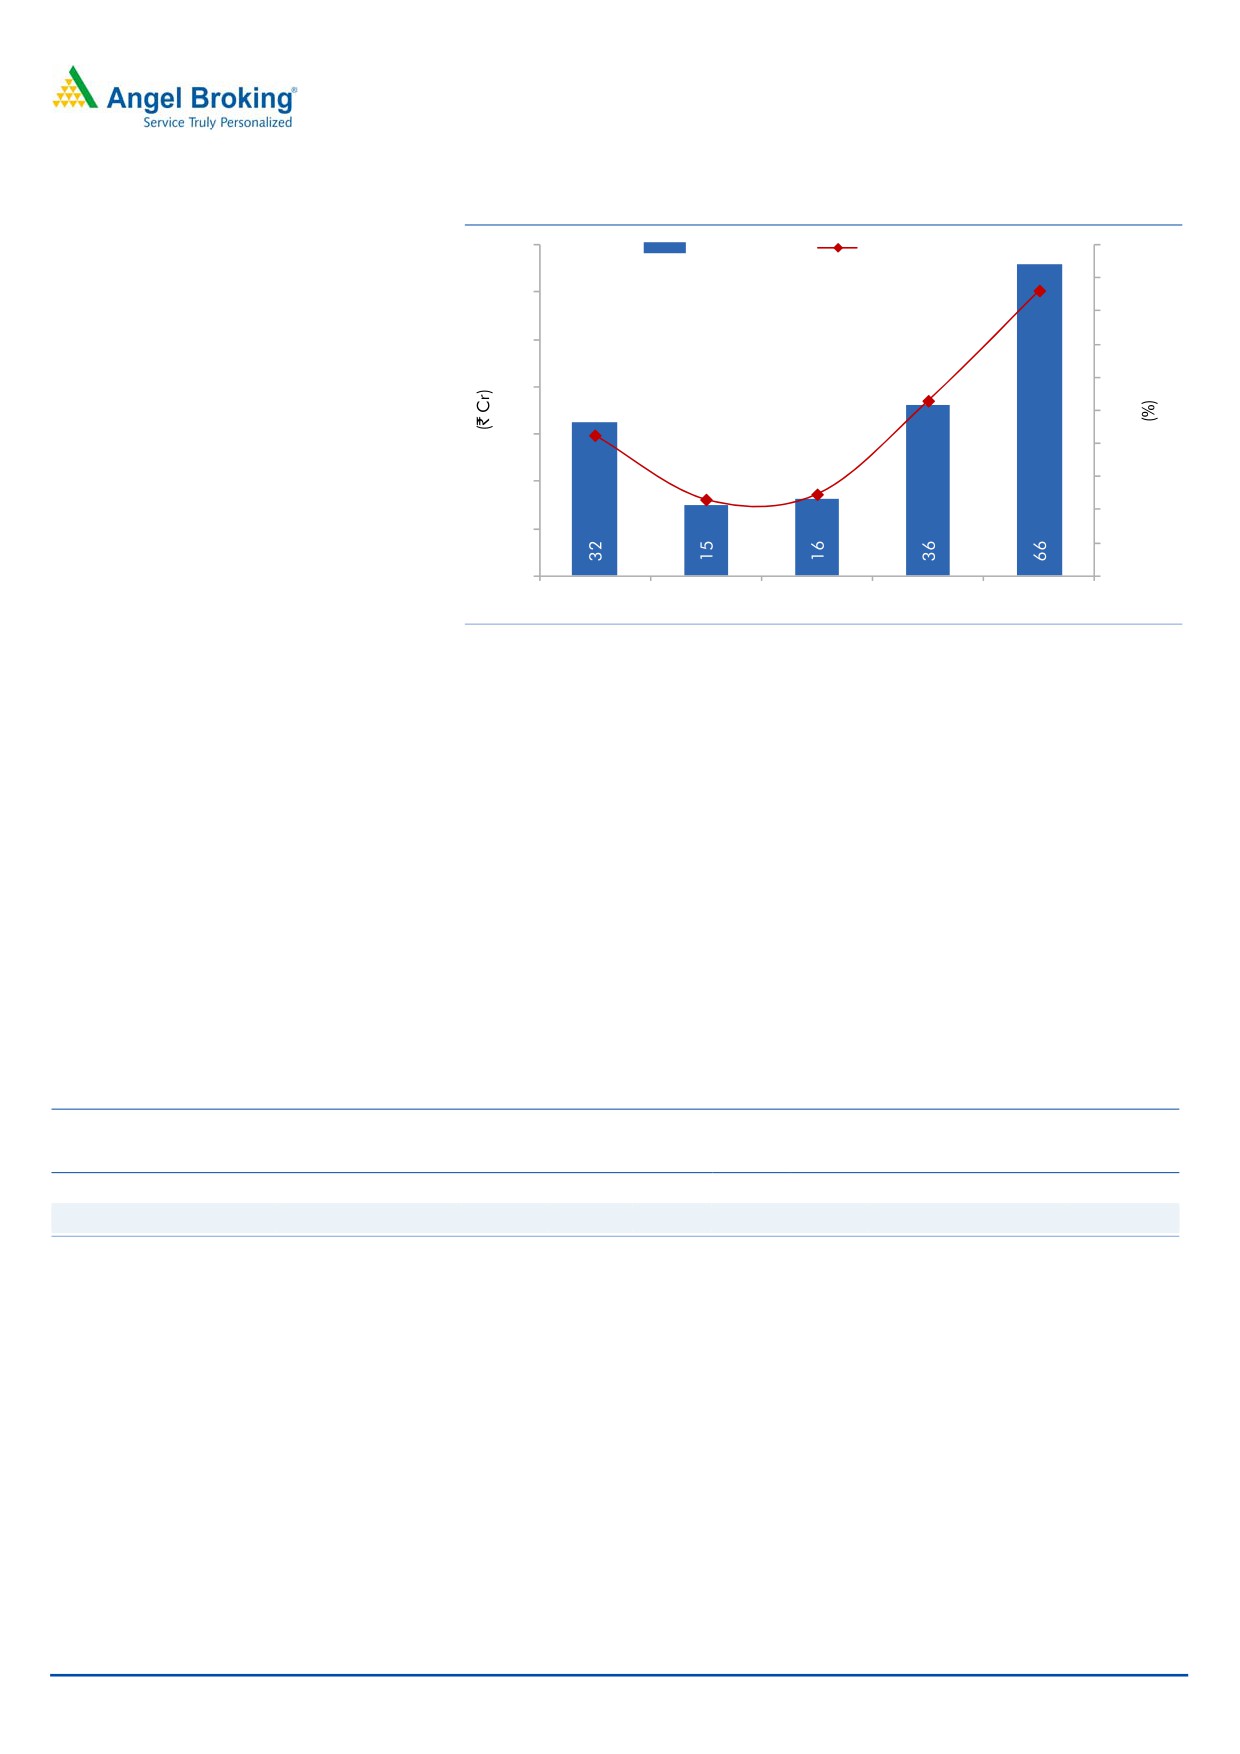
MHE business. Adjusting for minority interest, the company’s net profit is expected
to be at `66cr for FY2017E.
5 November 2015
6
Elecon Engineering | 2QFY2016 Result Update
Exhibit 11: PAT trajectory
70
PAT (LHS)
PAT Margins (RHS)
5.0
4.5
60
4.3
4.0
50
3.5
3.0
40
2.6
2.5
30
2.1
2.0
20
1.5
1.2
1.2
1.0
10
0.5
-
-
FY2013
FY2014
FY2015
FY2016E
FY2017E
Source: Company, Angel Research
Outlook and Valuation
The impending improvement in the economic scenario and the resultant capex is
expected to drive up demand for the MHE business. Also its PTE business stands to
benefit for the same reason. On account of operating environment turning
favorable, we expect Elecon’s consolidated revenue to post a CAGR of 7.4% over
FY2105-17E to `1,533cr. Recovery in the MHE business’ margins will result in the
overall company’s EBITDA margin expanding by 214bp over FY2015-17E to
14.9%. Consequently, the net profit is expected to improve to `66cr in FY2017E.
At the current market price, the stock is trading at 13.0x its FY2017E earnings. We
believe that these valuations are attractive considering its 5-year and 3-year
median P/E of 18.7x and 20.7x. We have an Accumulate rating on the stock with
a revised target price of `85 based on a target PE of 14.0x for FY2017E.
Exhibit 12: Peer Comparison TTM
Company
Mcap
Sales
OPM
PAT
EPS
RoE
P/E
P/BV
EV/BITDA
EV/Sales
(` cr)
(` cr)
(%)
(` cr)
(`)
(%)
(x)
(x)
(x)
(x)
Elecon Engineering*
859
498
24.1
40
3.6
7.6
21.6
1.6
7.9
1.9
Shanthi Gears
852
510
4.9
13
1.6
4.7
65.8
3.1
29.5
1.4
Source: Company, Angel Research; Note: *Standalone numbers
5 November 2015
7
Elecon Engineering | 2QFY2016 Result Update
Exhibit 13: One-year forward P/E band
125
Price (`)
8x
13x
18x
23x
105
85
65
45
25
5
-15
Source: Company, Angel Research
Key Risks
Competition - Competition from other smaller players who bid at lower margins
will have a negative impact on the company’s business growth.
Failure of revival in capex - Both main businesses of Elecon benefit indirectly from
spends on improvement in infrastructure as well as capex in core sectors.
Contraction in capex will have a negative impact on the business.
Higher exposure to Coal Handling - Elecon’s MHE business derives most of its
revenues (60-70%) from the coal handling segment for power projects. Further
delay in allocation of blocks, environmental clearances, land acquisition and other
policy related issues will have a negative impact on the business.
Foreign Exchange - The Benzlers-Radicon group has transferred some lines of
production (accounting for ~30% of subsidiary’s turnover) from Sweden to India. It
plans on scaling it up to ~60-80% in a gradual manner. Any depreciation in the
Euro against the INR will have a negative impact on the margins of the subsidiary.
5 November 2015
8
Elecon Engineering | 2QFY2016 Result Update
Company Background
Established in
1951, Elecon pioneered breakthrough innovations in the
manufacture of MHE and power transmission solutions and is one of the largest
manufacturers of MHE and industrial gears in Asia. Elecon has expanded its skills
and expertise to execute EPC contracts and has transformed into a fully integrated
EPC company executing several projects in India. Elecon’s acquisition of Benzlers -
Radicon from David Brown Gear Systems Group in 2010 adds to the expertise in
manufacturing customized gearboxes for steel mills, high speed turbines, and
satellites for Indian Space Research Program and Naval aircraft carriers.
Structure
During 2012, Elecon restructured its operations by transferring the MHE business
to Aakaaish Projects Ltd (its wholly owned subsidiary. Aakaaish Projects was later
renamed Elecon EPC Projects Ltd. The sale was for a consideration of `127cr.
Additionally, the MHE businesses of its other group companies, Prayas Engineering
Ltd and EMTICI Engineering Ltd were transferred to Elecon EPC Projects in return
for issuance of shares in the following ratio.
14 shares of Aakaaish for 143 shares of Prayas Engineering (Promoter).
3 shares of Aakaaish for 19 shares of EMTICI Engineering (Promoter).
Post the scheme of arrangement, Elecon EPC Projects became a 60.48% subsidiary
with the balance share held by the Promoters.
The second leg of restructuring involved the transfer of the gear business of its
group companies Prayas and EMTICI to Elecon by the latter allotting shares in the
following ratio.
49 shares of EECL (FV `2/-) for 4 shares of Prayas Engineering (Promoter).
39 shares of EECL (FV `2/-) for 4 shares of EMTICI Engineering (Promoter).
Elecon allotted 1,60,74,333 equity shares to the shareholders of these two group
companies, thereby increasing its paid up share capital to 10,89,35,843 equity
shares of `2 each. As a result, the share holding of the promoter group increased
from 46% to 58%.
Post restructuring format is as follows -
Standalone Business
- The PTE business of Elecon is the largest gear
manufacturing company in Asia. Its market share currently stands at ~30% with
customer presence across India and countries like Australia, Africa, South East
Asia, Middle East, and Europe. As on FY2014, the standalone revenues accounted
for ~39% of its overall sales.
Elecon EPC Projects Ltd - Elecon EPC Projects became a 60.48% subsidiary of
the company with the balance held by the Promoter family. It was formed to
manage the core MHE business of the company and today it is the third largest
MHE company in India with products and solutions for various industrial sectors in
India. Its FY2014 revenues accounted for ~39% of Elecon’s overall sales.
5 November 2015
9
Elecon Engineering | 2QFY2016 Result Update
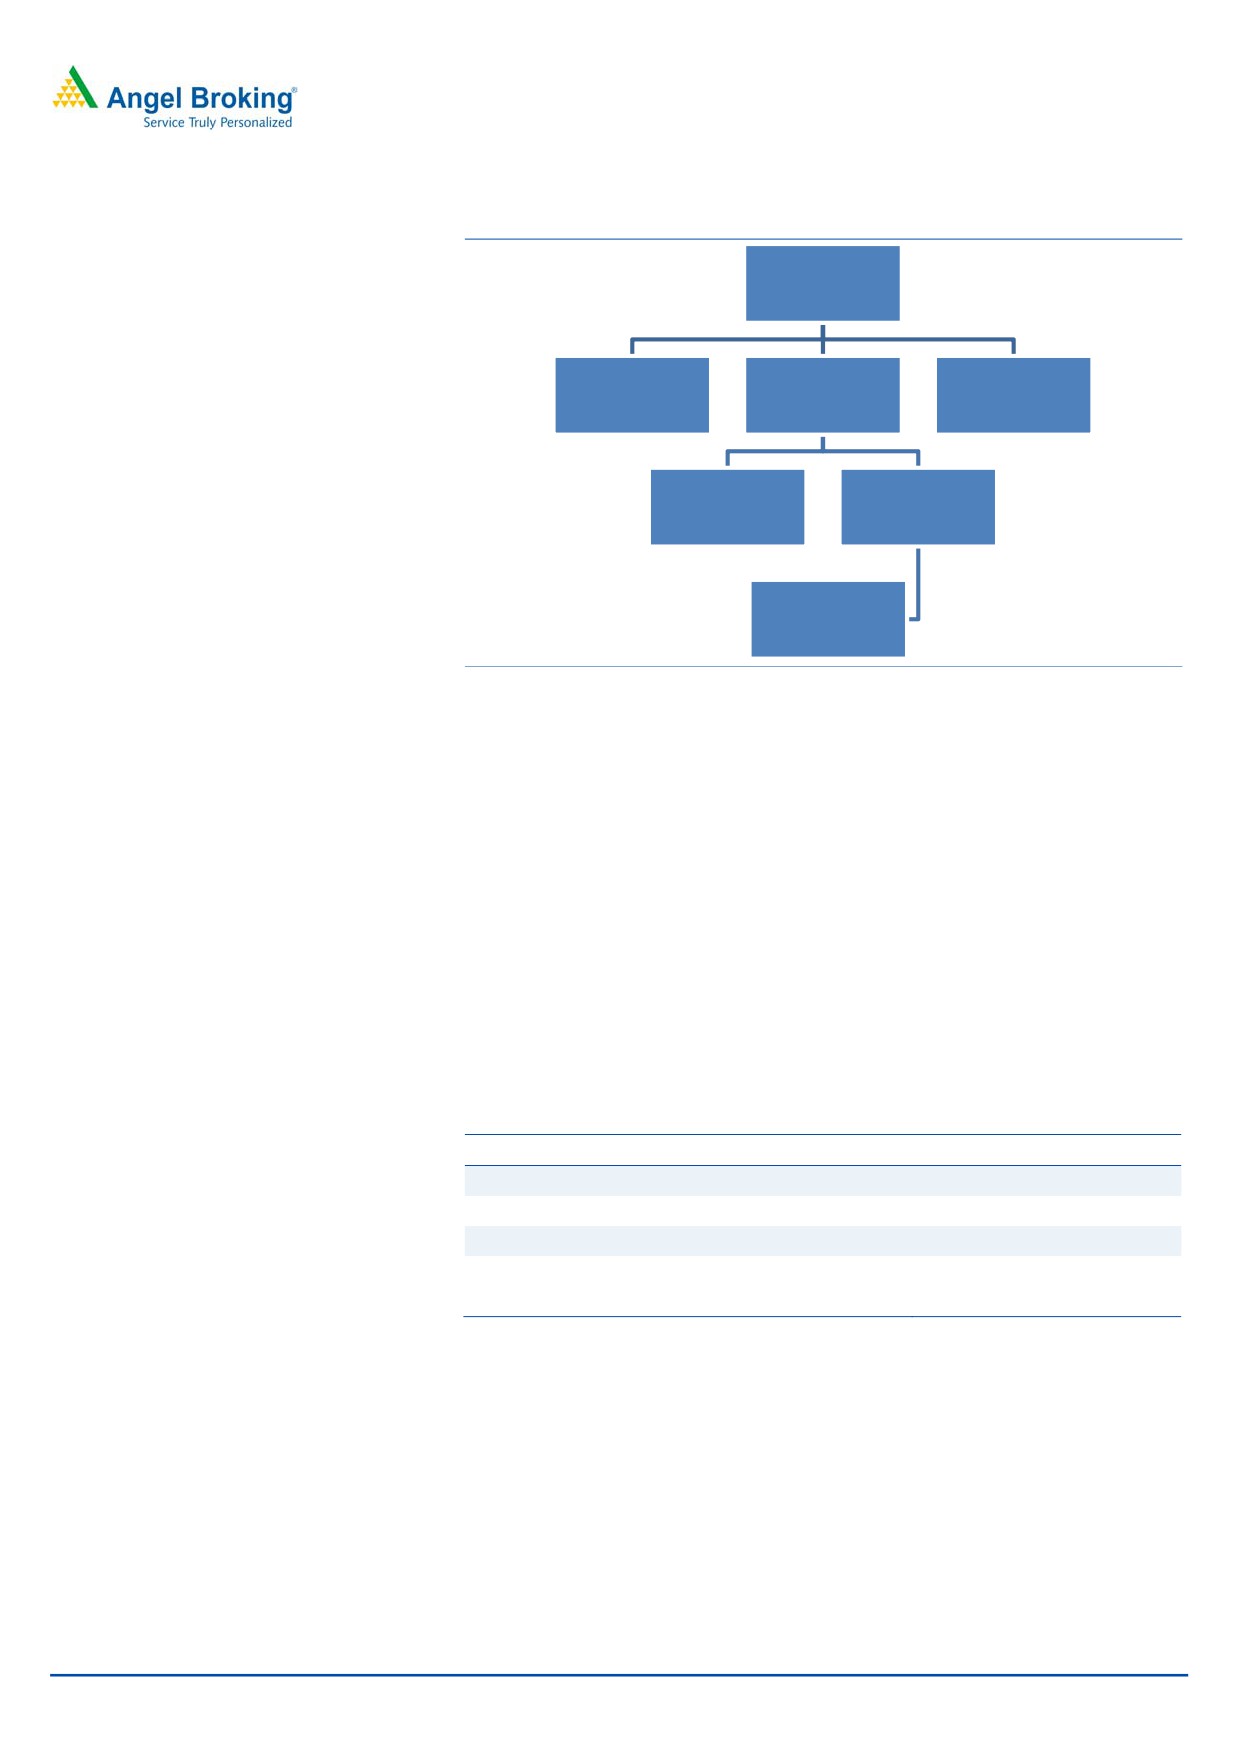
Exhibit 14: Business Structure
Elecon Engineering
Co. Ltd
Elecon Transmission
Elecon EPC Projects
Standalone (PTE)
Inernational Ltd (PTE)
(MHE)
100%
60.48%
AB Benzlers
Radicon UK
Radicon US
Source: Company, Angel Research
Benzler-Radicon Group - Elecon acquired Benzler-Radicon in October 2010 from
the UK based engineering company David Brown. Benzler-Radicon has over 60
years of experience and has a reputation of being a market leader in the design
and manufacture of screw jacks, shaft mounted gearboxes and industrial reducers.
The main motive behind the restructuring was to create separate entities and to
enhance operational efficiency of the businesses by consolidating the MHE and PTE
businesses domestically. Both Prayas and EMTICI manufactured equipments and
parts for the PTE as well as the MHE business. The business was relatively small in
nature mainly comprising of smaller job work.
Products
Its Power Transmission division involves design and manufacturing of the
following:
Power Transmission Solutions
Helical and Bevel Helical Gear boxes
Wind Mill Gear boxes
Planetary Gear boxes
Elevator Traction
Worm Gear boxes
Marine Gear boxes
Geared & Flexible Couplings
Loose Gear boxes
High Speed Gear boxes
Special Gear boxes
5 November 2015
10
Elecon Engineering | 2QFY2016 Result Update
Its product range in the MHE segment includes design, engineering, manufacture,
supply, erection and commissioning of the following:
Material Handling Equipment
Wagon tipplers
Crawler-mounted trippers
Stationary and shiftable conveying systems
Bucket wheel stacker/reclaimers
for open cast lignite mines
Integrated coal handling plants for power
Barrel-type blender reclaimers
stations
Fertilizer reclaiming scrapers
Fertilizer reclaiming scrapers
Limestone pre-homegenizing and blending
Underground mining conveyors
plants
Single and twin bucket wheel bridge-type
Open-cast conveying systems
reclaimers
5 November 2015
11
Elecon Engineering | 2QFY2016 Result Update
Profit and loss statement (Consolidated)
Y/E March (` cr)
FY2013
FY2014
FY2015E
FY2016E
FY2017E
Total operating income
1,527
1,293
1,329
1,369
1,533
% chg
(5.4)
(15.3)
2.8
3.0
12.0
Net Raw Materials
807
624
677
682
745
% chg
(14.1)
(22.6)
8.4
0.8
9.2
Mfg. Exp. & Erection Charges
131
142
147
146
169
% chg
35.9
8.4
3.8
(0.3)
15.1
Personnel
185
174
143
150
167
% chg
27.9
(5.8)
(17.7)
5.0
11.0
Other
196
202
192
202
224
% chg
(12.4)
2.9
(4.8)
5.0
11.0
Total Expenditure
1,319
1,142
1,159
1,181
1,304
EBITDA
208
151
170
188
229
% chg
(0.2)
(27.5)
12.4
10.7
21.7
(% of Net Sales)
13.6
11.7
12.8
13.7
14.9
Depreciation& Amortisation
57
62
72
68
69
EBIT
151
89
98
120
159
% chg
(5.6)
(40.9)
9.9
22.0
33.1
(% of Net Sales)
9.9
6.9
7.4
8.8
10.4
Interest & other Charges
82
74
81
74
66
Other Income
7
15
17
11
12
(% of Net Sales)
0.5
1.2
1.3
0.8
0.8
Recurring PBT
69
15
17
46
93
% chg
(25.9)
(77.9)
12.9
166.2
102.4
Exceptional items
(27)
-
-
-
-
PBT (reported)
50
31
34
57
105
Tax
21
15
17
21
37
(% of PBT)
41.4
49.3
49.5
37.0
35.0
PAT (reported)
29
16
17
36
68
Minority Interest (after tax)
12
1
1
(0)
2
Profit/Loss of Associate Company
0
0
0
0
0
Net Profit after Minority Int.
18
15
16
36
66
& P/L Asso.Co.
Extraordinary Expense/(Inc.)
(14)
0
-
-
-
ADJ. PAT
32
15
16
36
66
% chg
(46.0)
(54.1)
9.8
121.3
82.5
(% of Net Sales)
2.1
1.2
1.2
2.6
4.3
Basic EPS (`)
3.5
1.4
1.5
3.3
6.1
Fully Diluted EPS (`)
3.5
1.4
1.5
3.3
6.1
% chg
(46.0)
(60.8)
9.8
121.3
82.5
Dividend
11
11
12
13
20
Retained Earning
16
3
3
20
45
5 November 2015
12
Elecon Engineering | 2QFY2016 Result Update
Balance sheet (Consolidated)
Y/E March (` cr)
FY2013
FY2014
FY2015
FY2016E
FY2017E
SOURCES OF FUNDS
Equity Share Capital
22
22
22
22
22
Reserves& Surplus
516
510
514
534
578
Shareholders’ Funds
538
532
536
556
600
Minority Interest
34
35
36
36
38
Total Loans
697
633
552
541
519
Other Long Term Liabilities
128
139
113
113
113
Long Term Provisions
5
3
3
3
3
Deferred Tax Liability
44
43
36
36
36
Total Liabilities
1,446
1,386
1,276
1,285
1,310
APPLICATION OF FUNDS
Gross Block
904
908
895
922
949
Less: Acc. Depreciation
360
400
455
523
593
Less: Impairment
-
-
-
-
-
Net Block
544
508
440
398
357
Capital Work-in-Progress
10
7
4
4
4
Lease adjustment
-
-
-
-
-
Goodwill
81
87
84
82
79
Investments
13
14
15
15
15
Long Term Loans and advances
11
19
17
17
17
Other Non-current asset
39
65
54
54
54
Current Assets
1,425
1,357
1,351
1,390
1,531
Cash
32
22
32
63
54
Loans & Advances
155
115
109
112
126
Inventory
393
358
346
358
400
Debtors
838
853
858
851
945
Other current assets
8
9
6
6
6
Current liabilities
679
675
692
679
750
Net Current Assets
746
682
659
711
780
Misc. Exp. not written off
-
-
-
-
-
Deferred Tax Assets
3
3
3
3
3
Total Assets
1,446
1,386
1,276
1,285
1,310
5 November 2015
13
Elecon Engineering | 2QFY2016 Result Update
Cash flow statement (Consolidated)
Y/E March (` cr)
FY2013
FY2014
FY2015
FY2016E FY2017E
Profit before tax
50
31
34
57
105
Depreciation
57
62
72
68
69
Change in Working Capital
(171)
55
32
(21)
(78)
Direct taxes paid
(21)
(15)
(24)
(21)
(37)
Others
(7)
(15)
(17)
(11)
(12)
Cash Flow from Operations
(92)
116
97
72
48
(Inc.)/Dec. in Fixed Assets
(120)
(1)
20
(25)
(25)
(Inc.)/Dec. in Investments
1
(2)
(1)
-
-
(Incr)/Decr In LT loans & adv.
32
(34)
13
-
-
Others
7
15
17
11
12
Cash Flow from Investing
(80)
(22)
49
(14)
(14)
Issue of Equity
3
-
-
-
-
Inc./(Dec.) in loans
32
(64)
(82)
(11)
(19)
Dividend Paid (Incl. Tax)
(14)
(12)
(14)
(16)
(24)
Others
163
(28)
(40)
-
-
Cash Flow from Financing
185
(104)
(137)
(27)
(43)
Inc./(Dec.) in Cash
13
(9)
9
31
(8)
Opening Cash balances
19
32
22
32
63
Closing Cash balances
32
22
32
63
54
5 November 2015
14
Elecon Engineering | 2QFY2016 Result Update
Key ratios (Consolidated)
Y/E March
FY2013
FY2014
FY2015
FY2016E
FY2017E
Valuation Ratio (x)
P/E (on FDEPS)
26.5
57.7
52.5
23.7
13.0
P/CEPS
9.6
11.2
9.8
8.2
6.3
P/BV
1.6
1.6
1.6
1.5
1.4
EV/Net sales
1.0
1.2
1.1
1.0
0.9
EV/EBITDA
7.4
9.9
8.2
7.2
5.9
EV / Total Assets
1.1
1.1
1.1
1.1
1.0
Per Share Data (`)
EPS (Basic)
3.5
1.4
1.5
3.3
6.1
EPS (fully diluted)
3.5
1.4
0.0
0.1
0.1
Cash EPS
9.6
7.0
8.1
9.6
12.4
DPS
1.2
1.0
1.1
1.2
1.8
Book Value
57.9
48.8
49.2
51.0
55.1
DuPont Analysis
EBIT margin
9.9
6.9
7.4
8.8
10.4
Tax retention ratio
0.6
0.5
0.5
0.6
0.7
Asset turnover (x)
1.3
1.0
1.1
1.2
1.3
ROIC (Post-tax)
7.4
3.5
4.1
6.7
9.1
Cost of Debt (Post Tax)
7.0
5.6
6.9
8.5
8.1
Leverage (x)
1.2
1.1
0.9
0.8
0.7
Operating ROE
7.9
1.2
1.5
5.1
9.8
Returns (%)
ROCE (Pre-tax)
11.3
6.3
7.4
9.4
12.3
Angel ROIC (Pre-tax)
12.7
7.0
8.2
10.6
14.0
ROE
6.5
2.8
3.1
6.6
11.4
Turnover ratios (x)
Asset TO (Gross Block)
1.8
1.4
1.5
1.5
1.6
Inventory / Net sales (days)
90
106
97
94
90
Receivables (days)
194
239
235
227
225
Payables (days)
189
216
215
210
210
WC cycle (ex-cash) (days)
150
194
177
170
164
Solvency ratios (x)
Net debt to equity
1.2
1.1
0.9
0.8
0.7
Net debt to EBITDA
3.1
4.0
3.0
2.5
2.0
Int. Coverage (EBIT/ Int.)
1.9
1.2
1.2
1.6
2.4
5 November 2015
15
Elecon Engineering | 2QFY2016 Result Update
Research Team Tel: 022 - 39357800
DISCLAIMER
Angel Broking Private Limited (hereinafter referred to as “Angel”) is a registered Member of National Stock Exchange of India Limited,
Bombay Stock Exchange Limited and Metropolitan Stock Exchange of India Limited. It is also registered as a Depository Participant with
CDSL and Portfolio Manager with SEBI. It also has registration with AMFI as a Mutual Fund Distributor. Angel has received in-principal
approval from SEBI for registering as a Research Entity in terms of SEBI (Research Analyst) Regulations, 2014. Angel or its associates
has not been debarred/ suspended by SEBI or any other regulatory authority for accessing /dealing in securities Market. Angel or its
associates including its relatives/analyst do not hold any financial interest/beneficial ownership of more than 1% in the company
covered by Analyst. Angel or its associates/analyst has not received any compensation / managed or co-managed public offering of
securities of the company covered by Analyst during the past twelve months. Angel/analyst has not served as an officer, director or
employee of company covered by Analyst and has not been engaged in market making activity of the company covered by Analyst.
This document is solely for the personal information of the recipient, and must not be singularly used as the basis of any investment
decision. Nothing in this document should be construed as investment or financial advice. Each recipient of this document should
make such investigations as they deem necessary to arrive at an independent evaluation of an investment in the securities of the
companies referred to in this document (including the merits and risks involved), and should consult their own advisors to determine
the merits and risks of such an investment.
Reports based on technical and derivative analysis center on studying charts of a stock's price movement, outstanding positions and
trading volume, as opposed to focusing on a company's fundamentals and, as such, may not match with a report on a company's
fundamentals.
The information in this document has been printed on the basis of publicly available information, internal data and other reliable
sources believed to be true, but we do not represent that it is accurate or complete and it should not be relied on as such, as this
document is for general guidance only. Angel Broking Pvt. Limited or any of its affiliates/ group companies shall not be in any way
responsible for any loss or damage that may arise to any person from any inadvertent error in the information contained in this report.
Angel Broking Pvt. Limited has not independently verified all the information contained within this document. Accordingly, we cannot
testify, nor make any representation or warranty, express or implied, to the accuracy, contents or data contained within this document.
While Angel Broking Pvt. Limited endeavors to update on a reasonable basis the information discussed in this material, there may be
regulatory, compliance, or other reasons that prevent us from doing so.
This document is being supplied to you solely for your information, and its contents, information or data may not be reproduced,
redistributed or passed on, directly or indirectly.
Neither Angel Broking Pvt. Limited, nor its directors, employees or affiliates shall be liable for any loss or damage that may arise from
or in connection with the use of this information.
Note: Please refer to the important ‘Stock Holding Disclosure' report on the Angel website (Research Section). Also, please refer to the
latest update on respective stocks for the disclosure status in respect of those stocks. Angel Broking Pvt. Limited and its affiliates may
have investment positions in the stocks recommended in this report.
Disclosure of Interest Statement
Elecon Engineering
1. Analyst ownership of the stock
No
2. Angel and its Group companies ownership of the stock
No
3. Angel and its Group companies' Directors ownership of the stock
No
4. Broking relationship with company covered
No
Note: We have not considered any Exposure below ` 1 lakh for Angel, its Group companies and Directors
Ratings (Based on expected returns
Buy (> 15%)
Accumulate (5% to 15%)
Neutral (-5 to 5%)
over 12 months investment period):
Reduce (-5% to -15%)
Sell (< -15
5 November 2015
16