3QFY2017 Result Update | Pharmaceutical
February 22, 2017
Dr. Reddy’s Laboratories
NEUTRAL
CMP
`2,899
Performance Highlights
Target Price
-
Y/E March (` cr)
3QFY2017 2QFY2017
% chg (qoq) 3QFY2016
% chg (yoy)
Investment Period
-
Net sales
3,707
3,586
3.4
3,968
(6.6)
Gross profit
2,475
2,294
7.9
2,606
(5.0)
Stock Info
Operating profit
845
596
41.9
992
(14.9)
Sector
Pharmaceutical
Adj. net profit
470
295
59.4
579
(18.8)
Source: Company, Angel Research
Market Cap (` cr)
48,047
Net Debt (` cr)
(663)
Dr. Reddy’s Laboratories (DRL) posted lower than expected results for 3QFY2017.
Beta
0.5
In INR terms, the consolidated revenues came in at `3,707cr (v/s. `4,000cr
52 Week High / Low
3,689/2,804
expected) v/s. `3,989cr in 3QFY2016, down 6.6% yoy, mainly driven by pressure
Avg. Daily Volume
32,443
on the generic market. The global generic market with sales at `3,064cr (down
Face Value (`)
5
9.0% yoy), was mainly lead by Europe (`214.8cr, up 11% yoy) and Emerging
BSE Sensex
28,762
market (`594.8cr, a yoy dip of 7%). The PSAI segment posted sales of `540cr, up
Nifty
8,908
6.0% yoy. On the operating front, the EBIT margin came in at 9.7% (v/s. 17.1%
Reuters Code
REDY.BO
expected) v/s. 18.8% in 3QFY2016. Consequently, the PAT came in at `470cr
(v/s. `536cr expected) v/s. `579cr in 3QFY2016, a yoy de-growth of 18.8%. We
Bloomberg Code
DRRD@IN
maintain our Neutral rating.
A subdued quarter: Dr. Reddy’s Laboratories (DRL) posted results lower than
Shareholding Pattern (%)
expected. In INR terms, the consolidated revenues came in at `3,707cr (v/s.
Promoters
26.8
`4,000cr expected) v/s. `3,989cr in 3QFY2016, down 6.6% yoy, mainly driven by
MF / Banks / Indian Fls
10.7
pressure on the generic market. The global generic market with sales at `3,064cr
FII / NRIs / OCBs
54.0
(down 9.0% yoy), was mainly lead by Europe (`214.8cr, up 11% yoy) and
Indian Public / Others
8.5
Emerging market (`594.8cr, a yoy dip of 7%). The PSAI segment posted sales of
`540cr, up 6.0%. On the operating front, the EBIT margin came in at 9.7% (v/s.
17.1% expected) v/s. 18.8% in 3QFY2016. Consequently, the PAT came in at
Abs. (%)
3m 1yr
3yr
`470cr (v/s. `536cr expected) v/s. `579cr in 3QFY2016, a yoy de-growth of
Sensex
10.8
21.3
38.9
18.8%.
Dr Reddy
(7.5)
(5.3)
6.2
Outlook and valuation: We expect net sales to grow at a CAGR of 3.4% to
`16,542cr and adjusted EPS to post flat growth to end the period at `130.9 in
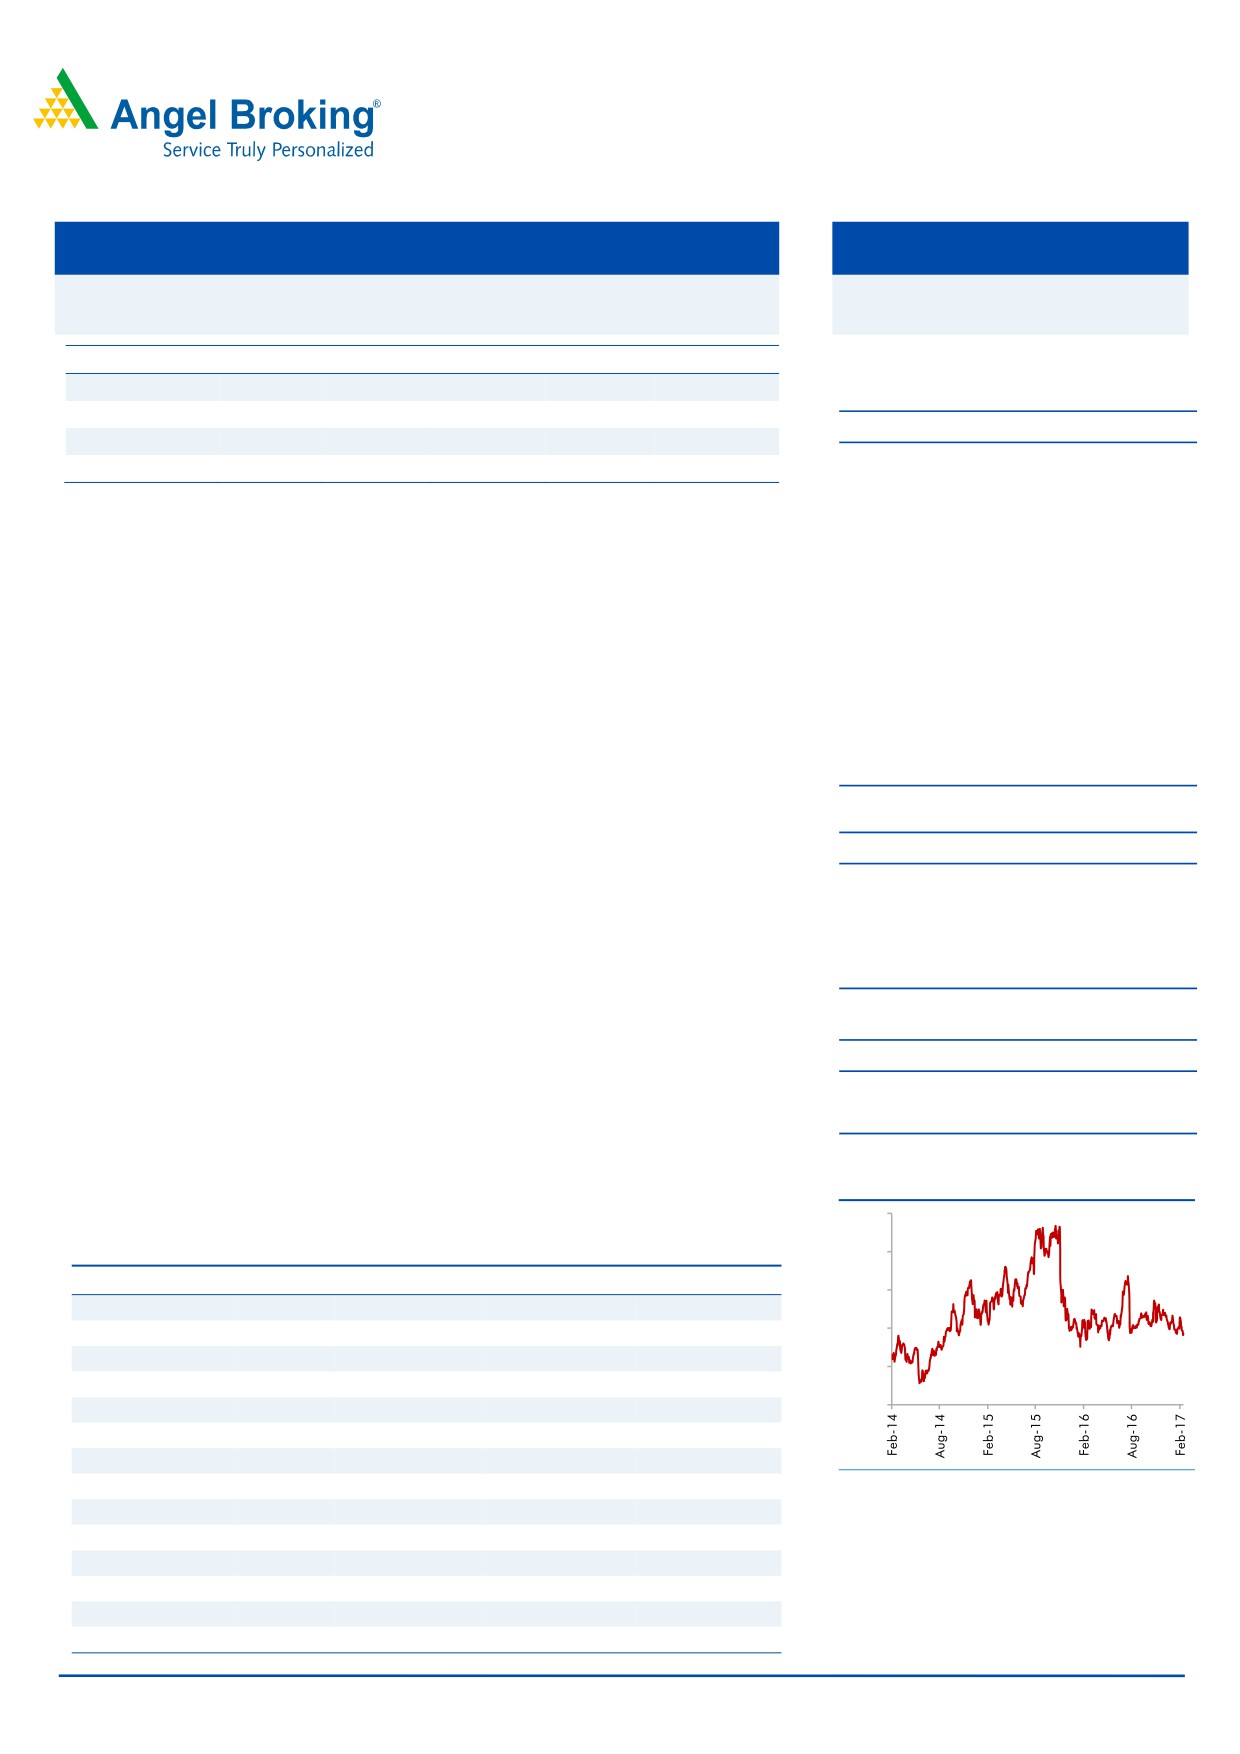
3-year Daily Price Chart
FY2018E. We recommend a Neutral rating on the stock given the valuations.
4,500
Key financials (IFRS Consolidated)
4,000
Y/E March (` cr)
FY2015
FY2016
FY2017E
FY2018E
3,500
Net sales
14,819
15,471
14,444
16,542
3,000
% chg
12.1
4.4
-6.6
14.5
Net profit
2,218
2,001
1,342
2,233
2,500
% chg
3.1
(9.8)
(33.0)
66.4
2,000
Adj net profit
2,218
2,357
1,342
2,233
% chg
3.1
6.3
(43.1)
66.4
Adj. EPS (`)
130.2
138.2
78.6
130.9
Source: Company, Angel Research
EBITDA margin (%)
22.2
24.6
18.0
23.0
P/E (x)
22.3
21.0
36.9
22.1
RoE (%)
21.9
19.7
10.1
15.2
RoCE (%)
18.1
18.7
9.7
15.3
P/BV (x)
4.4
3.9
3.6
3.2
Sarabjit Kour Nangra
EV/Sales (x)
3.3
3.2
3.4
3.0
+91 2 39357600 Ext: 6806
EV/EBITDA (x)
14.9
12.8
18.9
12.9
Source: Company, Angel Research; Note: CMP as of February 21, 2017
Please refer to important disclosures at the end of this report
1
Dr. Reddy’s Laboratories | 3QFY2017 Result Update
Exhibit 1: 3QFY2017 performance (IFRS, consolidated)
Y/E March (` cr)
3QFY2017
2QFY2017
% chg (qoq) 3QFY2016
% chg (yoy)
9MFY2017
9MFY2016
% chg
Net sales
3,707
3,586
3.4
3,968
(6.6)
10,421
11,715
(11.0)
Other income/(loss)
23
64
-
12
-
269
57
-
Total income
3,730
3,650
2.2
3,980
(6.3)
10,690
11,772
(9.2)
Gross profit
2,475
2,294
7.9
2,606
(5.0)
7,565
7,821
(3.3)
Gross margin (%)
66.8
64.0
65.7
72.6
66.8
SG&A expenses
1,134
1,177
(3.7)
1,204
(5.8)
3,437
3,407
0.9
R&D expenses
496
521
(4.9)
410
21.0
2,413
1,276
89.2
EBDITA
845
596
41.9
992
(14.9)
1,716
3,138
(45.3)
EBDITA (%)
22.8
16.6
-
25.0
16.5
26.8
-
Depreciation
285
285
0.0
246.6
15.5
790.5
720.4
9.7
Interest
-
-
-
-
-
PBT
583
375
55.5
758
(23.0)
1,194
2,475
(51.8)
Tax
122
89
38.1
179
(31.7)
270
539
(49.8)
Net Profit
461
287
60.9
579
(20.4)
924
1,936
(52.3)
Share of profit/ (loss) in associates
(8.4)
(8.4)
-
-
8.8
Reported net profit before exceptional
470
295
59.2
579
(18.9)
924
1,945
(52.5)
Exceptional items (loss) /profit
-
-
-
-
-
Reported PAT
470
295
59.4
579
(18.8)
924
1,945
(52.5)
Adj. Net Profit
470
295
59.4
579
(18.8)
924
1,945
(52.5)
EPS (`)
27.7
17.4
34.1
54.4
114.6
Source: Company, Angel Research
Exhibit 2: Actual Vs Estimates
(` cr)
Actual
Estimates
Variation (%)
Net sales
3,707
4,000
(7.3)
Other income
23
20
15.5
Operating profit
845
970
(12.9)
Tax
122
169
(27.8)
Adj. Net profit
470
536
(12.3)
Source: Company, Angel Research
Revenue lower than expectation: In INR terms, the consolidated revenues came in
at `3,707cr (v/s. `4,000cr expected) v/s. `3,968cr in 3QFY2016, down 6.6% yoy,
mainly driven by pressure on the generic market.
The global generic market with sales at`3,064cr (down by 9.0% yoy), was mainly
lead by the Europe (`214.8cr, up 11% yoy) and Emerging markets (`594.8cr, a
yoy dip of 7%). Other key markets like US dipped by 15% yoy to `1659.5cr,
whereas, India grew by 2% yoy to `594.7cr.
Revenues from North America declined 15% yoy, primarily on account of increased
competition in valgancyclovir and injectable franchise coupled with continuing
pricing pressure.
The PSAI segment posted sales of `540cr, up 6.0% yoy. The growth came in on the
back of US (`125.9cr, a yoy growth of 21%), Europe (`182.8cr, a yoy dip of 6.0%),
India (`40.9cr, a yoy dip of 34%) and ROW (`190.4cr, a yoy growth of 29%). As of
December 31, 2016, 92 generic filings are pending approval with the USFDA,
including 59 Para IVs (of which 20 are FTFs). Of these 90 ANDAs, 59 are Para IVs
out of which we believe 20 have ‘First to File’ status. Further, these 90 ANDAs
include 7 ANDAs, acquired from Teva, of which 6 are Para IVs.
February 22, 2017
2
Dr. Reddy’s Laboratories | 3QFY2017 Result Update
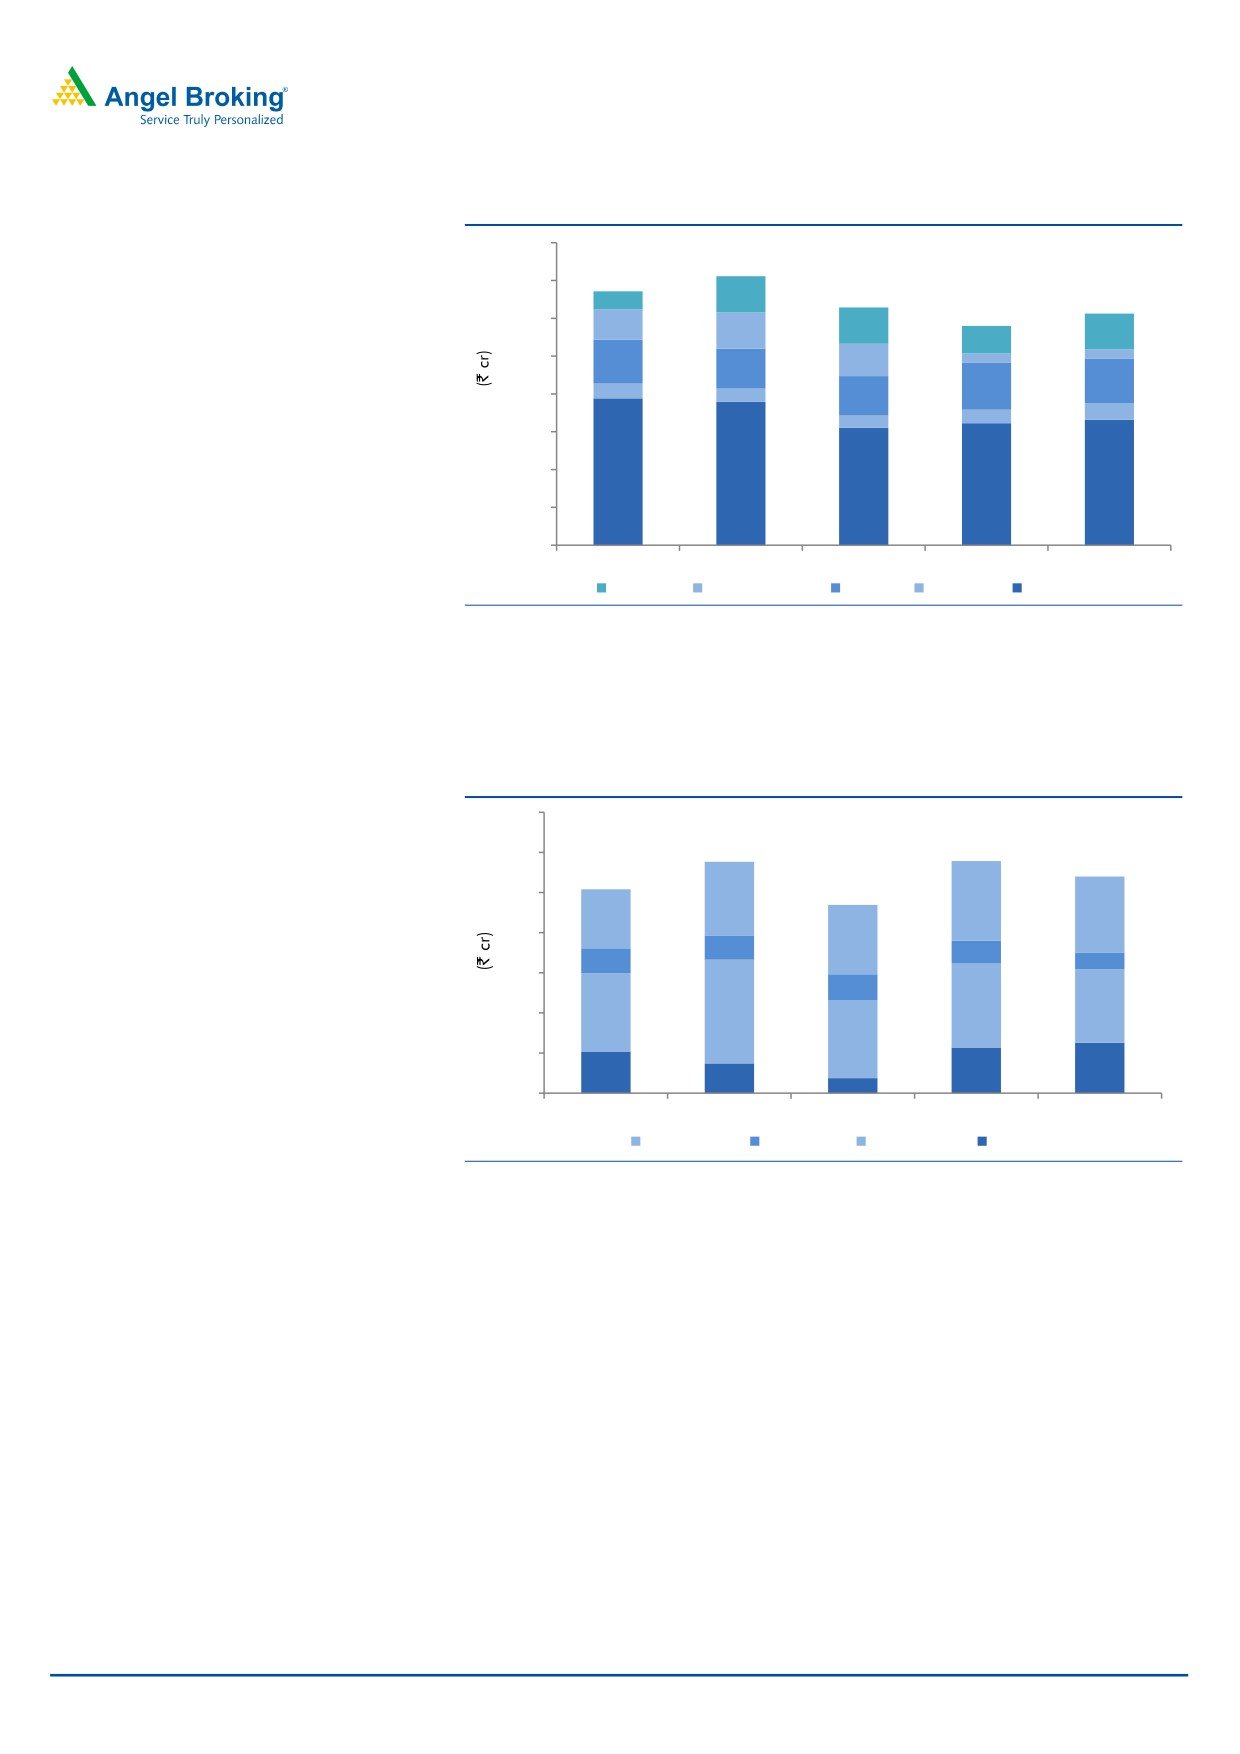
Exhibit 3: Trend in Global generics
4000
3500
3000
401
480
2500
123
581
428
123
527
595
194
625
2000
176
522
177
215
162
1500
1000
1,942
1,895
1,552
1,613
1,659
500
0
3QFY2016
4QFY2016
1QFY2017
2QFY2017
3QFY2017
Others
Russia & CIS
India
Europe
North America
Source: Company, Angel Research
In the PSAI segment (15% of sales), the US grew by 11% yoy; while ROW, Europe,
and India de-grew by 4%, 13% and 29% yoy respectively during the quarter.
Proprietary Products & Others (`102.7cr) posted a yoy de-growth of 5%.
Exhibit 4: PSAI trend
700
600
500
184
198
147
190
400
173
60
58
62
41
300
64
210
183
200
195
259
195
100
104
114
126
74
37
0
3QFY2016
4QFY2016
1QFY2017
2QFY2017
3QFY2017
Others
India
Europe
North America
Source: Company, Angel Research
February 22, 2017
3
Dr. Reddy’s Laboratories | 3QFY2017 Result Update
EBITDA margin dips yoy: On the operating front, lower sales led the EBIT to come
in at 9.7% (v/s. 17.1% expected) v/s. 18.8% in 3QFY2016. The EBITDA margin
came in at 16.6% (v/s. 17.2% expected) v/s. 25.8% in 3QFY2016, which was hurt
on account of lower sales and 5.8% yoy growth in SG&A expenses. R&D
expenditure for the quarter amounted to
13.4% of sales (v/s.
10.3% in
3QFY2016).
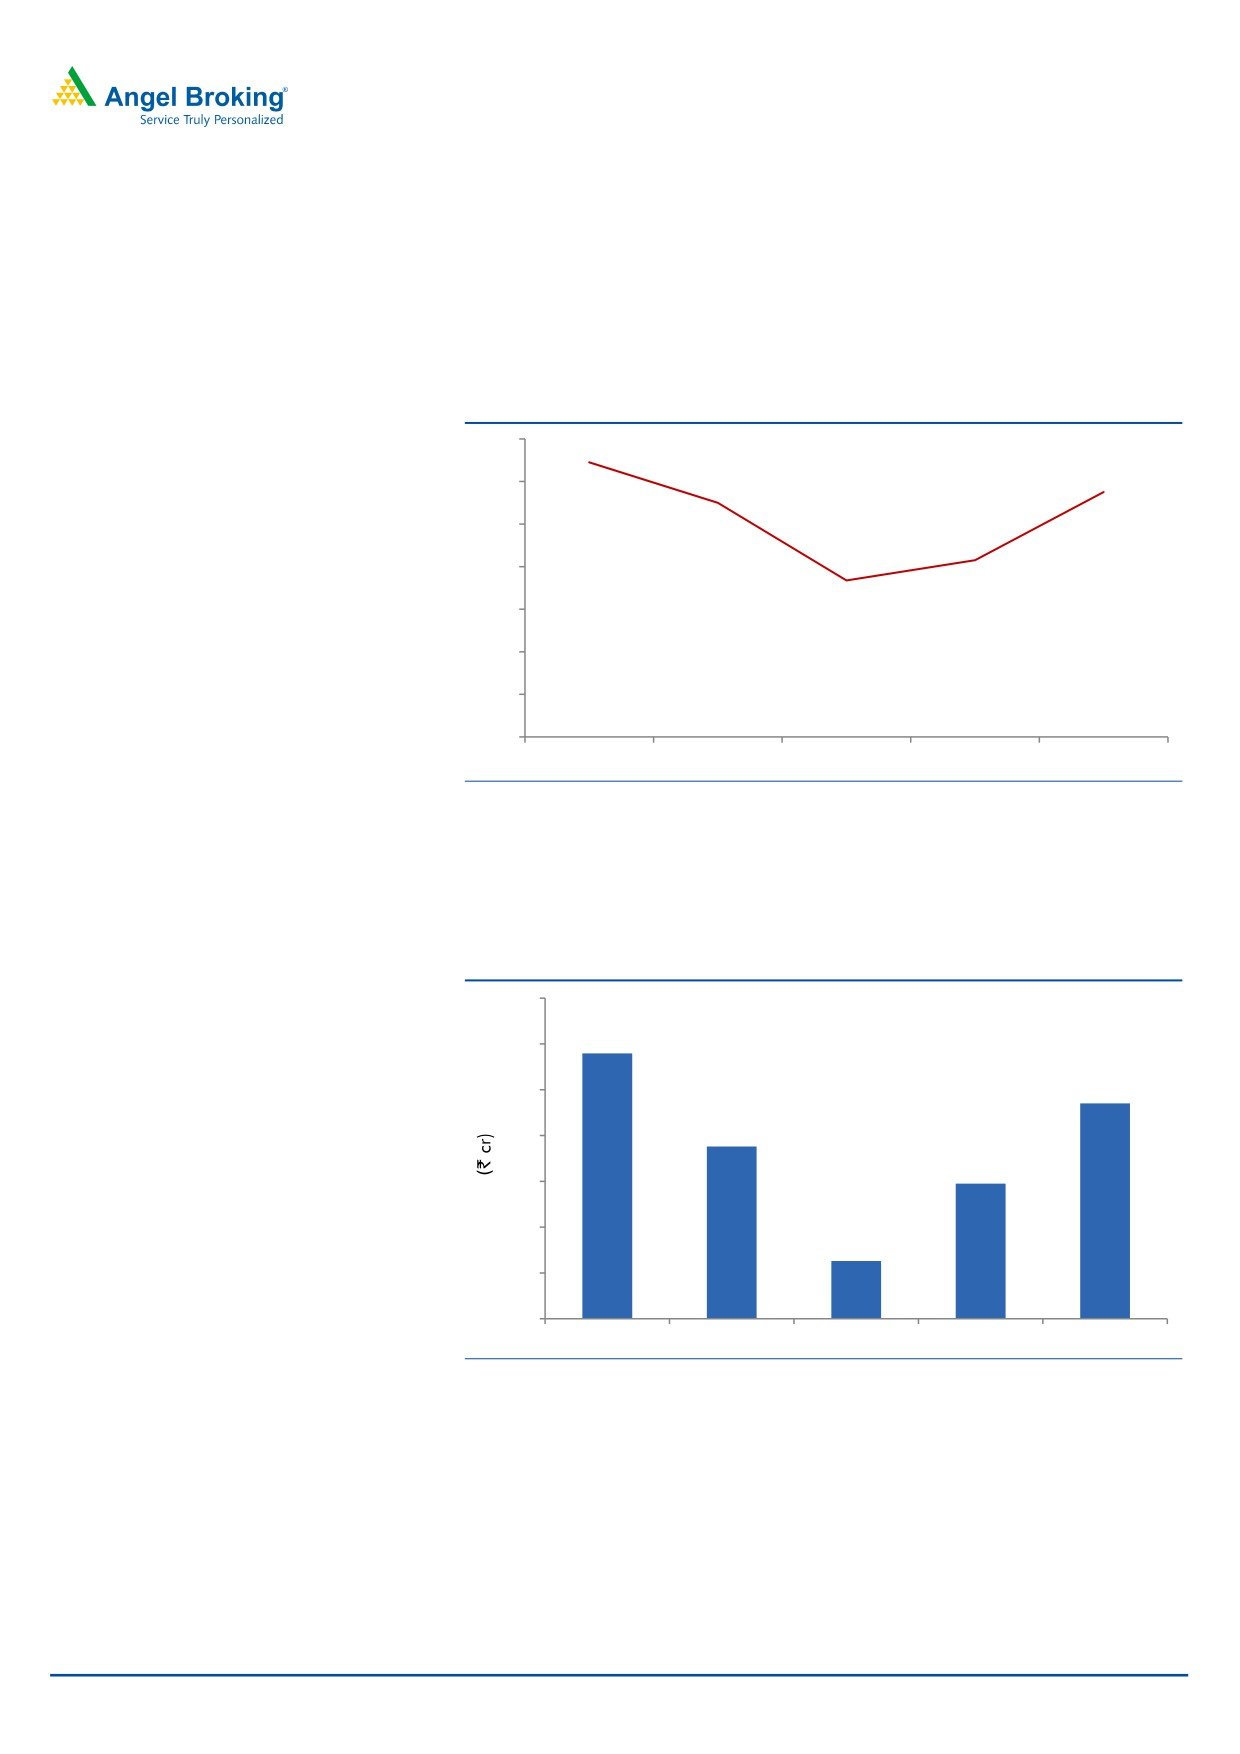
Exhibit 5: EBITDA margin trend (%)
28.0
25.8
23.0
24.0
22.0
20.0
16.6
14.7
16.0
12.0
8.0
4.0
0.0
3QFY2016
4QFY2016
1QFY2017
2QFY2017
3QFY2017
Source: Company, Angel Research
Net profit lower than expected: Other income for the quarter came in at ~`23cr
(v/s. `12cr in 3QFY2016). The net profit stood at `470cr (v/s. `536cr expected)
v/s. `579cr in 3QFY2016), a yoy de-growth of 18.8%.
Exhibit 6: Adjusted net profit trend
700
579
600
470
500
376
400
295
300
200
126
100
0
3QFY2016
4QFY2016
1QFY2017
2QFY2017
3QFY2017
Source: Company, Angel Research
February 22, 2017
4
Dr. Reddy’s Laboratories | 3QFY2017 Result Update
Concall takeaways
Remediation process over; Inspection at all three facilities are expected in
Feb/ Mar’2017.
DRL expects 15 ANDA launches in FY2018 (including
4-5 meaningful
launches.
Plans to file 25 US ANDA’s in FY2017.
Effective Tax rate to be 20-22% of PBT in FY2017.
The company incurs 12-15% of its total R&D spends on bio-similar research.
Investment arguments
Robust growth in the US going ahead: After attaining a critical mass (US$1,139mn
in FY2016), DRL aims to scale up its business to the next orbit in the US market on
the back of a strong product pipeline (92 ANDAs are pending approval, of which,
59 are Para IVs and 20 are FTFs). The Management has guided for a robust
growth in the US over the medium term, driven by introduction of new products,
some of which are also Para IV opportunities. Owing to the import alert on the
three facilities of the company, in a worst case scenario, we expect the ex-
exclusivity US sales to post a flat growth during FY2016-18E.
Domestic back in focus: DRL reported a 19.0% yoy growth in FY2016. The
management expects the company’s performance to rebound and targets to
achieve an above industry growth rate going ahead, driven by a) field force
expansion and improvement in productivity, b) new product launches (including
biosimilars), and c) focus on brand building. In 4QFY2015, DRL had acquired
UCB’s India portfolio and has completed the integration process of these brands in
1QFY2016. UCB’s India business had registered ~`150cr sales in CY2014 and
has a branded portfolio of
21 products focusing on Allergy, Respiratory,
Dermatology and Pediatric space. The acquisition had been successfully integrated
by 2QFY2016. Thus, we expect sales in India to post a CAGR of ~7.8% over
FY2016-18E.
Valuation: We expect net sales to grow at a CAGR of 3.4% to `16,542cr and
adjusted EPS to post flat growth to end FY2018 at
`130.9 over
FY2016-18E. The stock has been severely beaten down post the import alert from
the USFDA. However, considering the valuations, we recommend a Neutral rating
on the stock.
Exhibit 7: Key assumptions
FY2017E
FY2018E
PSAI segment growth (%)
(4.2)
(0.5)
Generics segment growth (%)
(8.0)
17.0
Operating margin (%)
18.0
23.0
Capex (` cr)
1200
1200
Source: Company, Angel Research
February 22, 2017
5
Dr. Reddy’s Laboratories | 3QFY2017 Result Update
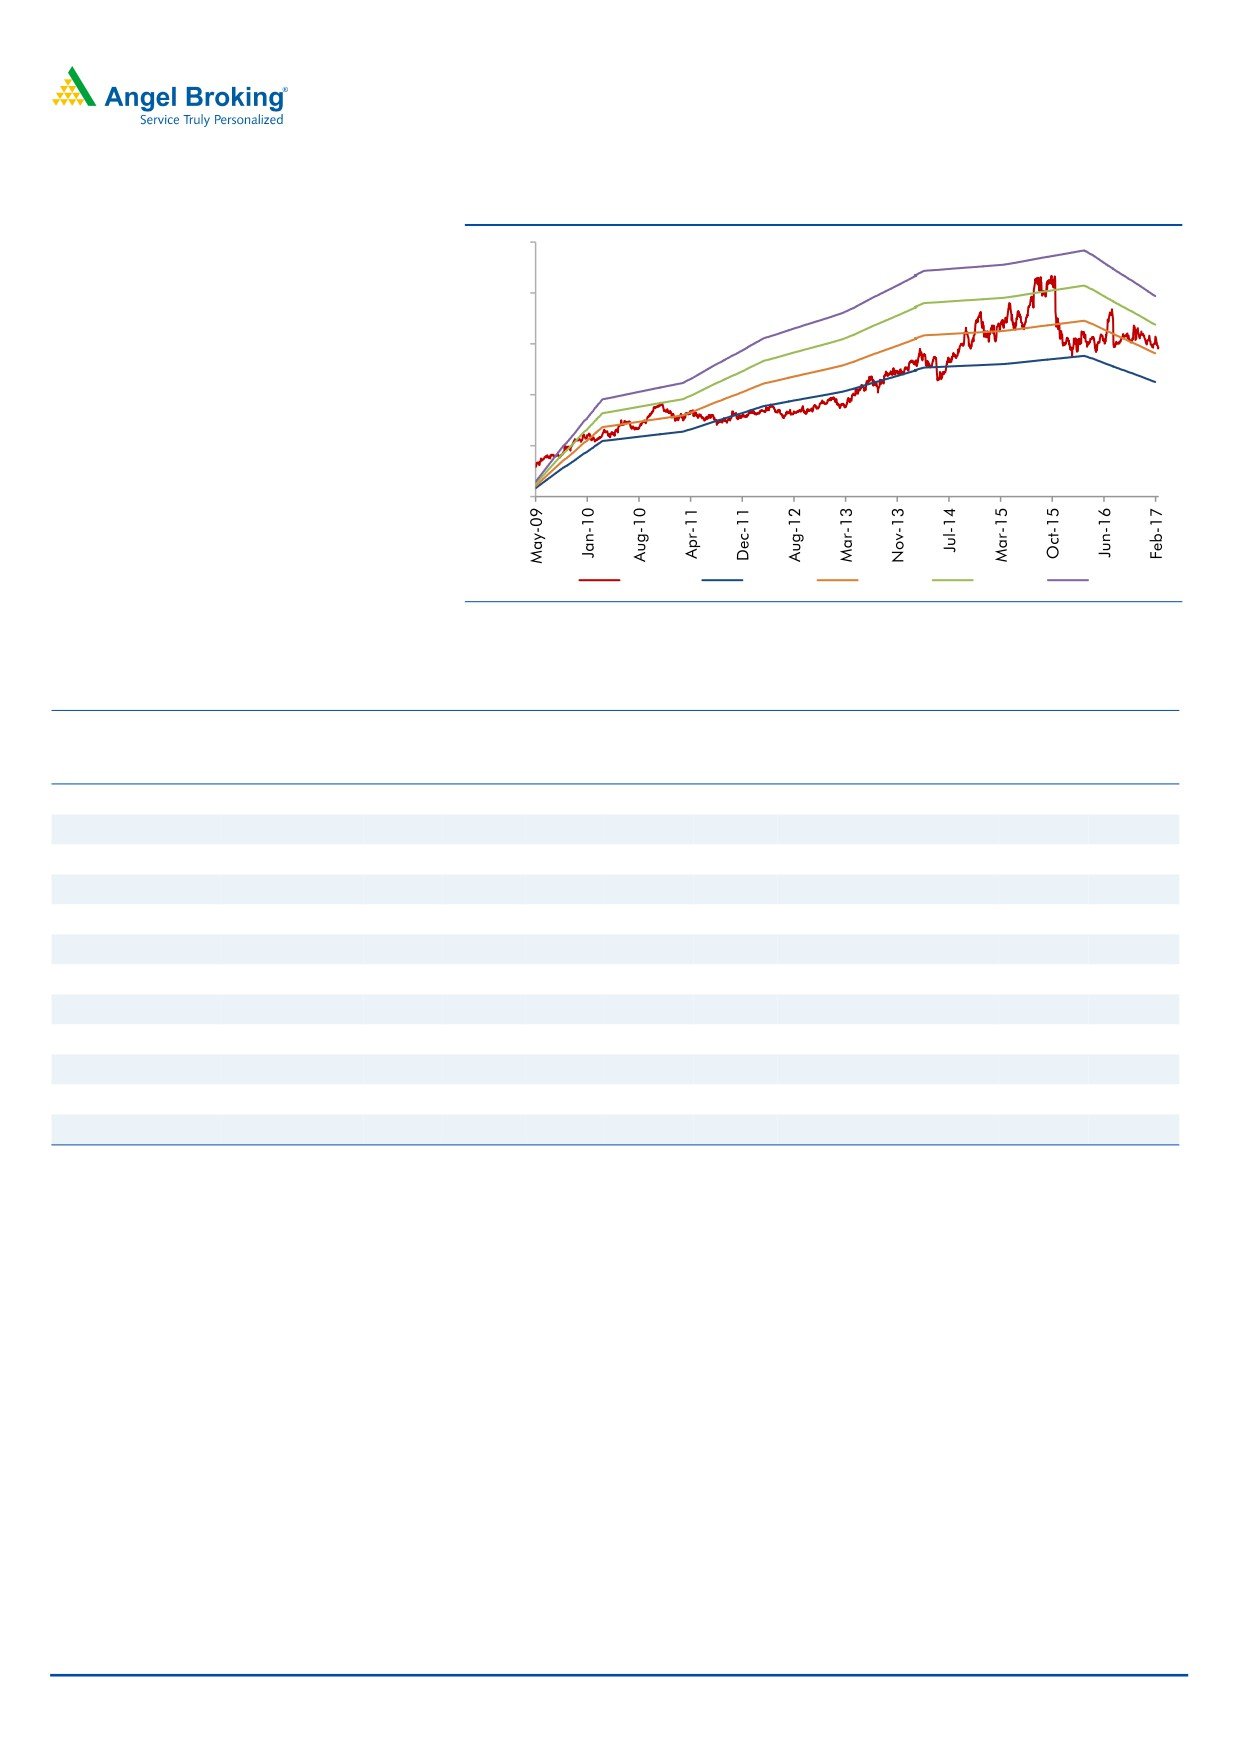
Exhibit 8: PE chart
5,000
4,000
3,000
2,000
1,000
0
Price
20x
25x
30x
35x
Source: Company, Angel Research
Exhibit 9: Recommendation summary
Company
Reco.
CMP Tgt Price Upside
FY2018E
FY16-18E
FY2018E
(`)
(`)
(%)
PE
EV/Sales
EV/EBITDA
CAGR in EPS
RoCE
RoE
(x)
(x)
(x)
(%)
(%)
(%)
Alembic Pharma
Neutral
593
-
-
19.5
2.6
12.2
(10.8)
27.5
25.3
Aurobindo Pharma Buy
686
877
27.9
14.5
2.4
10.1
18.1
22.5
26.1
Cadila Healthcare Neutral
440
-
-
22.9
3.6
16.6
13.5
23.6
27.1
Cipla
Sell
593
465
(21.5)
24.2
2.7
16.3
14.2
12.2
13.9
Dr Reddy's
Neutral
2,899
-
-
22.1
2.6
11.4
(2.7)
15.3
15.2
Dishman Pharma Neutral
229
-
-
20.3
2.3
10.0
13.3
10.3
10.9
GSK Pharma*
Neutral
2,683
-
-
44.5
6.8
32.8
16.9
37.5
34.5
Indoco Remedies
Reduce
272
240
(11.8)
17.0
2.0
10.9
33.2
19.1
20.1
Ipca labs
Accumulate
554
613
10.7
28.1
1.9
12.7
36.5
8.8
9.4
Lupin
Buy
1,469
1,809
23.1
21.2
4.0
13.1
17.2
24.4
20.9
Sanofi India
Neutral
4,186
-
-
24.3
3.2
17.4
22.2
25.6
28.8
Sun Pharma
Buy
673
847
25.8
19.1
4.0
12.2
26.5
18.9
20.1
Source: Company, Angel Research; Note: *December year ending
Company Background
Established in
1984, Dr. Reddy's Laboratories is an integrated global
pharmaceutical company, through its three businesses - Pharmaceutical Services
and Active Ingredients, Global Generics and Proprietary Products. The company’s
key therapeutic focus is on gastro-intestinal, cardiovascular, diabetology,
oncology, pain management, anti-infective and paediatrics. The company’s key
markets include India, USA, Russia & CIS and Germany.
February 22, 2017
6
Dr. Reddy’s Laboratories | 3QFY2017 Result Update
Profit & loss statement (IFRS Consolidated)
Y/E March
FY2013
FY2014
FY2015
FY2016
FY2017E FY2018E
Net sales
11,627
13,217
14,819
15,471
14,444
16,542
Other operating income
247.9
141.6
91.7
87.4
87.4
87.4
Total operating income
11,875
13,359
14,911
15,558
14,532
16,630
% chg
21.8
12.5
11.6
4.3
-6.6
14.4
Total expenditure
8,951
10,096
11,535
11,669
11,851
12,744
Cost of revenues
4,825
4,977
5,531
5,315 5,423.20
5,630.35
SG&A expenses
3,358
3,878
4,259
4,570
4,261
4,632
R&D expenses
767.3
1,240.2
1,744.9
1,783.4
2,166.7
2,481.4
EBITDA
2,676
3,121
3,284
3,802
2,593
3,799
% chg
3.0
16.6
5.2
15.8
(31.8)
46.5
(% of Net Sales)
23.0
23.6
22.2
24.6
18.0
23.0
Depreciation & amortisation
743.7
659.8
747.4
927.4
990.1
1,052.8
EBIT
1,932
2,462
2,537
2,875
1,603
2,746
% chg
4.3
27.4
3.1
13.3
(44.2)
71.3
(% of Net Sales)
16.6
18.6
17.1
18.6
11.1
16.6
Interest & other charges
-
-
-
-
-
-
Other Income
46.0
40.0
168.2
(270.8)
-
-
(% of PBT)
2.1
1.5
6.0
(10.0)
-
-
Share in profit of associates
10.4
17.4
19.5
22.9
22.9
22.9
Recurring PBT
2,237
2,661
2,816
2,714
1,714
2,856
% chg
14.7
19.0
5.9
-3.6
(36.9)
66.7
Extraordinary expense/(Inc.)
68.8
-
-
508.5
-
-
PBT (reported)
2,167.7
2,660.6
2,816.3
2,714.0
1,713.6
2,856.4
Tax
490.0
509.4
598.4
712.7
372.0
623.4
(% of PBT)
22.6
19.1
21.2
26.3
21.7
21.8
PAT (reported)
1,677.7
2,151.2
2,217.9
2,001.3
1,341.7
2,233.0
Add: Share of earnings of asso.
-
-
-
-
-
-
Less: Minority interest (MI)
-
-
-
-
-
-
Exceptional items
-
-
-
-
-
-
PAT after MI (reported)
1,677.7
2,151.2
2,217.9
2,001.3
1,341.7
2,233.0
ADJ. PAT
1,750.0
2,151.2
2,217.9
2,357.0
1,341.7
2,233.0
% chg
17.0
22.9
3.1
6.3
(43.1)
66.4
(% of Net Sales)
14.4
16.3
15.0
12.9
9.3
13.5
Basic EPS (`)
103.1
126.7
130.2
138.2
78.6
130.9
Fully Diluted EPS (`)
103.1
126.7
130.2
138.2
78.6
130.9
% chg
16.8
22.9
2.7
6.1
(43.1)
66.4
February 22, 2017
7
Dr. Reddy’s Laboratories | 3QFY2017 Result Update
Balance sheet (IFRS Consolidated)
Y/E March (` cr)
FY2013
FY2014
FY2015
FY2016
FY2017E FY2018E
SOURCES OF FUNDS
Equity share capital
84.9
84.9
85.2
85.3
85.3
85.3
Preference Capital
-
-
-
-
-
-
Reserves & surplus
7,224
8,995
11,045
12,748
13,691
15,525
Shareholders funds
7,309
9,080
11,130
12,834
13,776
15,610
Minority Interest
Total loans
3,676.0
4,474.2
3,954.3
3,661.9
3,661.9
3,661.9
Deferred tax liability
83.3
(192.9)
(401.3)
(423.0)
(423.0)
(423.0)
Total liabilities
11,068
13,361
14,683
16,073
17,015
18,849
APPLICATION OF FUNDS
Net fixed assets
3,781
3,945
4,314
5,396
6,596
7,796
Goodwill /other intangibles
1,402
1,470
1,643
1,969
1,969
1,969
Capital Work-in-Progress
495.2
495.2
495.2
495.2
495.2
495.2
Investments
1,764
2,589
3,811
3,833
3,833
3,833
Current Assets
6,875
7,866
8,558
8,465
7,997
9,205
Cash
513.6
845
539
492
200
282
Loans & Advances
697.6
793.0
889.1
928.2
866.7
992.5
Other
5,664
6,228
7,129
7,045
6,930
7,931
Current liabilities
3,252
3,006
4,214
4,193
3,982
4,557
Net Current Assets
3,623
4,860
4,344
4,273
4,015
4,649
Other Assets
-
76
106
106
106
Total Assets
11,068
13,361
14,683
16,073
17,015
18,849
February 22, 2017
8
Dr. Reddy’s Laboratories | 3QFY2017 Result Update
Cash flow statement (IFRS Consolidated)
Y/E March (` cr)
FY2013
FY2014
FY2015
FY2016
FY2017E FY2018E
Profit before tax
2,237
2,661
2,816
2,714
1,714
2,856
Depreciation
744
660
747
927
990
1,053
(Inc)/Dec in Working Capital
535
(906)
211
24
(35)
(552)
Less: Other income
46
40
168
(271)
-
-
Direct taxes paid
490
509
598
713
372
623
Cash Flow from Operations
2,980
1,865
3,008
3,224
2,297
2,734
(Inc.)/Dec.in Fixed Assets
(431)
(164)
(369)
(1,082)
(1,200)
(1,200)
(Inc.)/Dec. in Investments
687
824
1,222
22
-
-
Other income
46
40
168
(271)
-
-
Cash Flow from Investing
302
701
1,021
(1,331)
(1,200)
(1,200)
Issue of Equity
0
-
0
0
-
-
Inc./(Dec.) in loans
(1,155)
798
(520)
(292)
-
-
Dividend Paid (Incl. Tax)
298
358
399
399
399
399
Others
(2,649)
(3,390)
(4,214)
(2,047)
(1,789)
(1,851)
Cash Flow from Financing
(3,506)
(2,234)
(4,335)
(1,940)
(1,389)
(1,452)
Inc./(Dec.) in Cash
(224)
331
(306)
(47)
(292)
82
Opening Cash balances
738
514
845
539
492
200
Closing Cash balances
514
845
539
492
200
282
February 22, 2017
9
Dr. Reddy’s Laboratories | 3QFY2017 Result Update
Key ratios
Y/E March
FY2013
FY2014
FY2015
FY2016
FY2017E
FY2018E
Valuation Ratio (x)
P/E (on FDEPS)
28.1
22.9
22.3
21.0
36.9
22.1
P/CEPS
20.3
17.5
16.7
16.9
21.2
15.1
P/BV
6.7
5.4
4.4
3.9
3.6
3.2
Dividend yield (%)
0.5
0.5
0.5
0.5
0.5
0.5
EV/Sales
4.4
3.8
3.3
3.2
3.4
3.0
EV/EBITDA
18.9
16.1
14.9
12.8
18.9
12.9
EV / Total Assets
4.6
3.8
3.3
3.0
2.9
2.6
Per Share Data (`)
EPS (Basic)
103.1
126.7
130.2
138.2
78.6
130.9
EPS (fully diluted)
103.1
126.7
130.2
138.2
78.6
130.9
Cash EPS
142.6
165.5
174.0
171.7
136.7
192.6
DPS
15.0
15.0
15.0
15.0
15.0
15.0
Book Value
430.4
534.7
653.3
752.3
807.5
915.0
Dupont Analysis
EBIT margin
16.6
18.6
17.1
18.6
11.1
16.6
Tax retention ratio
77.4
80.9
78.8
73.7
78.3
78.2
Asset turnover (x)
1.2
1.2
1.1
1.0
0.9
0.9
ROIC (Post-tax)
14.9
17.4
15.1
14.3
7.8
12.2
Cost of Debt (Post Tax)
0.0
0.0
0.0
0.0
0.0
0.0
Leverage (x)
0.6
0.4
0.4
0.3
0.2
0.2
Operating ROE
23.5
24.7
20.4
18.3
9.7
15.1
Returns (%)
ROCE (Pre-tax)
17.8
20.2
18.1
18.7
9.7
15.3
Angel ROIC (Pre-tax)
23.1
25.6
22.5
22.9
11.7
18.0
ROE
26.8
26.3
21.9
19.7
10.1
15.2
Turnover ratios (x)
Asset Turnover (Gross Block)
3.3
3.5
3.6
3.2
2.4
2.3
Inventory / Sales (days)
63
62
61
60
58
59
Receivables (days)
88
89
90
96
84
85
Payables (days)
44
40
43
59
39
42
WC cycle (ex-cash) (days)
104
97
96
89
95
90
Solvency ratios (x)
Net debt to equity
0.4
0.4
0.3
0.2
0.3
0.2
Net debt to EBITDA
1.2
1.2
1.0
0.8
1.3
0.9
Interest Coverage (EBIT / Int.)
-
-
-
-
-
-
February 22, 2017
10
Dr. Reddy’s Laboratories | 3QFY2017 Result Update
Research Team Tel: 022 - 39357800
DISCLAIMER
Angel Broking Private Limited (hereinafter referred to as “Angel”) is a registered Member of National Stock Exchange of India Limited,
Bombay Stock Exchange Limited and Metropolitan Stock Exchange Limited. It is also registered as a Depository Participant with CDSL
and Portfolio Manager with SEBI. It also has registration with AMFI as a Mutual Fund Distributor. Angel Broking Private Limited is a
registered entity with SEBI for Research Analyst in terms of SEBI (Research Analyst) Regulations, 2014 vide registration number
INH000000164. Angel or its associates has not been debarred/ suspended by SEBI or any other regulatory authority for accessing
/dealing in securities Market. Angel or its associates/analyst has not received any compensation / managed or co-managed public
offering of securities of the company covered by Analyst during the past twelve months.
This document is solely for the personal information of the recipient, and must not be singularly used as the basis of any investment
decision. Nothing in this document should be construed as investment or financial advice. Each recipient of this document should
make such investigations as they deem necessary to arrive at an independent evaluation of an investment in the securities of the
companies referred to in this document (including the merits and risks involved), and should consult their own advisors to determine
the merits and risks of such an investment.
Reports based on technical and derivative analysis center on studying charts of a stock's price movement, outstanding positions and
trading volume, as opposed to focusing on a company's fundamentals and, as such, may not match with a report on a company's
fundamentals. Investors are advised to refer the Fundamental and Technical Research Reports available on our website to evaluate the
contrary view, if any.
The information in this document has been printed on the basis of publicly available information, internal data and other reliable
sources believed to be true, but we do not represent that it is accurate or complete and it should not be relied on as such, as this
document is for general guidance only. Angel Broking Pvt. Limited or any of its affiliates/ group companies shall not be in any way
responsible for any loss or damage that may arise to any person from any inadvertent error in the information contained in this report.
Angel Broking Pvt. Limited has not independently verified all the information contained within this document. Accordingly, we cannot
testify, nor make any representation or warranty, express or implied, to the accuracy, contents or data contained within this document.
While Angel Broking Pvt. Limited endeavors to update on a reasonable basis the information discussed in this material, there may be
regulatory, compliance, or other reasons that prevent us from doing so.
This document is being supplied to you solely for your information, and its contents, information or data may not be reproduced,
redistributed or passed on, directly or indirectly.
Neither Angel Broking Pvt. Limited, nor its directors, employees or affiliates shall be liable for any loss or damage that may arise from
or in connection with the use of this information.
Disclosure of Interest Statement
Dr. Reddy’s Laboratories
1. Financial interest of research analyst or Angel or his Associate or his relative
No
2. Ownership of 1% or more of the stock by research analyst or Angel or associates or relatives
No
3. Served as an officer, director or employee of the company covered under Research
No
4. Broking relationship with company covered under Research
No
Ratings (Based on expected returns
Buy (> 15%)
Accumulate (5% to 15%)
Neutral (-5 to 5%)
over 12 months investment period):
Reduce (-5% to -15%)
Sell (< -15)
February 22, 2017
11