Initiating Coverage| HFC
April 5, 2016
Dewan Housing Finance Corporation
BUY
CMP
`189
Parallel play on “Housing for All”
Target Price
`270
Dewan Housing Finance Corporation Ltd (DHFL) is the third largest housing
Investment Period
12 Months
finance company in India with a market share of ~4%. With a focus on the low
and medium income (LMI) consumer segment, the company has increased its
Stock Info
presence in tier-II & III cities where the growth opportunity is immense. With strong asset
Sector
HFC
quality and healthy return ratios, the company is all set to witness its next leg of growth.
Market Cap (` cr)
5,547
DHFL is the 3rd largest private sector housing finance company with a scalable
Beta
1.5
business model: Given the present declining interest rate scenario, the housing
52 Week High / Low
268 / 141
finance industry is likely to emerge stronger. After delivering 39% AUM CAGR
Avg. Daily Volume
1,29,241
over FY2010-15, we expect DHFL to grow at a CAGR of 20% over FY2015-18, as
demand for housing in the middle & low income group is expected to pick up,
Face Value (`)
10
which is the focus area for the company. Backed by stable asset quality and firm
BSE Sensex
24,884
margins, DHFL has reported a 32% CAGR in PAT over FY2010-15 and we expect
Nifty
7,603
the same to grow by 21.3% (CAGR) over FY2015-18.
Reuters Code
DWNH.BO
Seasoned and granular loan book with stable asset quality: DHFL is a pioneer in
Bloomberg Code
DEWH.IN
the home loan business with nearly three decades of experience and has achieved
strong underwriting skills. Individual borrowers account for 75%, while the high
yielding loan against property (LAP) and projects loans account for 16% and 8% of
Shareholding Pattern (%)
advances, respectively. The company has increased its average ticket size from `0.59mn
Promoters
34.9
in FY2011 to `1.2mn by FY2015, while it has brought down its loan-to-value (LTV) from
MF / Banks / Indian Fls
2.0
61.8% to 46.9% during the same period. Despite strong loan growth, the GNPAs and
FII / NRIs / OCBs
35.9
NNPAs of the company are likely to be at ~1.05% and 0.71%, respectively, for FY2016.
We don’t expect any major deterioration in the asset quality going ahead.
Indian Public / Others
27.2
Lower cost of funds will help maintain NIM: After its rating having got upgraded
to AAA from AA+ earlier by CARE the incremental cost of funds for the company
has come down and is likely to continue to remain favorable. Nearly 70% of the
Abs.(%)
3m 1yr
3yr
bank borrowings are due for maturity over the next three years and swapping a
Sensex
(2.7)
(12.7)
34.9
part of that with non-convertible debentures (NCDs), where it has ~100bp cost
DHFL
(17.8)
(18.9)
137.0
benefit, will help DHFL in maintaining its NIM at ~2.86%.
NHB’s move to reduce risk weightage will help further leveraging: The National
Housing Bank (NHB) has recently revised LTV to as high as 90% for home loans
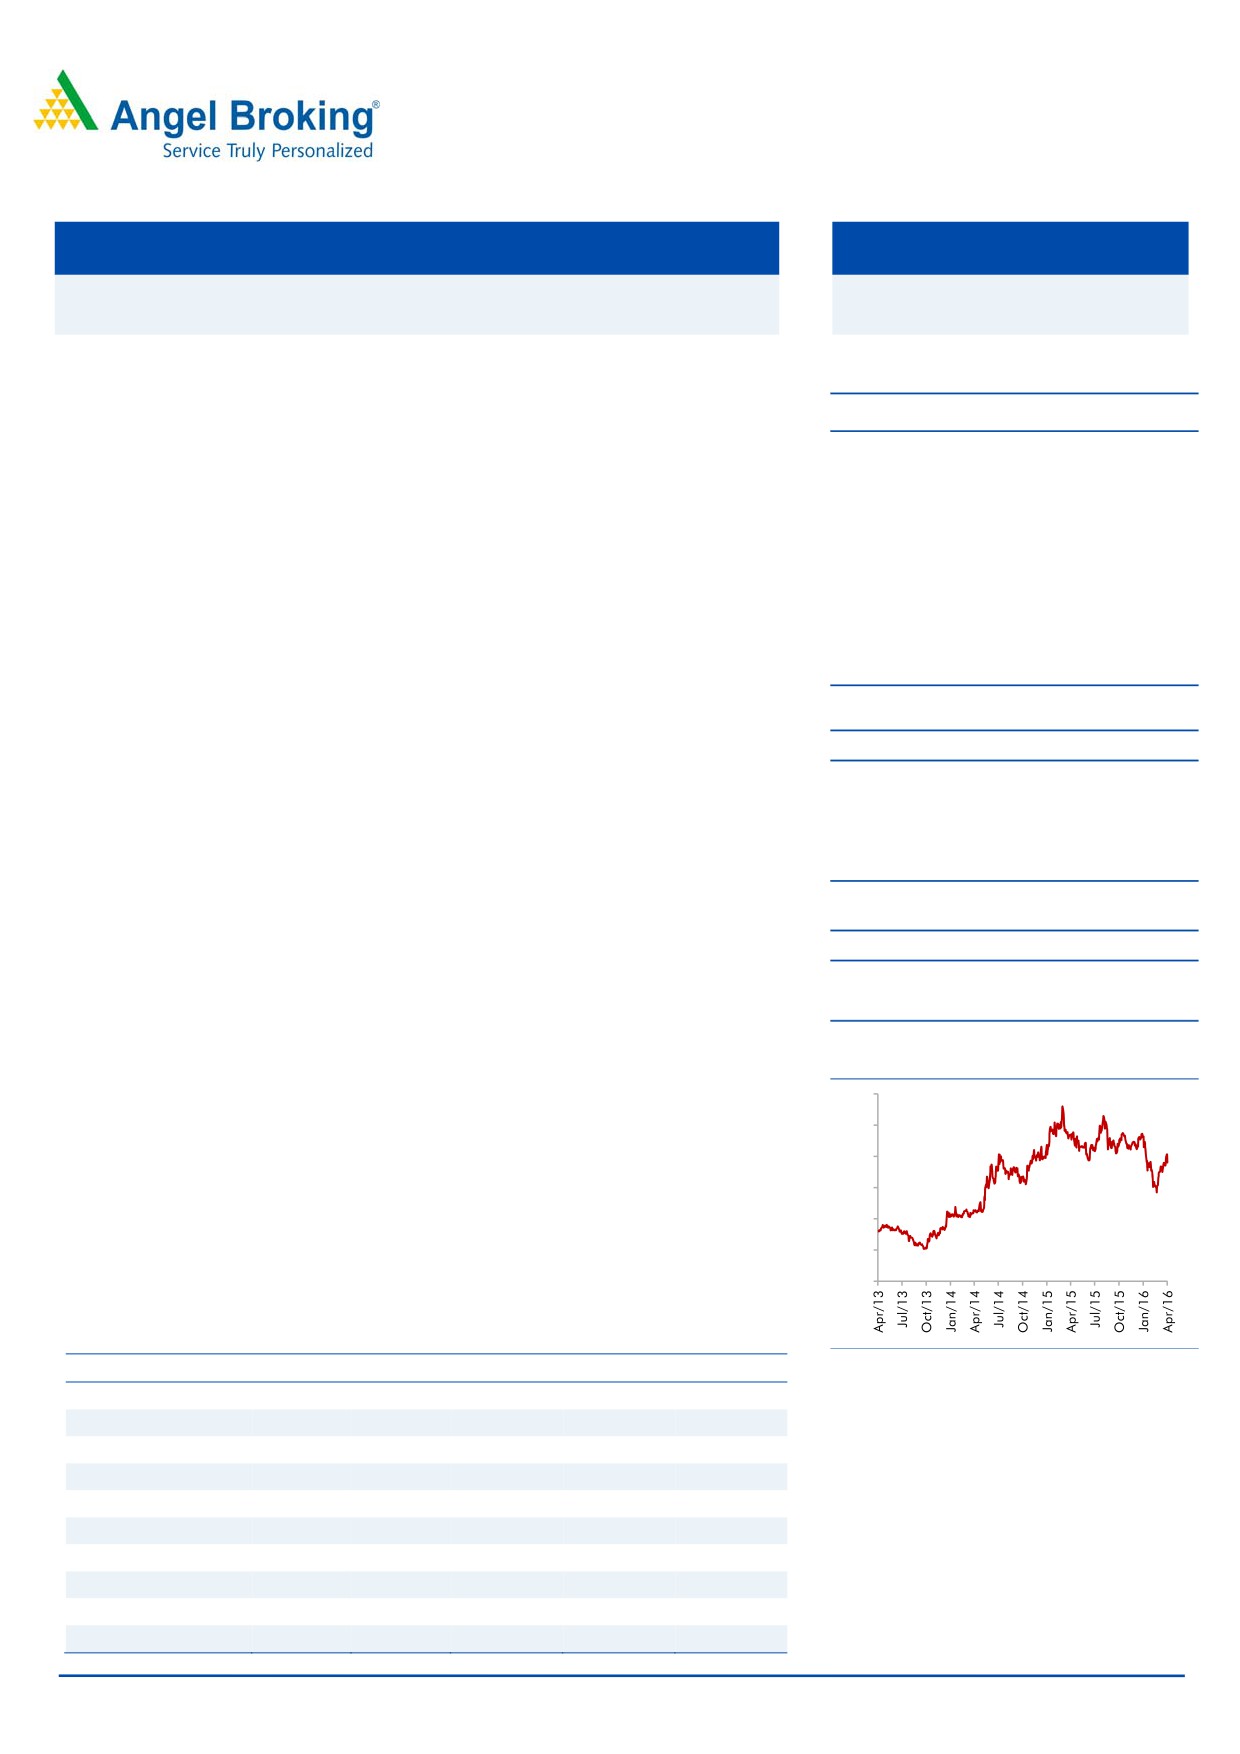
3-Year Daily Price Chart
upto `30lakh against `20lakh earlier and reduced the risk weightage on the
300
same to 35% vs 50% earlier. This move will give a fillip to the affordable home
250
segments. DHFL being a key player in this segment will be able to growth its
200
balance sheet by further increasing its leverage, with lower incremental capital
requirement. Further the promoters have subscribed warrants worth `500cr,
150
which will improve the CAR (which currently stands at 16.4%).
100
Outlook and valuation: We expect the company to post a healthy loan book
50
CAGR of 20% over FY2015-18E, which is likely to translate in an earnings CAGR
-
of 21.3%, over the same period. The stock currently trades at 0.8x FY2018E ABV.
We recommend a Buy on the stock, with a target price of `270.
Key Financials (Standalone)
Source: Company, Angel Research
Y/E March (` cr)
FY2014
FY2015
FY2016E
FY2017E
FY2018E
NII
888
1,256
1,621
1,993
2,431
% chg
30.9
41.5
29.0
22.9
22.0
Net profit
527
620
757
898
1,107
% chg
14.8
17.8
22.0
18.7
23.2
NIM (%)
2.4
2.8
2.9
2.9
2.7
Siddharth Purohit
EPS (`)
20.5
21.3
25.9
30.8
35.4
022 - 3935 7800 Ext: 6872
P/E (x)
8.6
8.3
6.8
5.8
5.0
P/ABV (x)
1.4
1.2
1.0
0.9
0.8
Chintan Shah
RoA (%)
1.3
1.3
1.2
1.2
1.1
022 - 4000 3600 Ext: 6828
RoE (%)
15.5
15.1
15.3
15.9
16.4
Source: Company, Angel Research; Note: CMP as of April 5, 2016
Please refer to important disclosures at the end of this report
1
Dewan Housing Finance | Initiating Coverage
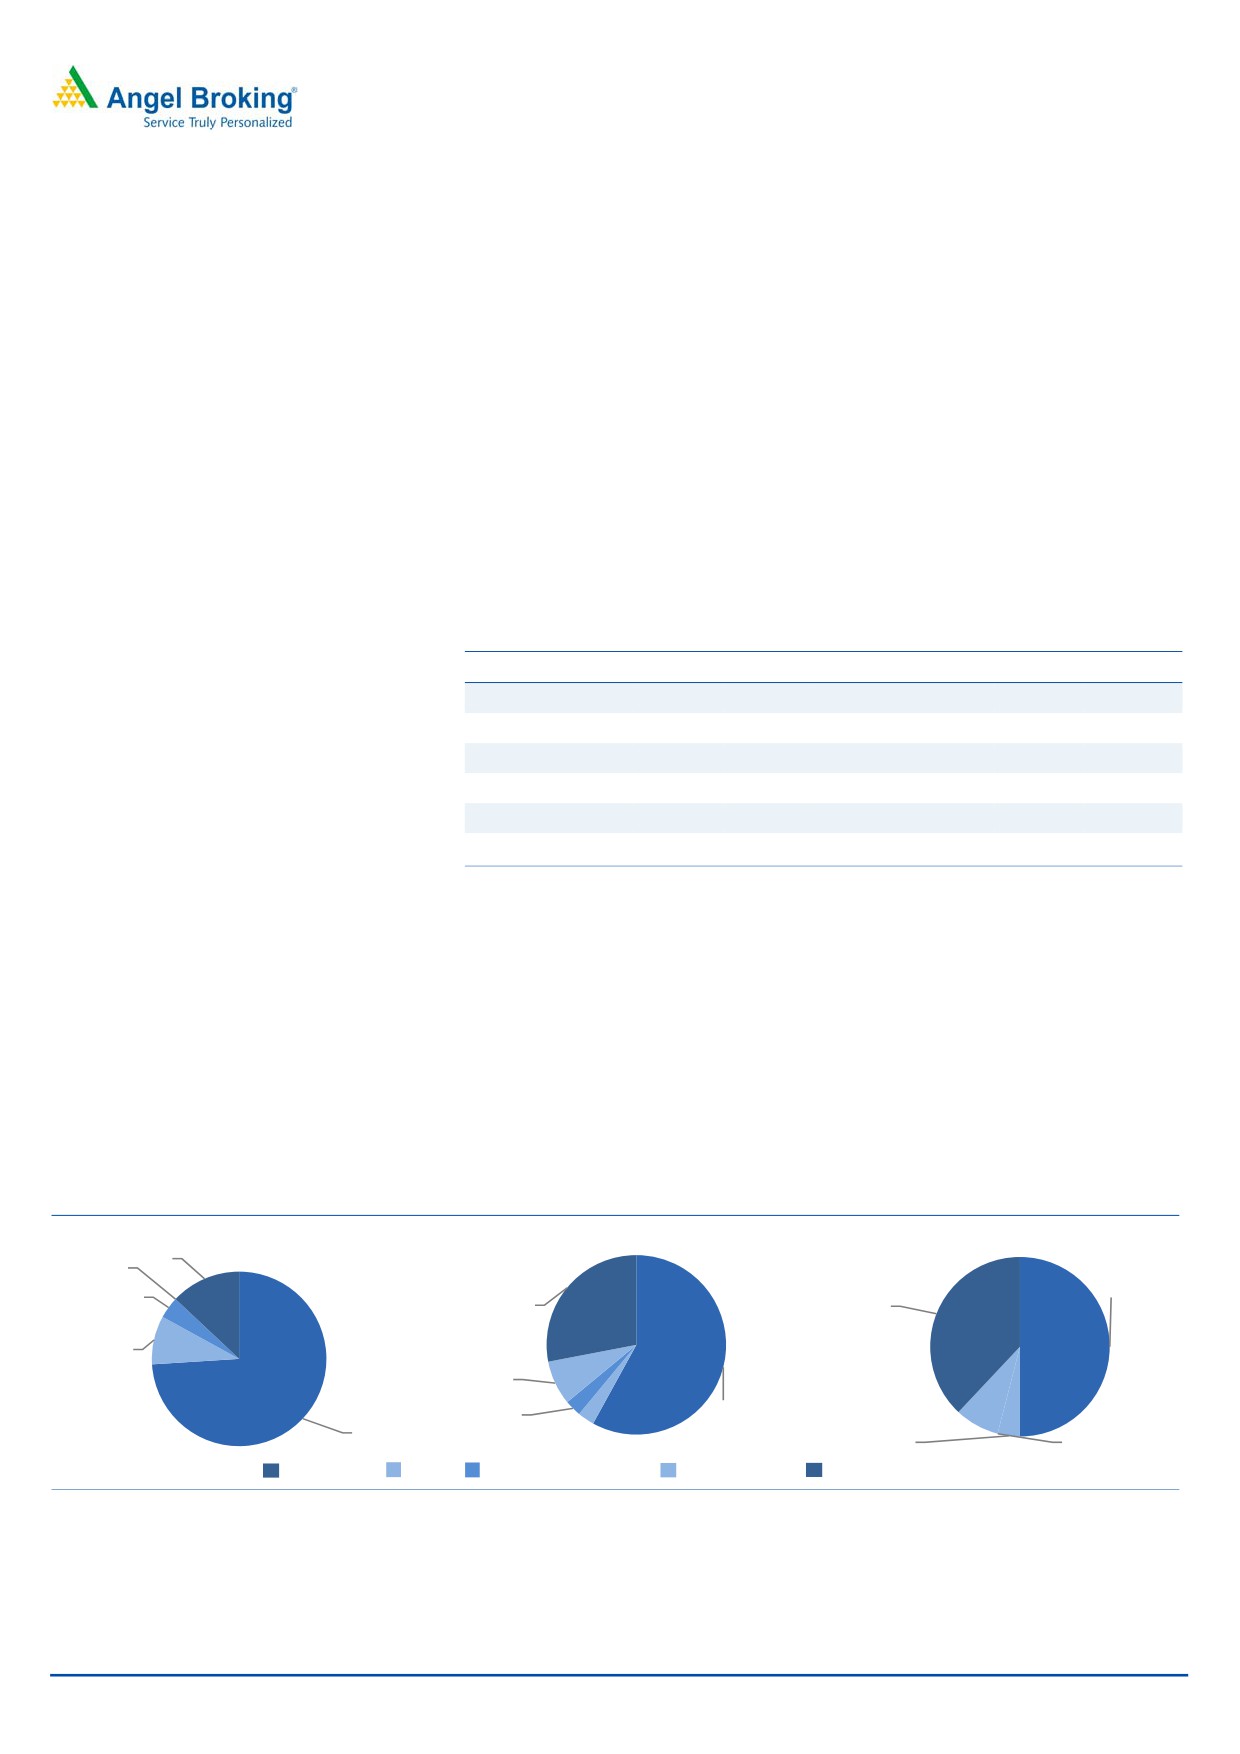
Seasoned and granular loan book gaining further strength: DHFL has a diversified
loan book, with individual borrowers accounting for 75% of the advances. Within
the retail loan book, 60% of the advances are towards purchase of flats, 13% is
accounted by the self construction segment, while the high yielding LAP and
projects loans account for 16% and 8%, respectively. Loans to the individual
segment normally carry a low risk of default as has been historically witnessed.
Loans to builders are generally perceived to be risky; still, DHFL has so far been
able to manage this loan portfolio with minimum NPAs.
Based on customer profile the company’s loan book is well diversified with ~60%
of it accounted by service holders, within which ~18% is towards government
employees while the balance is accounted by private sector employee. In order to
diversify its client base DHFL over the last few years has increased advances to the
self-employed segment which now accounts for 34% of the loan book compared to
19% in FY2011. The company is also engaged in funding the construction of
educational institutes which accounts for 4% of the loan book. Further, the
company has recently forayed into lending to the SME segment, which accounts for
2% of the total loan portfolio. The company doesn’t intend to go aggressive on
MSE loans although it believes that the segment has strong growth prospects and
the potential to offer attractive yields.
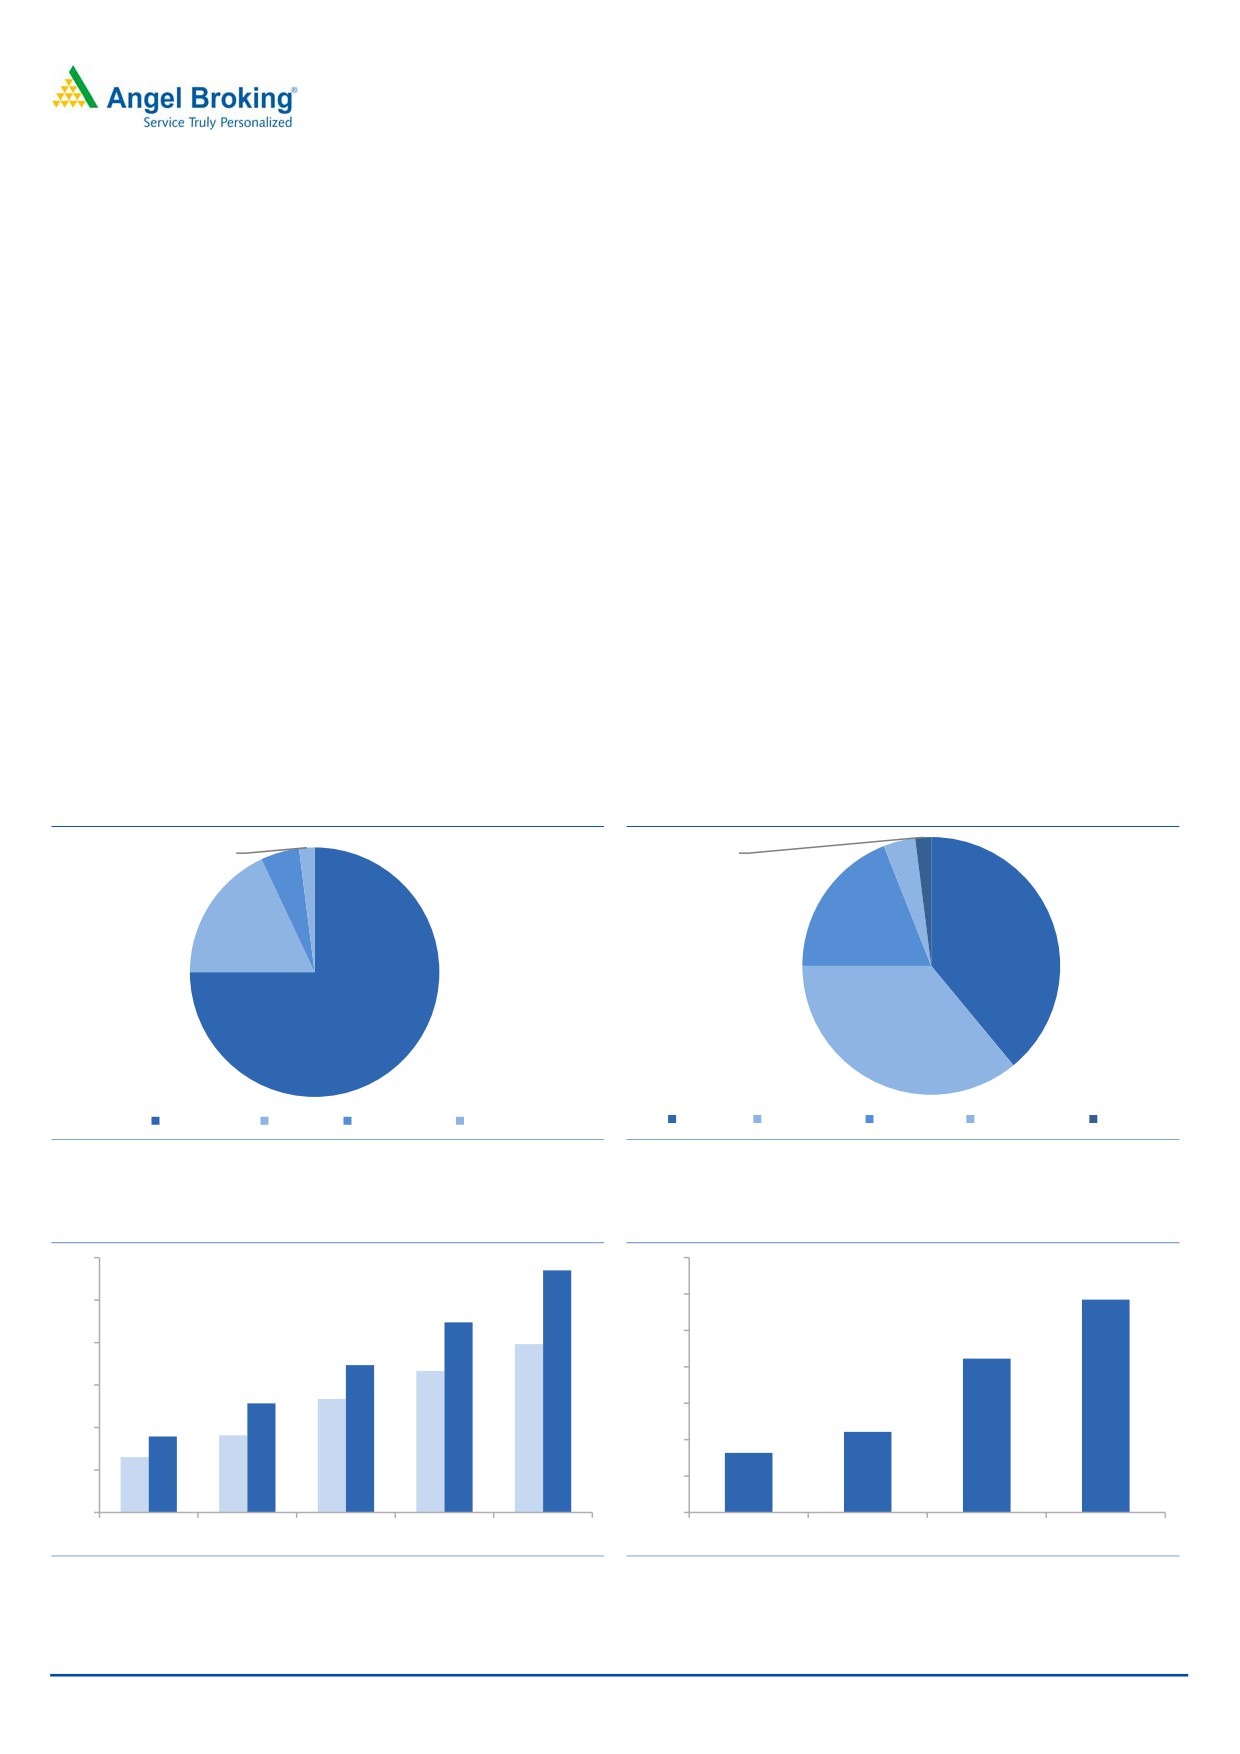
Exhibit 1: Retail Oriented loan book growing strong
Exhibit 2: Diversified customer profile
2%
2%
4%
5%
19%
18%
39%
75%
36%
Home Loans LAP/LRD Project Loans
Others
Company Self Employed Govt Others Educational Inst Others
Source: Company, Angel Research
Source: Company, Angel Research
Exhibit 3: Strong growth in sanctions & disbursements
Exhibit 4: Securitized portfolio ( In Rs cr)
300
285
7,000
5,845
6,000
250
224
198
5,000
200
4,225
173
167
4,000
150
129
134
3,000
90
91
2,215
100
65
2,000
1,638
50
1,000
0
0
FY11
FY12
FY13
FY14
FY15
FY12
FY13
FY14
FY15
Source: Company, Angel Research
Source: Company, Angel Research
April 5, 2016
2
Dewan Housing Finance | Initiating Coverage
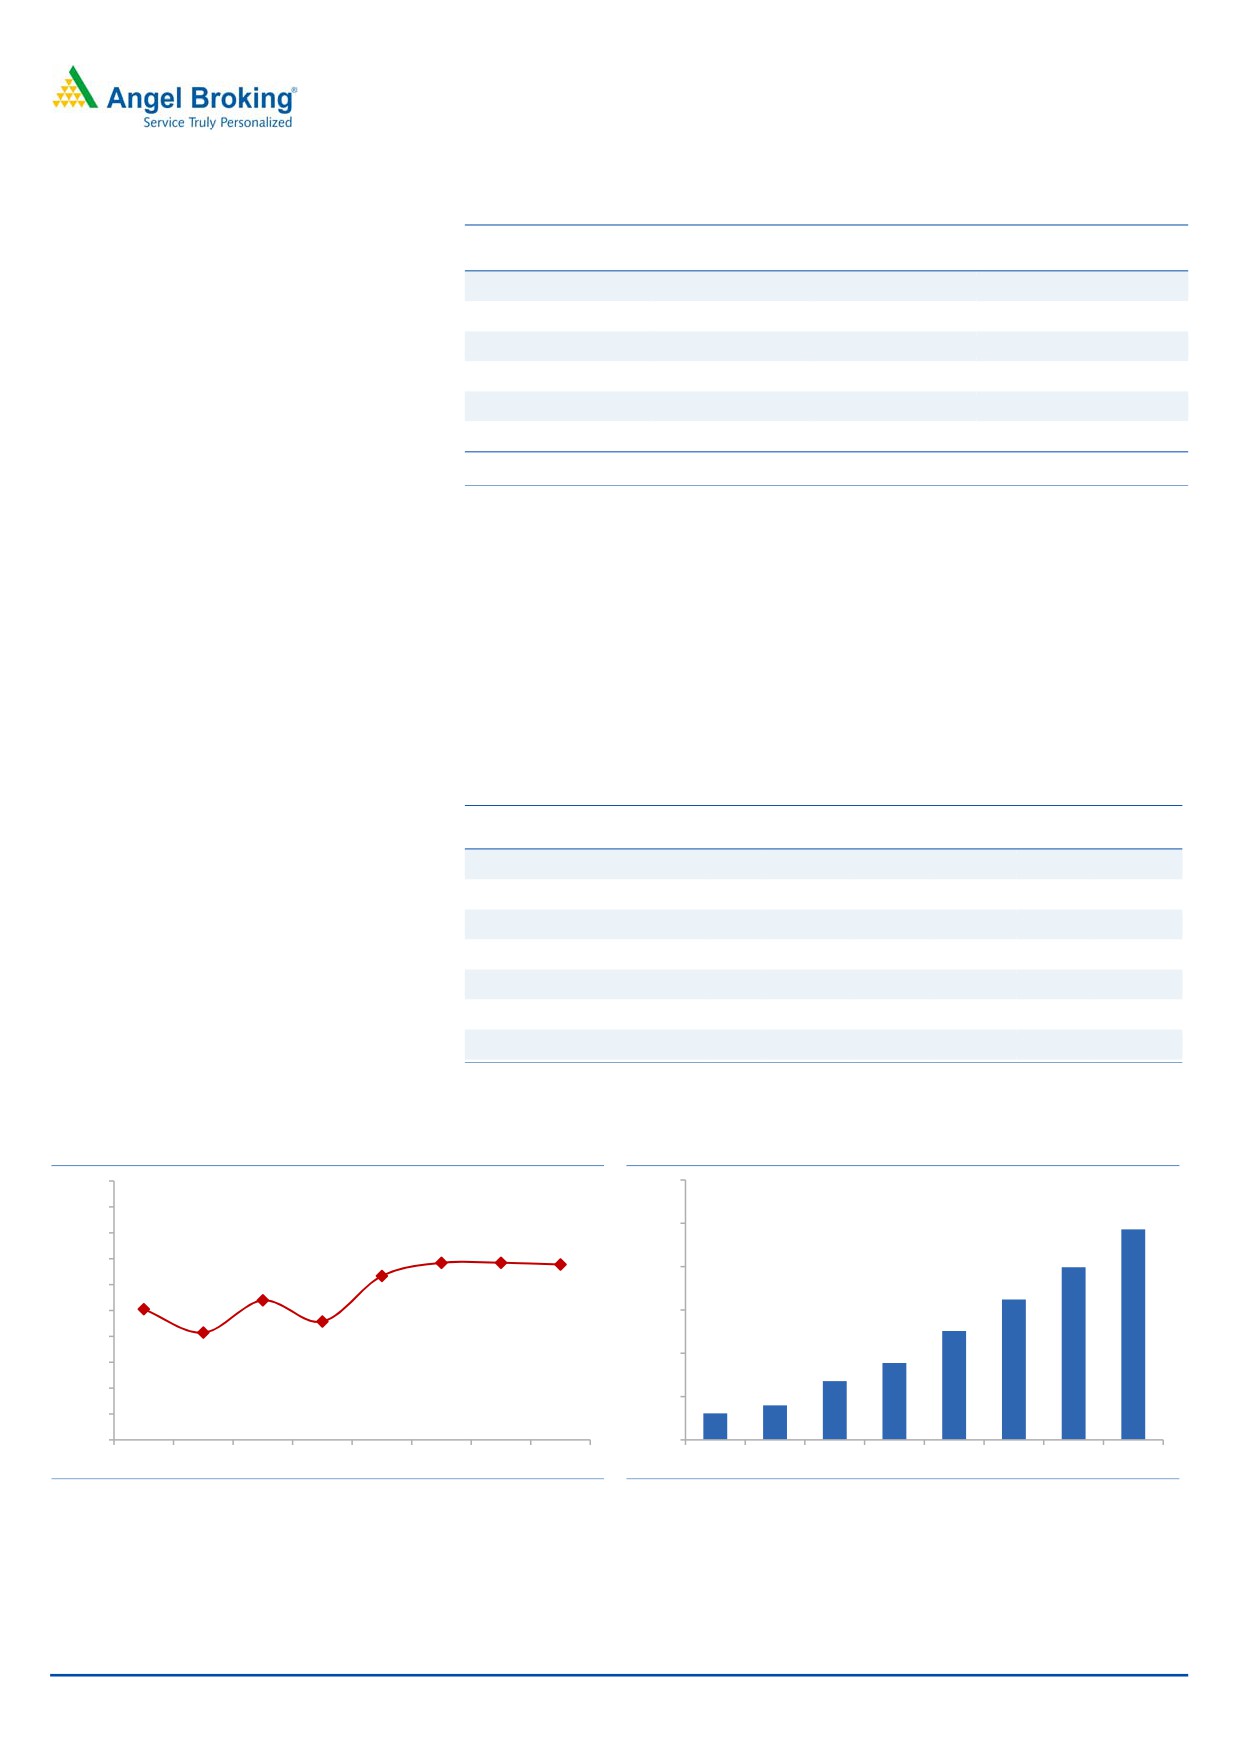
Increase in average ticket size with a simultaneous reduction in LTV: The company
has increased its average ticket size from `0.59mn in FY2011 to `1.2mn by
FY2015, while on the other hand it has brought down its blended LTV from 61.8%
to 46.9% during the same period. Lower LTV reduces the incremental risk in case
of a default while simultaneously increasing the average ticket size helps in
meeting business growth. Both the moves are certainly a positive for the long term
growth of the company.
DHFL also maintains a decent income to installment ratio of 39%, in line with the
industry, which is a key indicator of borrowers’ repayment capability. Increase in
average ticket size can largely be attributed to inflation in real-estate prices. The
incremental average ticket size of the company in the home loan segment has
risen to ~`18 lakhs, which again is in line with the industry. While in the LAP
segment, the average ticket size stands at `25 lakhs and the incremental ticket size
is at `28 lakhs.
In the builder loan segment DHFL normally lends to mid and small sized builders.
Ideally the loans are given for entire projects and not just for working capital. This
ensures enough security as it gets the first charge on the receivables from the
proceeds in case of liquidation. The average ticket size for builder loans remains at
`20cr and the incremental ticket size is at ~`30cr.
Exhibit 5: Segmental Ticket Size (Average & Incremental)
Category
Incremental
Average
Home Loan
`18 lakhs
`12 lakhs
LAP
`28 lakhs
`25 lakhs
Builder Loan
`30cr
`20cr
Source: Company, Angel Research
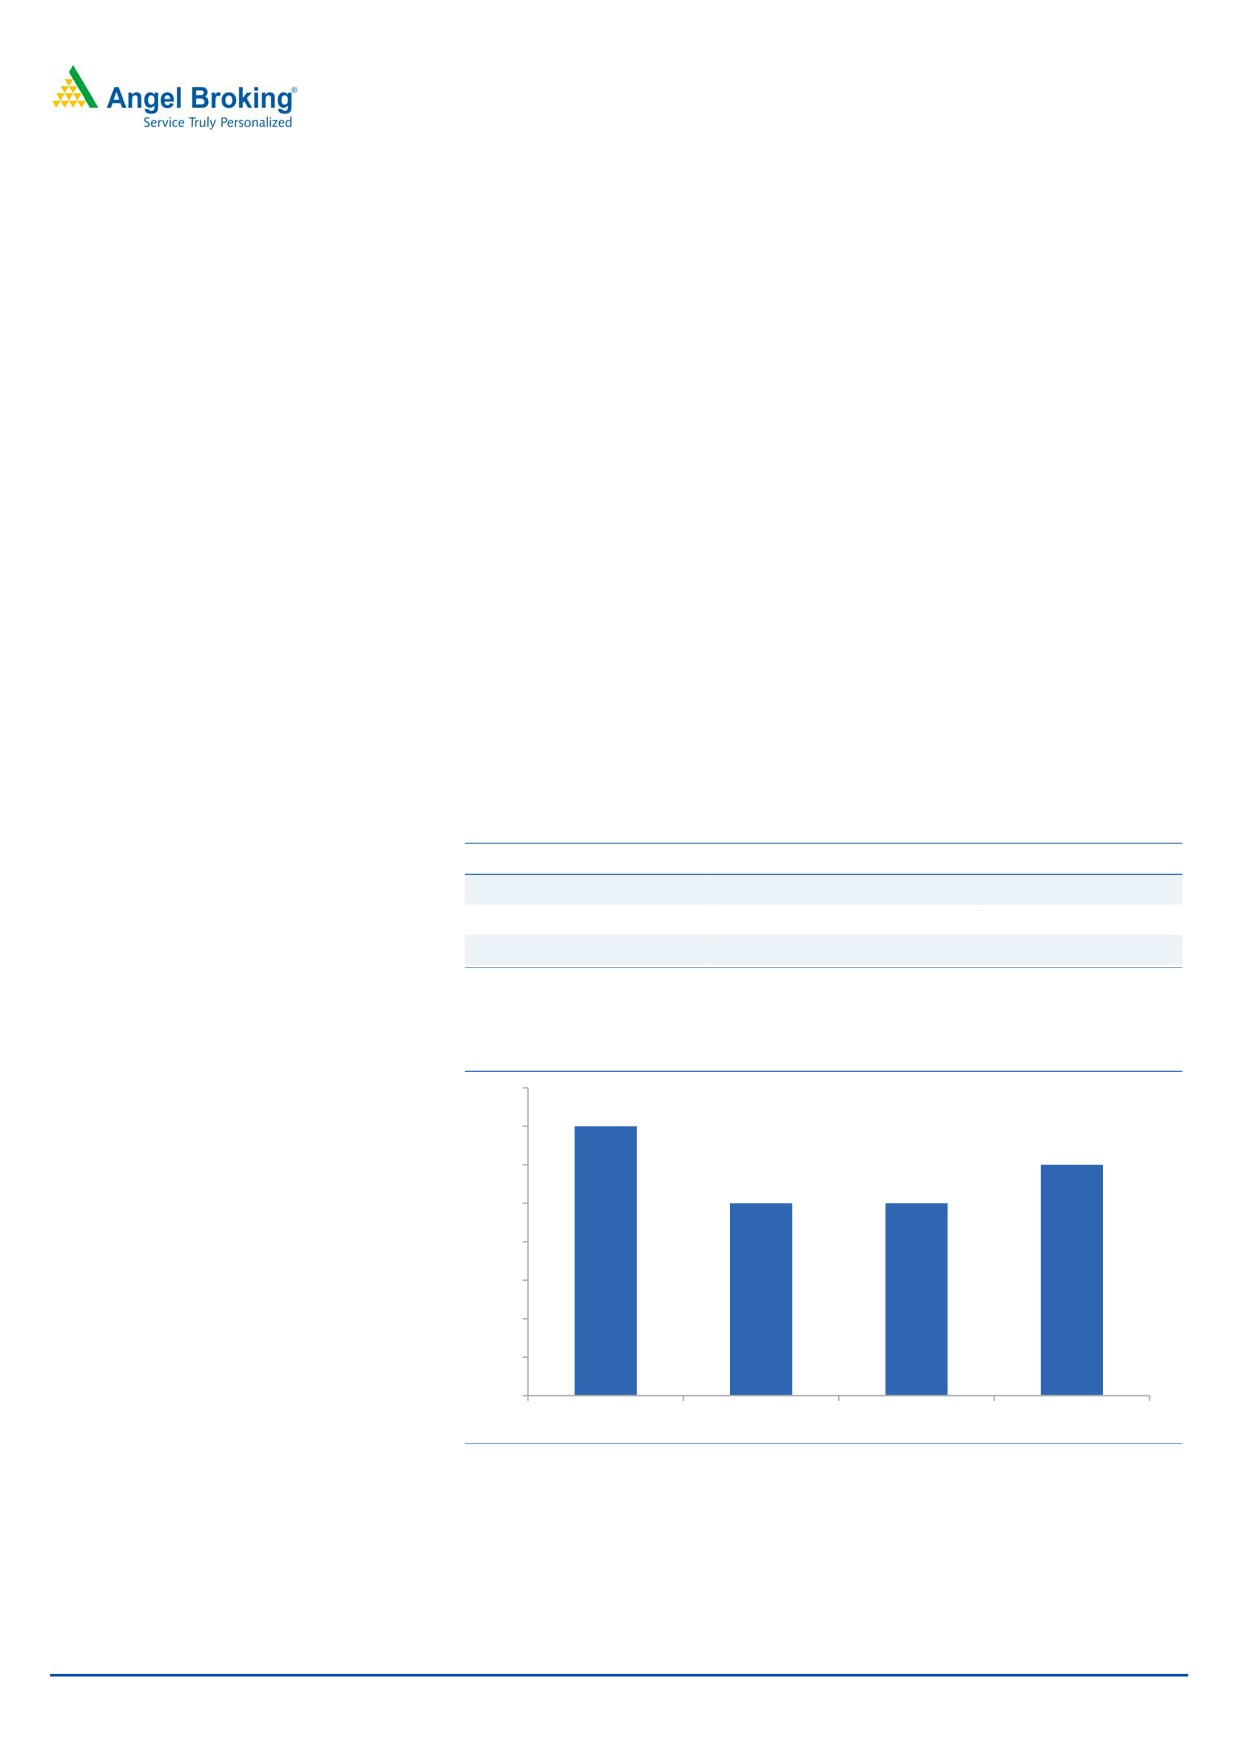
Exhibit 6: Segmental LTV
80
70
70
60
60
50
50
50
40
30
20
10
0
Home Loans
LAP
Projects
SME
Source: Company, Angel Research
April 5, 2016
3
Dewan Housing Finance | Initiating Coverage
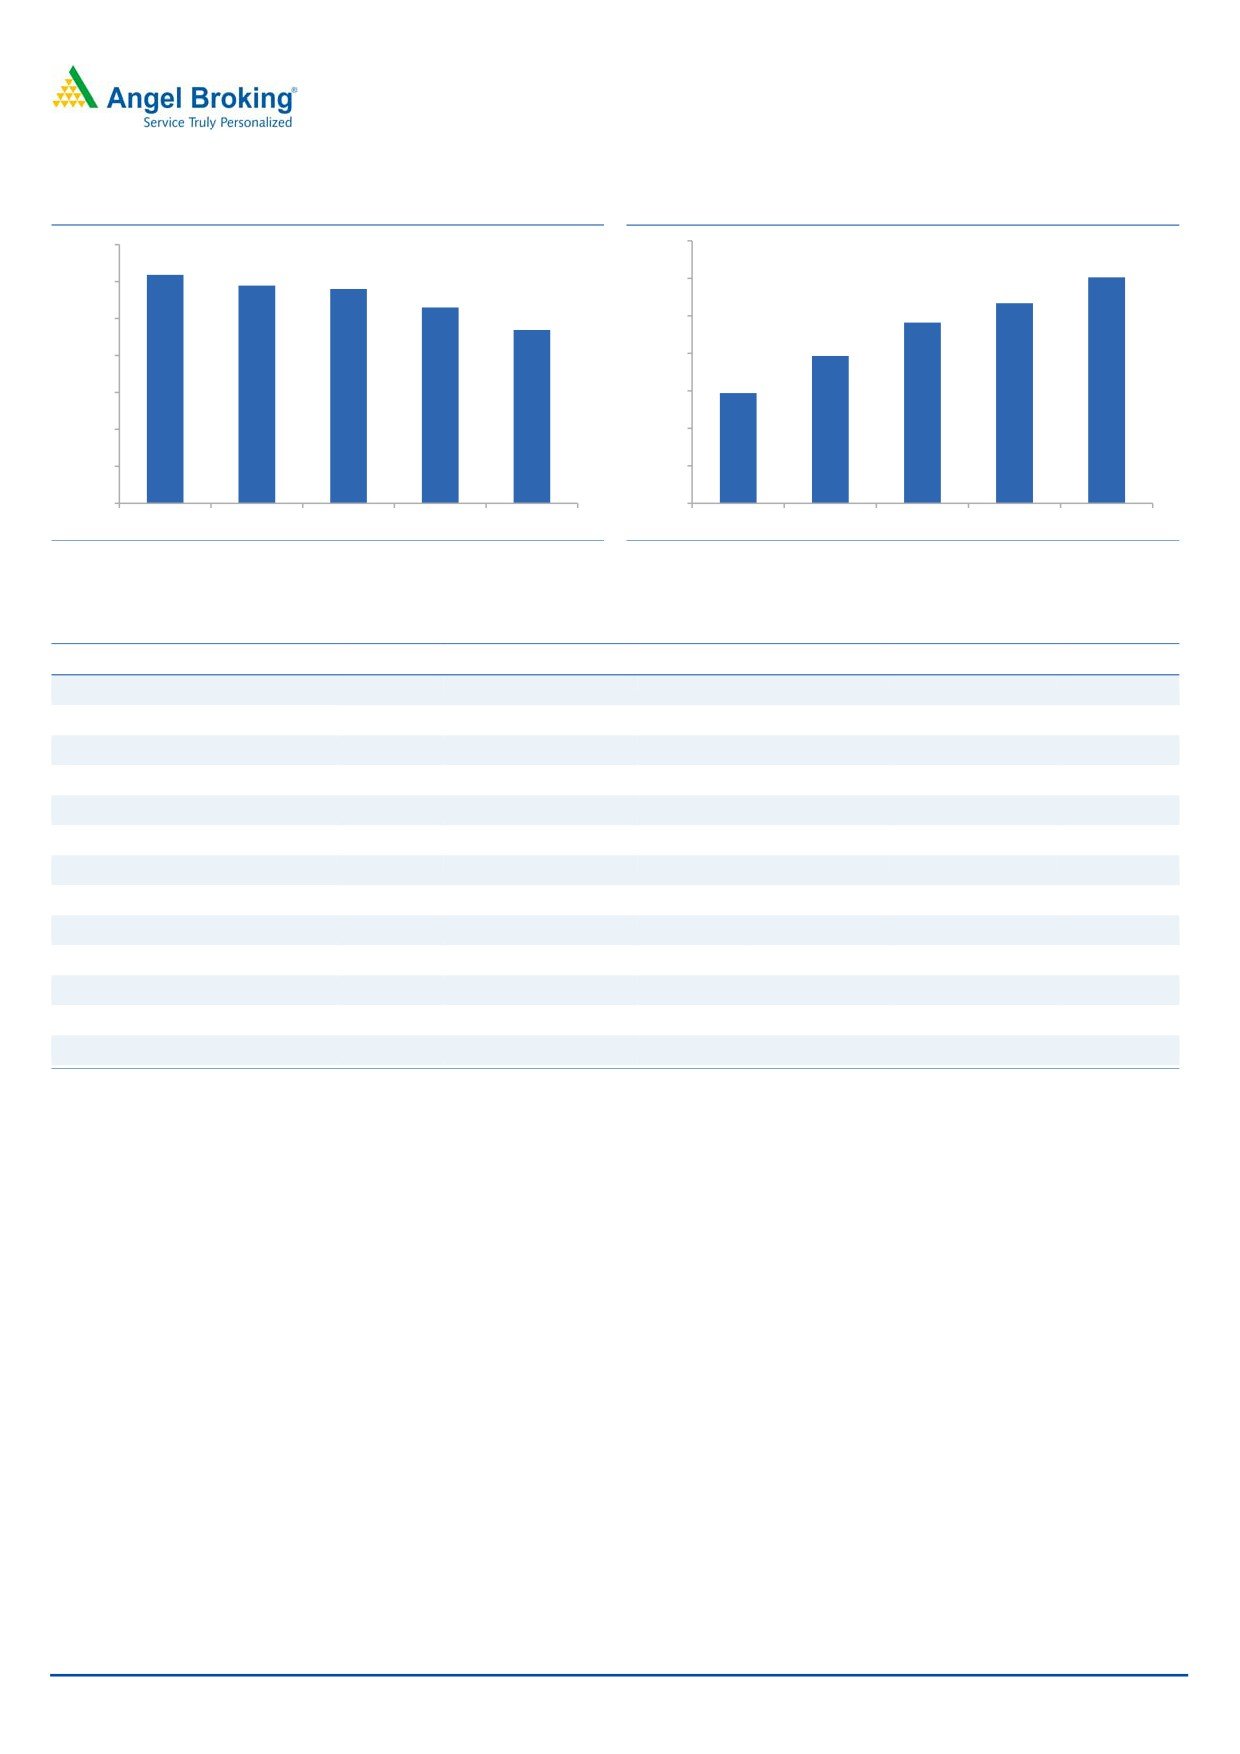
Exhibit 7: Decreasing LTV (Blended)
Exhibit 8: Average Ticket Size (In Rs mn)
70.0%
1.40
61.8%
1.20
58.9%
58.0%
60.0%
1.20
53.0%
1.07
0.96
46.9%
1.00
50.0%
0.79
40.0%
0.80
0.59
30.0%
0.60
20.0%
0.40
10.0%
0.20
0.0%
-
FY11
FY12
FY13
FY14
FY15
FY11
FY12
FY13
FY14
FY15
Source: Company, Angel Research
Source: Company, Angel Research
Exhibit 9: Comparative data
Name of the Company
DHFL
India Bulls Housing
REPCO
LIC Housing
Can Fin Homes
HDFC Ltd
Loan Bifurcation
Retail
74
76
81
91
84
69
Non Retail
26
24
19
9
16
31
Of Which
LAP
16
0
19
6
0
0
Developer
6
0
0
3
0
30
Average Ticket Size
Housing Loan ( Rs Lakhs)
12
25
12
18.2
17.3
25
Non Housing Loan
25
73
12.8
LTV %
LTV %
49.1
71
62
50-60
63
65
LTV
Instalment to Income Ratio
39.2
NA
50
30-40
50
0
Source: Company, Angel Research
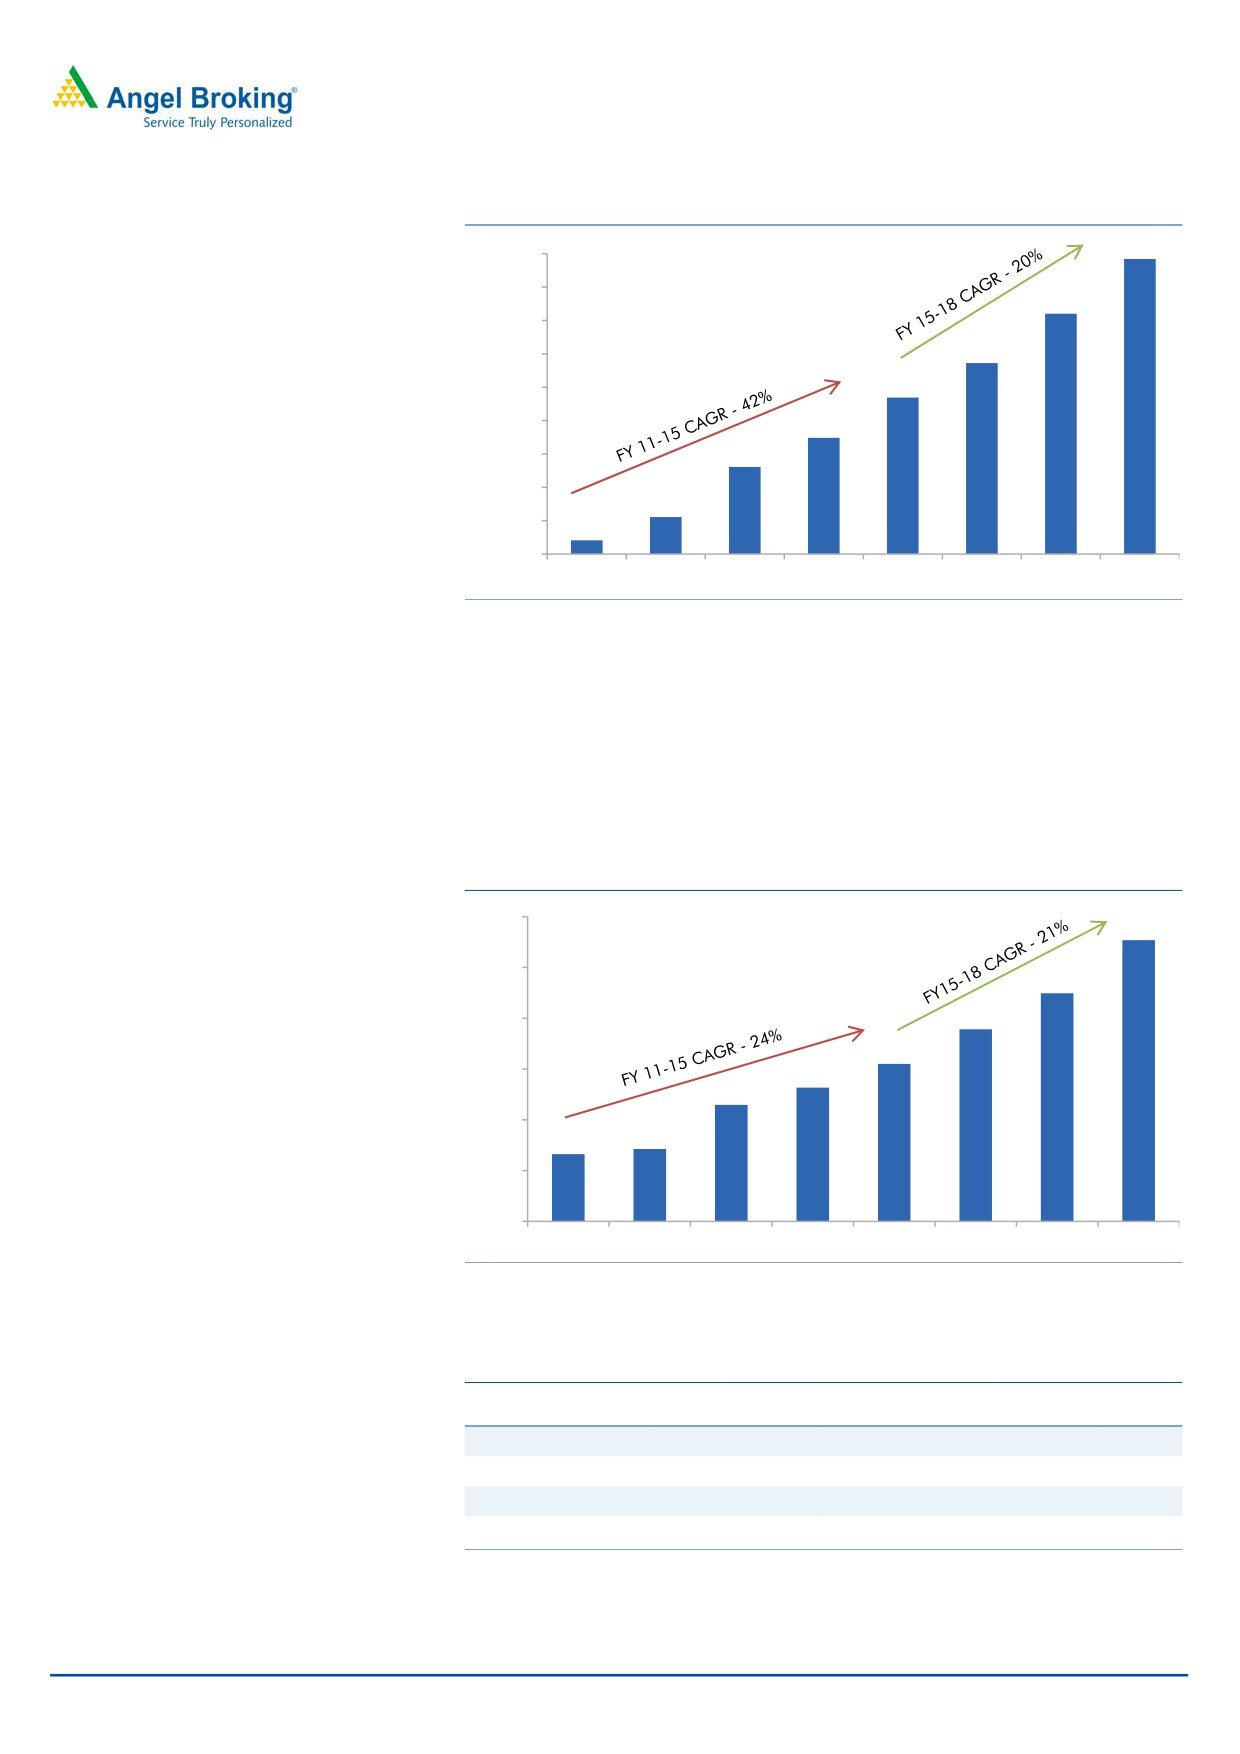
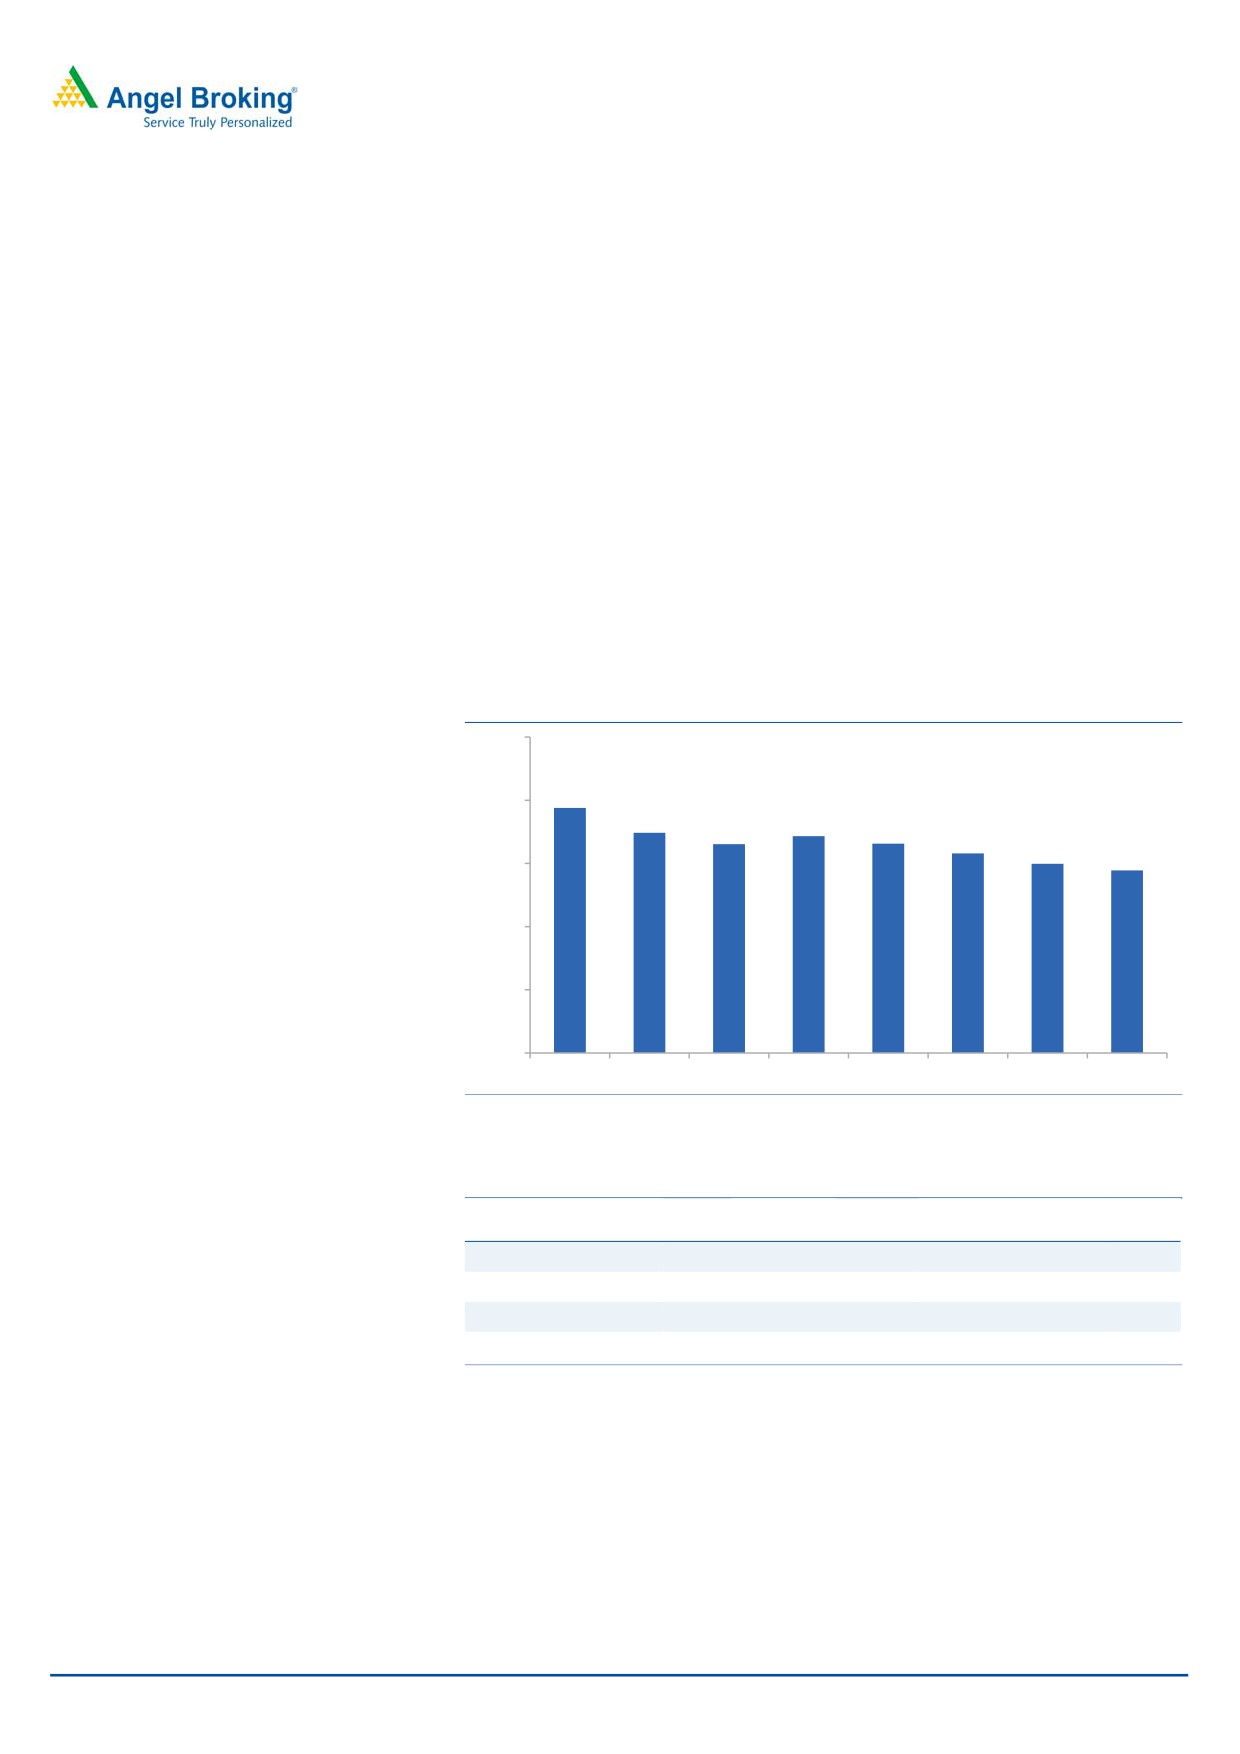
Company expected to report AUM CAGR of 20% and PAT CAGR of 21.3% over
FY2015-18: DHFL has delivered 39% AUM CAGR over FY2010-15, backed by
increasing geographical penetration and higher incremental average ticket size of
its loans. The company has been able to increase the average ticket size of its loan
portfolio on a continuous basis. The incremental average ticket size, at `17 lakhs,
is ~40% higher than the average ticket size of `12 lakhs for FY2015. In our view,
this higher incremental loan size together with widening market share would
propel growth for the company going ahead.
We expect the company to deliver AUM CAGR of 20% over FY2015-18, as
demand for housing in the middle and low income group is expected to pick up,
on the back of lower interest rates and the governments thrust on affordable
housing.
April 5, 2016
4
Dewan Housing Finance | Initiating Coverage
Exhibit 10: AUM trend ( In Rs Cr )
98,411
100,000
90,000
82,009
80,000
67,221
70,000
56,884
60,000
50,000
44,822
36,117
40,000
30,000
21,095
20,000
14,111
10,000
FY11
FY12
FY13
FY14
FY15
FY16E
FY17E
FY18E
Source: Company, Angel Research
DHFL has maintained healthy asset quality with Gross NPA at 0.99% in FY2015
and decent margins in the range of 2.70% to 2.89% in FY2015 (2.87% in
9MFY2016). As a result it has been able to achieve a 32% CAGR in PAT over
FY2010-15. We do not expect any material change in the asset quality and
margins and hence expect the company to deliver 21.3% growth in PAT over
FY2015-18.
Exhibit 11: PAT growth likely to remain strong
1,200
1,107
1,000
898
757
800
620
600
527
459
400
265
285
200
0
FY11
FY12
FY13
FY14
FY15
FY16E
FY17E
FY18E
Source: Company, Angel Research
Exhibit 12: Comparative AUM of HFCs
India Bulls
Can
HDFC
(` Cr)
DHFL
REPCO LIC Housing
Housing
Fin Homes
Ltd
AUM (31 Dec 2015)
65,962
62,265
7,154
1,17,396
9,895
2,48,097
5 Yr AUM CAGR %
42.1%
36.5%
33.8%
23.3%
34.5%
15.3%
AUM March 2010
9,804
11,023
1,400
38,081
1,887
1,11,763
AUM March 2015
56,884
52,235
6,013
1,08,361
8,302
2,27,700
Source: Company, Angel Research
April 5, 2016
5
Dewan Housing Finance | Initiating Coverage
Increased sourcing of funds from capital markets will help reduce cost of funds:
The company intends to reduce its dependence on bank borrowings and rely more
on capital markets for meeting its funding requirements, which is cost effective and
the same has resulted in lower cost of funds at 10.28% in FY2015 vs 10.85% in
FY2012. During the same period, the share of bank borrowings came down to
58% from 70%, while the share of capital market borrowings went up to 28% from
18%. For 9MFY2016 the cost of funds has further come down to 9.60% vs 10.33%
in the corresponding period of the previous year and the share of funding from
capital markets has increased to 32%.
We believe there is enough headroom for the company to reduce its cost of funds
by migrating from bank loans to other instruments like NCDs as ~`22,000cr
worth of bank loans are due for maturity in the next three years, while some part of
it could be migrated towards other instruments of borrowings.
Exhibit 13: Funding Mix
Cost of Funds
FY10
FY11
FY12
FY13
FY14
9MFY16
Banks & FIs
10.01%
11.41%
11.02%
11.00%
10.81%
10.16%
NHB
7.58%
7.63%
7.99%
8.04%
7.93%
7.59%
Capital Markets
9.72%
9.92%
10.06%
9.84%
9.49%
9.00%
Multilateral Agencies
9.27%
9.79%
10.03%
10.73%
8.56%
8.21%
Fixed Deposits
9.49%
10.04%
10.59%
10.56%
10.34%
9.65%
WACB (Day end)
9.73%
10.85%
10.63%
10.59%
10.28%
9.60%
Source: Company, Angel Research
The company also enjoys AAA rating, the highest financial rating by CARE, which
helps the company in availing to lower cost of funds. We expect the company to be
able to further cut down on its cost of funds with the RBI on a rate cutting spree.
Cuts in the repo rate will reduce the borrowing cost via NCDs, which is a focus
area for the company. Over the next three years the company intends to reduce
the share of bank borrowings in total capital to 45% from the current ~55% and
replace the same via low cost funds raised from the capital markets, primarily
through NCDs.
Exhibit 14: Composition of Funding
FY 2011
FY 2015
FY 2018E
13%
0%
4%
50%
28%
38%
9%
8%
3%
58%
8%
74%
3%
4%
0%
Banks & Fls
NHB
Multilateral Agencies
Fixed Deposits
Capital Markets
Source: Company, Angel Research
April 5, 2016
6
Dewan Housing Finance | Initiating Coverage
Exhibit 15: Maturity profile of borrowings and loans
Borrowings
Market
Housing &
` (In crs)
from Banks
Borrowings
Property Loans
Upto 1 yr
4,574
6,237
2,158
Upto 3 yrs
22,219
13,026
12,901
Upto 5 yrs
28,022
14,962
18,277
Upto 7 yrs
31,285
16,227
26,549
Upto 10 yrs
31,343
16,434
50,852
Above 10 yrs
-
-
-
Total
31,483
17,438
51,040
Source: Company, Angel Research
NIM likely to stabilize going ahead: DHFL’s NIM has improved on the back of
lower cost of funds through higher incremental funding from low cost NCDs.
However, with housing finance being a very competitive business, we don’t expect
substantial improvement in the NIM and expect the same to cross 3% any time
soon. We believe the company would intend to pass on any cost benefit to its
borrowers and try to gain market share instead of purely focusing on improving its
NIM.
Exhibit 16: Comparative Return Ratios
India Bulls
LIC
Can Fin
HDFC
Name of the Company
DHFL
REPCO
Housing
Housing
Homes
Ltd
ROE % ( 9m FY16 Annualised)
19.3
27
16.1
19.2
16.9
18
ROA % ( 9m FY16 Annualised)
1.6
3.6
2.2
1.52
1.6
2.4
NIM % ( (9mFY16)
2.9
NA
4.4
2.6
3.2
3.9
Cost/ Income
26.3
19.2
21.3
16.3
18.2
7.6
Yield On Assets %
12.6
12.6
12.6
10.8
11.2
11.1
Cost of Funds %
9.6
9.4
9.6
9.2
9.0
8.6
Spread %
3.0
3.2
3.0
2.1
2.2
2.6
Source: Company, Angel Research
Exhibit 17: NIM likely to remain healthy
Exhibit 18: NII growth trend
3.5%
3,000
3.3%
2,431
2,500
3.1%
2.9%
2.9%
2.9%
2.8%
1,993
2.9%
2,000
2.6%
1,621
2.7%
2.5%
2.4%
2.5%
2.3%
1,500
1,256
2.3%
888
1,000
2.1%
678
1.9%
399
500
307
1.7%
1.5%
0
FY11
FY12
FY13
FY14
FY15
FY16E FY17E FY18E
FY11
FY12
FY13
FY14
FY15
FY16E FY17E FY18E
Source: Company, Angel Research
Source: Company, Angel Research
April 5, 2016
7
Dewan Housing Finance | Initiating Coverage
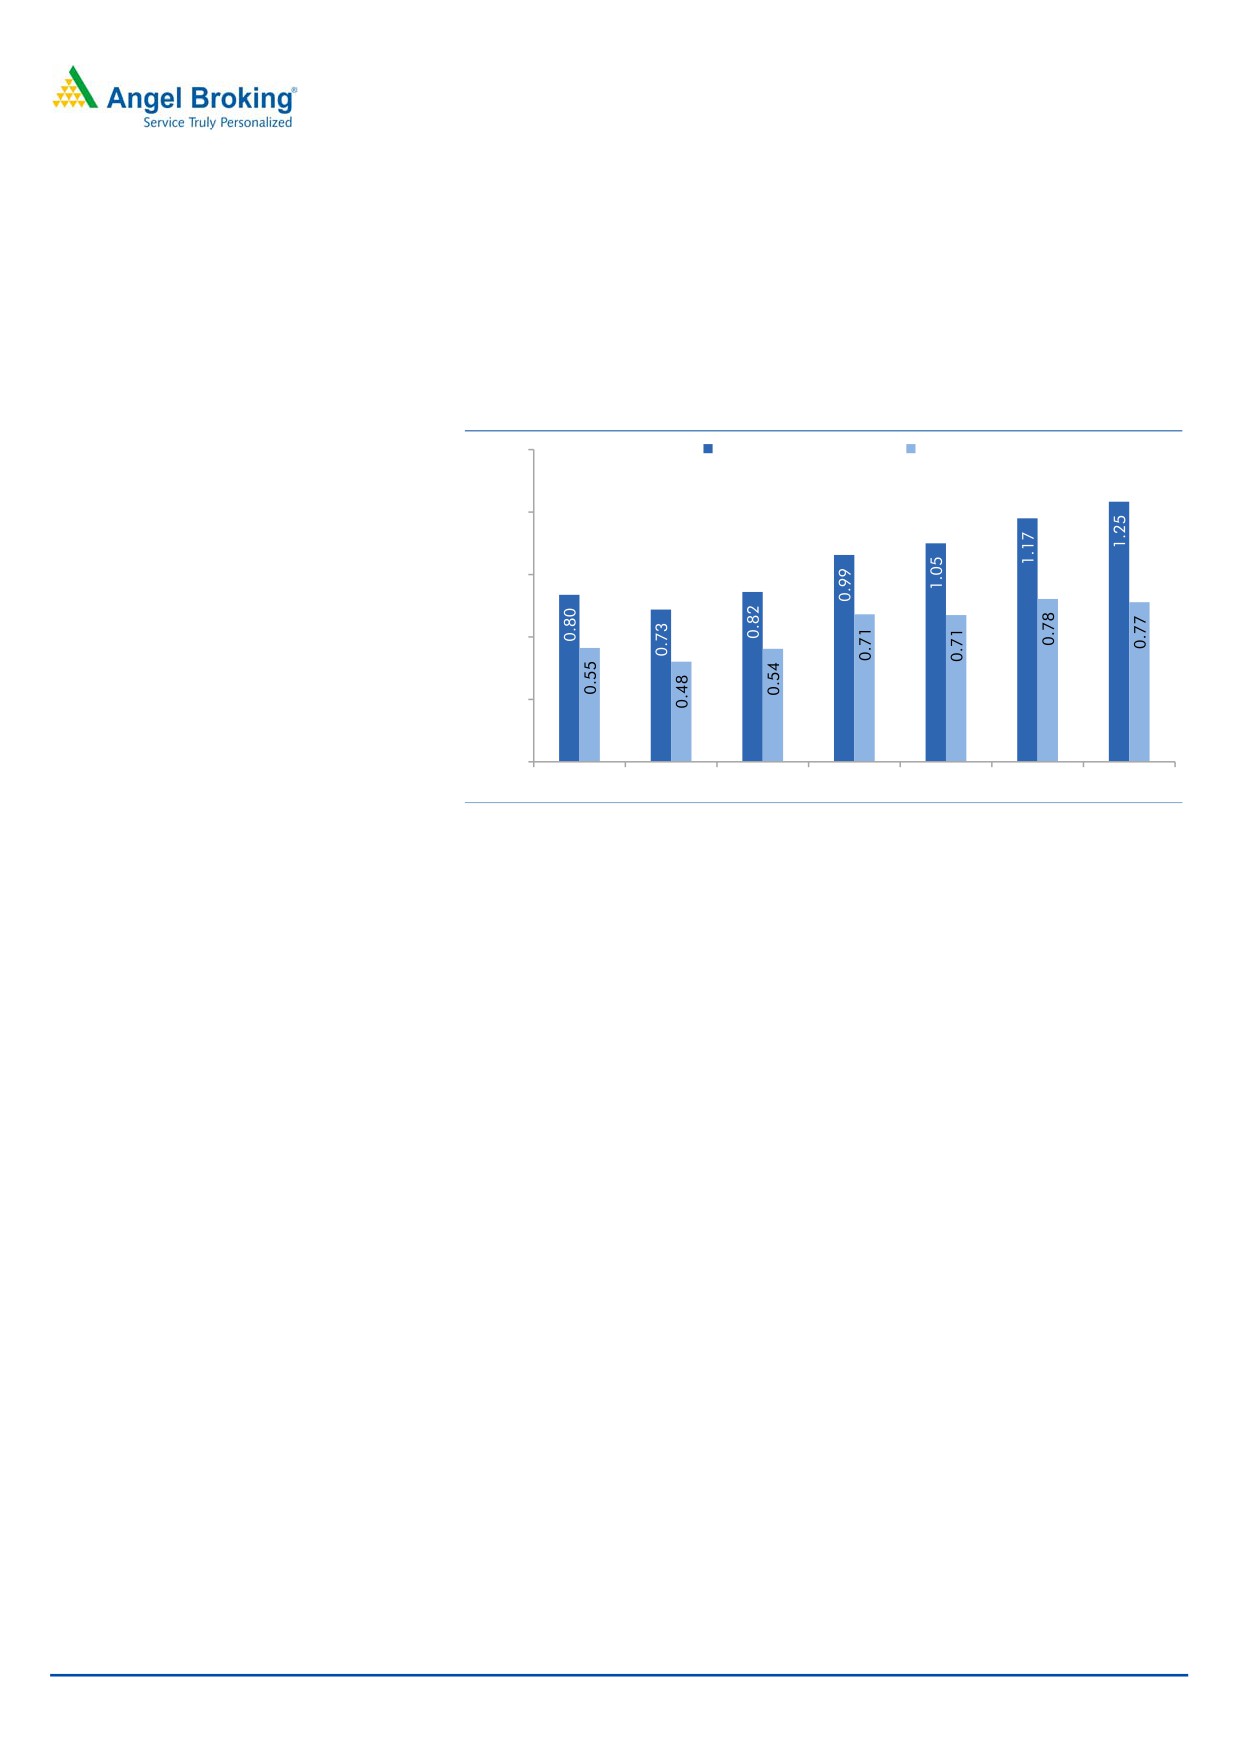
Asset quality stable and expected to continue to be stable: Housing finance
companies have so far maintained very good asset quality across the board.
Despite a sharp slowdown in the economy this is one sector which is witnessing
decent and qualitative growth. Despite high growth rates the asset quality of DHFL
continues to be decent with Gross NPA at 1.05% and Net NPA at 0.71%. We don’t
expect any deterioration in the asset quality in the near term.
Exhibit 19: Gross & Net NPA Ratio
1.50
Gross NPA (%)
Net NPA (%)
1.20
0.90
0.60
0.30
-0.00
FY12
FY13
FY14
FY15
FY16
FY17
FY18
Source: Company, Angel Research
ROE likely to see marginal uptick: Housing finance companies across the board
have witnessed a decline in ROEs in the last three years. Similarly, DHFL has also
undergone a fall in ROE to ~15.3% in FY2016E. However, we expect the reported
ROE to improve to 16.4% by FY2018E from 15.1% in FY2015. The company had
raised zero coupon bonds worth
`3,119cr, of which
~`1,200cr has been
deployed for investments which are not yield generating. These have been used
towards land & building, which show as WIP in the balance sheet. Adjusting for the
implied interest rate on the zero coupon bonds, the ROE of the company should
come down by 80bp/69bp/57bp in FY2016/FY2017/FY2018 to 14.5% / 15.2% /
15.8% respectively.
April 5, 2016
8
Dewan Housing Finance | Initiating Coverage
Exhibit 20: Comparative DuPont of HFCs
Year End FY15
DHFL HDFC LICHFL IndiabullsHsg CanFin
GICHFL
Interest Earned
11.6
11.1
10.1
12.1
11.1
11.7
Provisions
0.2
0.1
0
0.6
-0.2
0.2
Risk Adjusted Interest Earned
11.4
11
10.1
11.5
11.3
11.5
Interest Expended
9
7.8
8
7.8
8.6
8.3
Risk adjusted NII
2.3
3.2
2.1
3.7
2.7
3.2
Other Inc.
0.5
0.5
0.2
2.3
0.4
0.3
Op. Inc.
2.9
3.7
2.4
6
3.1
3.5
Op. Exp
1
0.3
0.4
1.1
0.7
0.9
Op Profit
1.9
3.4
2
4.9
2.4
2.5
PBT
1.9
3.4
2
4.9
2.4
2.5
Taxes
0.7
1.1
0.7
1.1
0.7
0.7
RoA
1.3
2.3
1.3
3.8
1.7
1.8
Leverage
12
11.2
13.6
8.2
11.6
9.6
RoE
15.1
25.7
18.1
31.0
19.7
17.8
Source: Company, Angel Research
*HDFC not adjusted for subsidiary income
Exhibit 21: Dupont Reported Vs Comparative (DHFL)
Reported
Adjusted
Dupont Reported vs
Adjusted for ZCB
FY16E FY17E FY18E
FY2016E FY2017E
FY2018E
NII
2.6
2.7
2.6
2.5
2.6
2.6
(-) Prov. Exp.
0.3
0.4
0.3
0.3
0.3
0.3
Adj NII
2.3
2.3
2.3
2.2
2.2
2.2
Int. Sens. Inc.
2.3
2.3
2.3
2.2
2.2
2.2
Other Inc.
0.4
0.4
0.3
0.4
0.4
0.3
Op. Inc.
2.8
2.7
2.6
2.7
2.6
2.6
Opex
0.9
0.9
0.8
0.9
0.9
0.8
PBT
1.9
1.8
1.8
1.7
1.7
1.74
Taxes
0.6
0.6
0.6
0.6
0.6
0.6
ROA
1.2
1.2
1.2
1.1
1.1
1.1
Leverage
12.4
13.3
13.7
12.6
13.5
13.8
ROE
15.3
15.9
16.4
14.5
15.2
15.8
Source: Company, Angel Research
April 5, 2016
9
Dewan Housing Finance | Initiating Coverage
NHB’s move to reduce risk weightage for affordable housing will help further
leveraging: The company’s current leverage (Total Assets/Net worth) stands at
~12x and we see scope for further leveraging after the NHB’s relaxation on risk
weightage on the affordable housing segment. Recently the regulator allowed LTV
upto 90% for home loans upto `30 lakhs as against `20 lakhs earlier. The capital
adequacy of the company is at 16.4% with tier-I CAR of 12.6% for 9MFY2016. The
company has already got some benefit in capital due to the relaxation.
Incrementally we believe this comes as a big relief for players like DHFL which are
primarily engaged in lending to the middle and low income group, which is driving
the demand for the affordable housing segment. Housing finance companies are
required to maintain a CAR of 12%. Looking at the current growth rate it seems the
company will have to raise funds in the next 18 months to maintain the current
capital adequacy. The promoters have issued 2.12cr warrant to themselves worth
`500cr to be converted at a price of `235.5/share. This will help the company in
meeting its capital requirement. However, we believe the company will have to
raise further capital in FY2018 to boost CAR and reduce the high leverage.
Exhibit 22: Capital Adequacy Ratio
25.0%
19.4%
20.0%
17.4%
17.2%
16.5%
16.6%
15.8%
15.0%
14.4%
15.0%
10.0%
5.0%
0.0%
FY11
FY12
FY13
FY14
FY15
FY16E
FY17E
FY18E
Source: Company, Angel Research
Exhibit 23: Exhibit 22: Comparative Analysis
Name of the
India Bulls
LIC
Can Fin HDFC
DHFL
REPCO
Company
Housing
Housing
Homes
Ltd
CAR %
16.4
21.6
24.0
15.5
21.1
17.7
Tier I
12.6
18.8
NA
12.5
19.5
14.2
Gross NPAs% (9M FY16)
1.0
0.8
1.3
0.6
0.3
0.6
Net NPAs% ( 9M FY16)
0.7
0.4
0.5
0.3
0.0
0.0
Source: Company, Angel Research
April 5, 2016
10
Dewan Housing Finance | Initiating Coverage
Outlook and valuation
On a conservative side, we have factored in interest cost on the entire `1,200cr on
Zero Coupon Bond in the P&L. We feel the effect of the same on the ROE for FY17
will be ~69bp at 15.2% against our calculated ROE of 15.9%. The prevalent
benign interest rate scenario will help DHFL in reducing its cost of funds and this
we believe will help in sustaining the ROE at the current level in the long run. The
centre’s and NHB’s move to reduce risk weight on the affordable home loans
segment will allow housing finance companies to incase their leverage and this will
act as an additional growth driver.
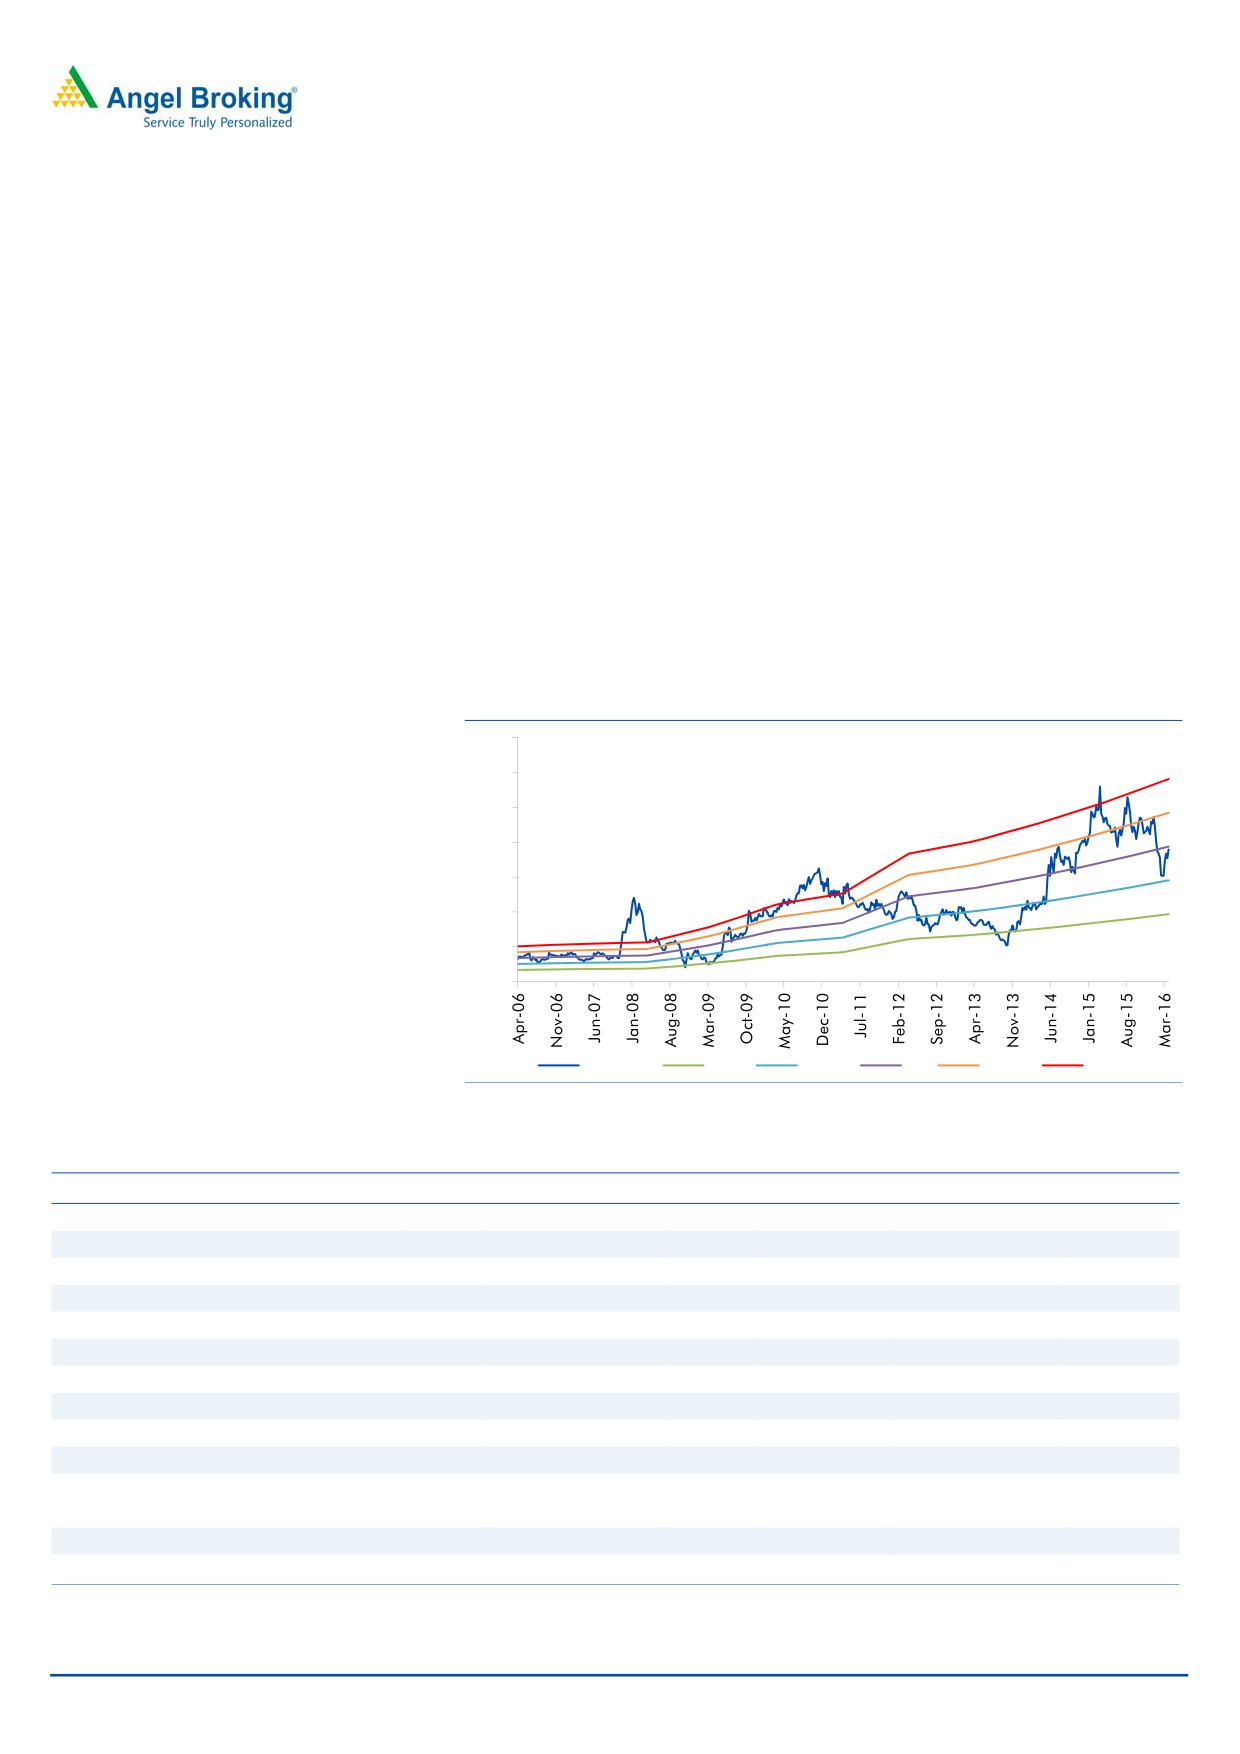
The stock is trading at 0.8x FY2018E Adj BV which is lower than its 10-year
historical median P/ABV multiple of 1.07x while its 10-year historical range has
been 0.88x -1.39x. We expect the company to post a healthy loan book CAGR of
20% over FY2015-18E, which is likely to reflect in earnings CAGR of 21.3%, over
the same period. The stock currently trades at 0.8x FY2018E ABV. We recommend
Buy on the stock, with a target price of `270.
Exhibit 24: One-year forward P/B band
350
300
250
200
150
100
50
0
Price (`)
0.5x
0.75x
1x
1.25x
1.5x
Source: Company, Angel Research
Exhibit 25: Comparative Analysis:
Parameters (` Cr)
DHFL India Bulls Housing
REPCO LIC Housing
Can Fin Homes
HDFC Ltd
5 Yr PAT CAGR %
32.8
44.0
22.9
19.2
17.1
16.2
PAT March 2010
151
307
44
662
39
2,826
PAT March 2015
621
1,901
123
1,591
86
5,990
CAR %
16.4
21.6
24.0
15.5
21.1
17.7
Borrowings (March 2015)
48,881
45,556
5,104
83,217
6,941
1,30,860
Net worth (March 2015)
4,636
6,492
812
7,818
772
30,970
Leverage
10.5
7.0
6.3
10.6
9.0
4.2
Gross NPAs% (9M FY16)
1.1
0.8
1.3
0.6
0.3
0.6
Net NPAs% ( 9M FY16)
0.7
0.4
0.9
0.3
0.0
0.0
Cost/ Assets
0.9
1.4
0.9
0.3
0.7
0.3
CMP
189
613
626
467
1,152
1,103
P/ BV
1.1
2.5
4.2
2.6
3.6
4.9
Source: Company, Angel Research
April 5, 2016
11
Dewan Housing Finance | Initiating Coverage
Key Risk & Concern:
The company has ~ `3,119cr of Zero Coupon Bonds on its balance sheet, out of
which `800cr has been earmarked for the construction of corporate office in
Mumbai. The amount currently doesn’t earn interest. However, post maturity of the
bond we believe the company will have to pay interest on it as it will have to be
replaced with fresh debt, which so far was not being accounted in the P&L account.
In the absence of any income generation from the above investments, we believe it
will be RoE dilutive for the company.
Company Background
DHFL—a leading housing finance company in India
Dewan Housing was established in 1984 by late Shri Rajesh Kumar Wadhawan.
DHFL is a dominant player in niche markets (tier II & III cities) with strong foothold
in the limited competition low and middle income (LMI) segment. After the
acquisition and merger of First Blue Home Finance, DHFL also now caters to the
middle and upper middle income group. The company operates in the mortgage
financing business where the growth and asset quality have remained healthy over
the past few years.
The company has emerged as a one-stop-shop for its customers’ financial needs,
extending beyond home loans. The company has a presence in the education
loans, life insurance, and mutual funds segments through Avanse Education Loans,
DHFL Pramerica Life Insurance and DHFL Pramerica Asset Managers Pvt Ltd,
respectively.
It is India’s third largest private sector housing finance company with an AUM of
`65,962cr as on 31st December, 2015. The company has a well diversified loan
book with housing loans accounting for the largest share at 77%, followed by LAP
(16%), project loans (5%) and loans to SME (2%) (as of 31st December, 2015).
DHFL currently has a strong distribution network with pan-India presence and
2 international representative offices in the UK and the UAE. It operates via a large
distribution network of 362 company operated centers across India and 357
locations through alliance partners with the distribution network focused primarily
on tier II and tier III locations.
Exhibit 26: Geographical Presence
Exhibit 27: Strong Branch Expansion
400
362
350
299
300
16%
300
233
250
193
200
21%
63%
150
100
50
0
West
North, Eastern, Central
South
2011
2012
2013
2014
2015
Source: Company, Angel Research
Source: Company, Angel Research
April 5, 2016
12
Dewan Housing Finance | Initiating Coverage
Key Management Personnel
Mr Kapil Wadhawan (CMD): Mr Wadhawan is an MBA from Edith Cowan
University (Australia). He was appointed as the MD in 2000 and as CMD in 2009.
He has been one of the driving forces behind the group when the AUM surged
from ~`5,000cr to ~`50,000cr over 6 years.
Mr Harshil Mehta (CEO): Mr Mehta was the MD & CEO of Aadhar Housing
Finance since the company’s inception in 2011 till January 2015. He then
assumed office of the CEO at DHFL.
Mr GP Kohli, (Independent Director): Mr Kohli was the former MD of LIC and has
extensive experience in the field of insurance, housing, HRD and IT.
Mr V.K Chopra (Independent Director): Mr Chopra was former CMD, Corporation
Bank & SIDBI. He was also the former executive director of Oriental Bank of
Commerce and former whole time member of SEBI.
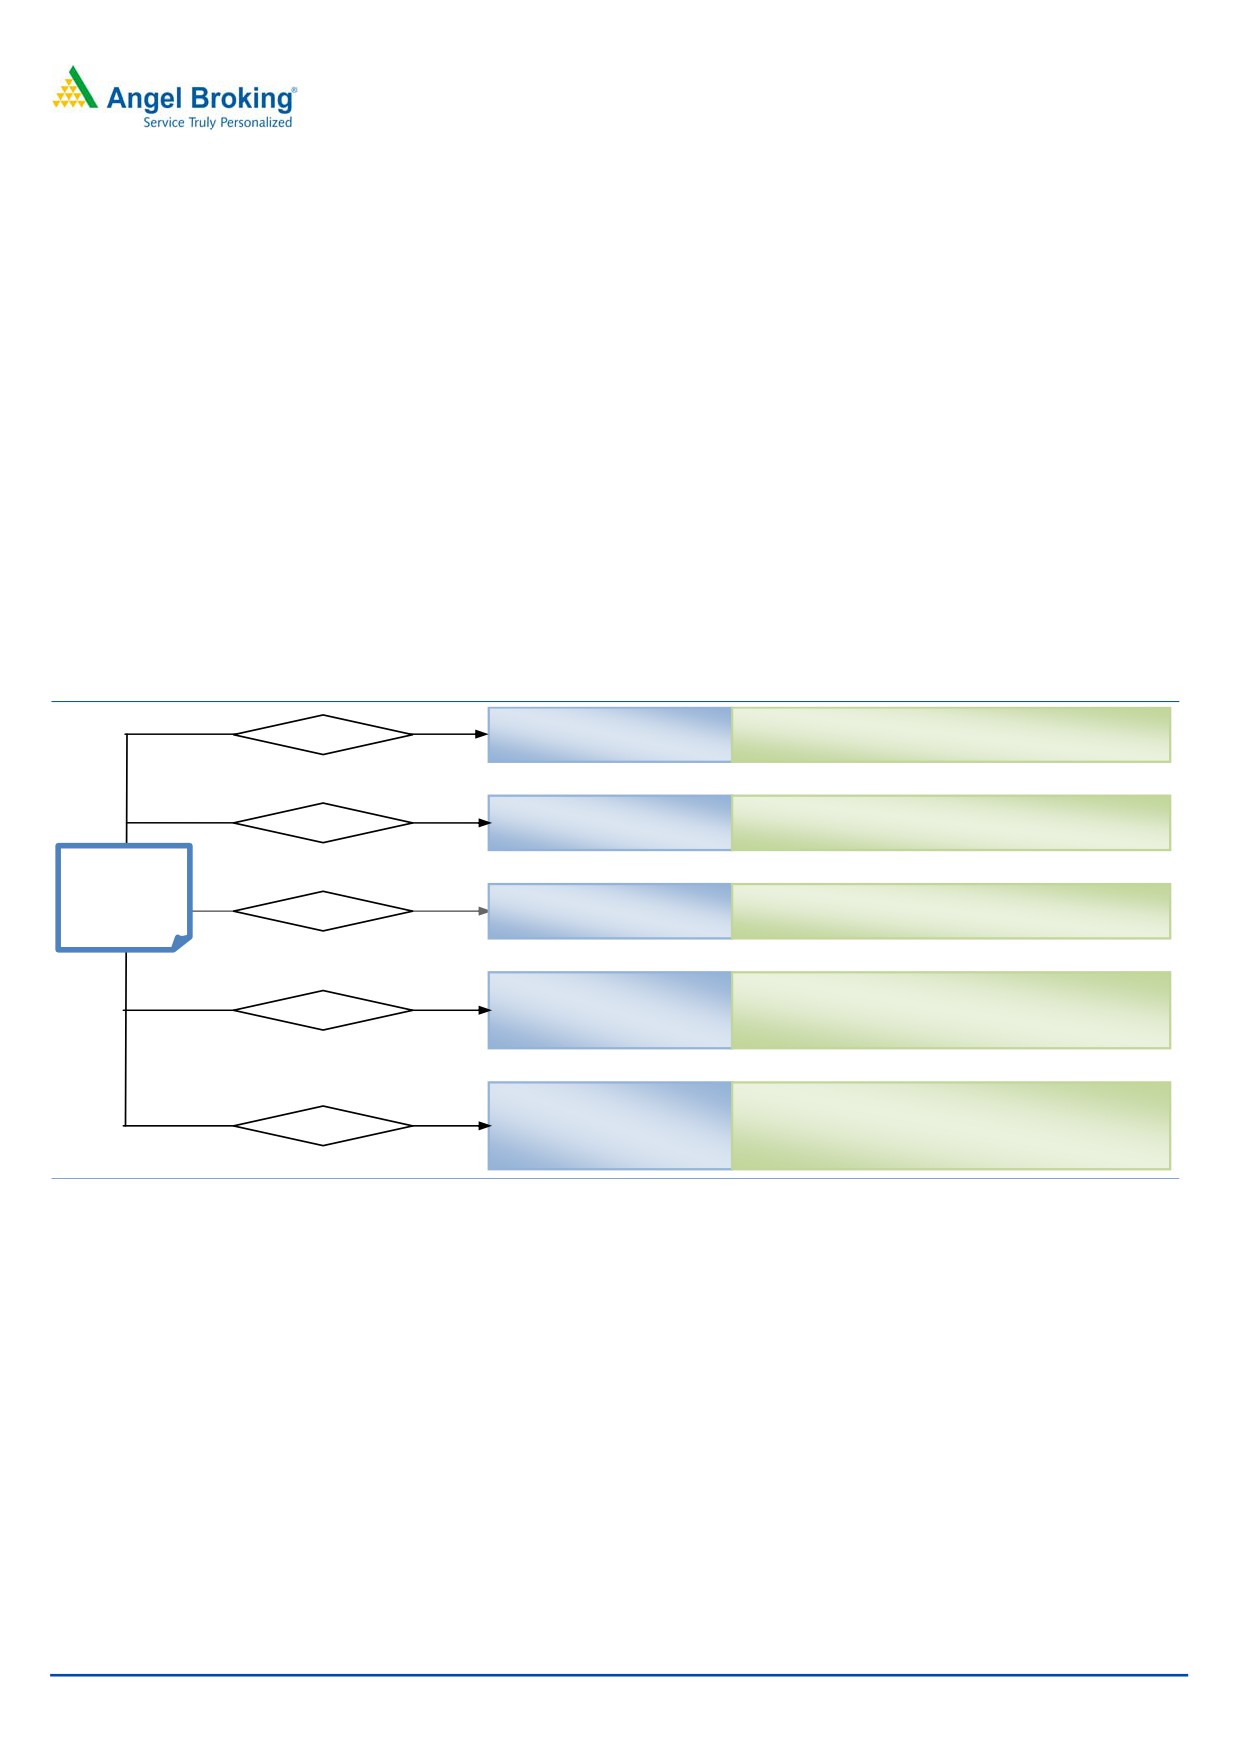
Exhibit 28: Company Structure - Associates & Joint Ventures (JV’s)
DHFL Vysya Housing
-Mainly caters to the LMI segment in
9.47%
Finance
south India
Aadhar Housing
-Caters to LIG & EWS segment, majorly
14.90%
in a developing stage
Finance
DHFL
AUM:
Avanse Education
-Provides education loans across 8
48.39%
`660 bn
Loans1
major markets
DHFL Pramerica Life
-Provides life insurance
50.00%
Insurance
-JV with Prudential Financial (owning
26% stake)
DHFL Pramerica
-Provides asset management
50.00%
Asset Managers
-JV with Prudential Financial which
Private Limited
owns 50% stake
Source: Company, Angel Research
April 5, 2016
13
Dewan Housing Finance | Initiating Coverage
Industry Overview
The new government’s aim of providing housing for all by 2022 has the potential
to create demand for 60mn new affordable housing units in the next 8 years.
Strengthening its focus on housing for all, the government has allowed additional
interest deduction of `50,000 for loans upto `35 lakhs, with property cost not
exceeding `50 lakhs.
These additional deductions will give a fillip to the mid-end housing segment in
both urban and semi-urban areas and housing finance companies are likely to see
accelerated growth in loan demand on this account. DHFL having a wide presence
in the tier II and tier III cities with a focus on mid and low income group segment is
likely to be a key beneficiary of the above efforts of the government.
Exhibit 29: Housing Industry Data
Urban Housing
Rural Housing
Category
Shortage (in mn)
% to Total Category
Shortage (in mn)
% to Total
Economically Weaker Section
10.55
56.2
Below Poverty Line
39.3
90
Lower Income Group
7.41
39.5
Above Poverty Line
4.37
10
Middle Income Group
0.82
4.37
Total
18.78
100
43.67
100
Source: Company, Angel Research
April 5, 2016
14
Dewan Housing Finance | Initiating Coverage
Income statement (standalone)
Y/E March (` cr)
FY2014
FY2015
FY2016E
FY2017E
FY2018E
NII
888
1,256
1,621
1,993
2,431
- YoY Growth (%)
30.9
41.5
29.0
22.9
22.0
Other Income
296
265
271
284
304
- YoY Growth (%)
5.8
(10.5)
2.1
5.0
7.0
Operating Income
1,184
1,522
1,892
2,277
2,735
- YoY Growth (%)
23.6
28.5
24.3
20.3
20.1
Operating Expenses
384
480
560
649
744
- YoY Growth (%)
26.2
25.2
16.6
15.8
14.7
Pre - Provision Profit
801
1,041
1,332
1,628
1,991
- YoY Growth (%)
22.4
30.1
27.9
22.2
22.3
Prov. & Cont.
66
99
184
264
310
- YoY Growth (%)
47.7
48.7
85.8
44.1
17.4
Profit Before Tax
734
943
1,149
1,364
1,681
- YoY Growth (%)
20.5
28.4
21.8
18.7
23.2
Prov. for Taxation
206
322
392
466
574
- as a % of PBT
28.1
34.1
34.1
34.1
34.1
PAT
527
620
757
898
1,107
- YoY Growth (%)
14.8
17.8
22.0
18.7
23.2
Balance sheet (standalone)
Y/E March (` cr)
FY2014
FY2015
FY2016E
FY2017E
FY2018E
Share Capital
128
146
292
292
313
Reserve & Surplus
3,447
4,490
4,983
5,741
7,154
Loan Funds
33,890
40,526
49,800
61,730
76,519
- Growth (%)
23.5
19.6
22.9
24.0
24.0
Other Liab. & Prov.
6,465
9,557
12,776
15,015
17,819
Total Liabilities
43,930
54,718
67,851
82,778
1,01,805
Investments
721
1,006
1,248
1,522
4,076
Advances
38,651
48,789
60,499
73,808
88,570
- Growth (%)
19.3
26.2
24.0
22.0
20.0
Fixed Assets
988
985
1,221
1,490
1,832
Other Assets
3,569
3,938
4,883
5,958
7,327
Total Assets
43,930
54,718
67,851
82,778
1,01,805
April 5, 2016
15
Dewan Housing Finance | Initiating Coverage
Ratio analysis (standalone)
Y/E March
FY2014
FY2015
FY2016E
FY2017E
FY2018E
Profitability ratios (%)
NIMs
2.4
2.8
2.9
2.9
2.9
Cost to Income Ratio
32.4
31.6
29.6
28.5
27.2
RoA
1.3
1.3
1.2
1.2
1.2
RoE
15.5
15.1
15.3
15.9
16.4
Asset Quality (%)
Gross NPAs
0.8
1.0
1.1
1.2
1.3
Net NPAs
0.5
0.7
0.7
0.8
0.8
Provision Coverage
33.5
28.7
32.8
33.1
38.6
Per Share Data (`)
EPS
20.5
21.3
25.9
30.8
35.4
ABVPS (75% cover.)
129.0
143.7
171.2
193.8
225.1
DPS
1.6
1.1
0.7
0.8
0.9
Valuation Ratios
PER (x)
8.6
8.3
6.8
5.8
5.0
P/ABVPS (x)
1.4
1.2
1.0
0.9
0.8
Dividend Yield
0.9
0.6
0.4
0.5
0.5
DuPont Analysis
NII
2.2
2.5
2.6
2.6
2.6
(-) Prov. Exp.
0.2
0.2
0.3
0.4
0.3
Adj. NII
2.1
2.3
2.3
2.3
2.3
Treasury
0.0
0.0
0.0
0.0
0.0
Int. Sens. Inc.
2.1
2.4
2.3
2.3
2.3
Other Inc.
0.7
0.5
0.4
0.4
0.3
Op. Inc.
2.8
2.9
2.8
2.7
2.6
Opex
1.0
1.0
0.9
0.9
0.8
PBT
1.8
1.9
1.9
1.8
1.8
Taxes
0.5
0.7
0.6
0.6
0.6
RoA
1.3
1.3
1.2
1.2
1.2
Leverage
11.7
12.0
12.4
13.3
13.7
RoE
15.5
15.1
15.3
15.9
16.4
April 5, 2016
16
Dewan Housing Finance | Initiating Coverage
Research Team Tel: 022 - 39357800
DISCLAIMER
Angel Broking Private Limited (hereinafter referred to as “Angel”) is a registered Member of National Stock Exchange of India Limited,
Bombay Stock Exchange Limited and Metropolitan Stock Exchange of India Limited. It is also registered as a Depository Participant with
CDSL and Portfolio Manager with SEBI. It also has registration with AMFI as a Mutual Fund Distributor. Angel Broking Private Limited is
a registered entity with SEBI for Research Analyst in terms of SEBI (Research Analyst) Regulations, 2014 vide registration number
INH000000164. Angel or its associates has not been debarred/ suspended by SEBI or any other regulatory authority for accessing
/dealing in securities Market. Angel or its associates including its relatives/analyst do not hold any financial interest/beneficial
ownership of more than 1% in the company covered by Analyst. Angel or its associates/analyst has not received any compensation /
managed or co-managed public offering of securities of the company covered by Analyst during the past twelve months. Angel/analyst
has not served as an officer, director or employee of company covered by Analyst and has not been engaged in market making activity
of the company covered by Analyst.
This document is solely for the personal information of the recipient, and must not be singularly used as the basis of any investment
decision. Nothing in this document should be construed as investment or financial advice. Each recipient of this document should
make such investigations as they deem necessary to arrive at an independent evaluation of an investment in the securities of the
companies referred to in this document (including the merits and risks involved), and should consult their own advisors to determine
the merits and risks of such an investment.
Reports based on technical and derivative analysis center on studying charts of a stock's price movement, outstanding positions and
trading volume, as opposed to focusing on a company's fundamentals and, as such, may not match with a report on a company's
fundamentals.
The information in this document has been printed on the basis of publicly available information, internal data and other reliable
sources believed to be true, but we do not represent that it is accurate or complete and it should not be relied on as such, as this
document is for general guidance only. Angel Broking Pvt. Limited or any of its affiliates/ group companies shall not be in any way
responsible for any loss or damage that may arise to any person from any inadvertent error in the information contained in this report.
Angel Broking Pvt. Limited has not independently verified all the information contained within this document. Accordingly, we cannot
testify, nor make any representation or warranty, express or implied, to the accuracy, contents or data contained within this document.
While Angel Broking Pvt. Limited endeavors to update on a reasonable basis the information discussed in this material, there may be
regulatory, compliance, or other reasons that prevent us from doing so.
This document is being supplied to you solely for your information, and its contents, information or data may not be reproduced,
redistributed or passed on, directly or indirectly.
Neither Angel Broking Pvt. Limited, nor its directors, employees or affiliates shall be liable for any loss or damage that may arise from
or in connection with the use of this information.
Note: Please refer to the important ‘Stock Holding Disclosure' report on the Angel website (Research Section). Also, please refer to the
latest update on respective stocks for the disclosure status in respect of those stocks. Angel Broking Pvt. Limited and its affiliates may
have investment positions in the stocks recommended in this report.
Disclosure of Interest Statement
Dewan Housing Finance Corporation
1. Analyst ownership of the stock
No
2. Angel and its Group companies ownership of the stock
No
3. Angel and its Group companies' Directors ownership of the stock
No
4. Broking relationship with company covered
No
Note: We have not considered any Exposure below ` 1 lakh for Angel, its Group companies and Directors
Ratings (Based on expected returns
Buy (> 15%)
Accumulate (5% to 15%)
Neutral (-5 to 5%)
over 12 months investment period):
Reduce (-5% to -15%)
Sell (< -15)
April 5, 2016
17