2QFY2019 Result Update | HFC
Dec 12, 2018
Dewan Housing Finance Ltd
BUY
CMP
`205
Performance Highlights
Target Price
`300
Particulars (` cr)
2QFY19
1QFY19
% chg (qoq)
2QFY18
% chg (yoy)
Investment Period
12 Months
NII
831
824
0.9
576
44.3
Pre-prov. profit
766
728
5.2
505
51.6
PAT
439
435
1.0
288
52.3
Stock Info
Source: Company, Angel Research
Sector
HFC
Dewan Housing Finance (DHFL) posted steady operating performance yet again in
Market Cap (` cr)
6,314
2QFY18, however, liquidity issues began at the end of the quarter. DHFL’s
Beta
2.3
business grew in the quarter with a 35% yoy rise in loan book to `1,10,100cr.
52 Week High / Low
690/176
Further, in-line with the loan book, AUMs also increased by 38% yoy in the
Avg. Daily Volume
18,70,500
quarter. At the bottom-line, the company’s net profit grew by 52%, aided by steady
Face Value (`)
10
growth of 44% in net interest income, surge in other income and a reduction in
BSE Sensex
35,673
Nifty
10,694
cost with respect to income, which decreased by 80bps to 24.3%.
Reuters Code
DWNH.NS
Asset quality intact despite higher advances; however liquidity issues to impact
Bloomberg Code
DEWH.IN
growth: During 2QFY19, the company’s AUM grew by 24%, 70%, 56% and 101%
in home loans, LAP, corporate loan and SME loans respectively. Asset quality
Shareholding Pattern (%)
remained strong (GNPA - 0.96%) despite the company’s loan growth being
aggressive. The borrowings increased by 26% yoy, while the calculated cost of
Promoters
39.2
funds increased by 26bps to 9.07%. The mix in borrowing remained largely
MF / Banks / Indian Fls
9.5
unchanged with banks accounting for 42% of total borrowings, followed by capital
FII / NRIs / OCBs
20.5
markets (40%) and others (18%).
Indian Public / Others
16.3
Current liquidity issue has led the company to recalibrate business strategy. Here
on, management will focus more on retail lending and reduce project finance
from current 17% to 5% in next 4 quarters. The rising cost of funds and stiff
Abs. (%)
3m 1yr
3yr
competition would restrict it to pass on cost and will lead to compression in
Sensex
3.5
8.3
39.7
spread. We expect AUM growth to moderate for next 2 quarters considering
DHFL
(68.9)
(66.6)
(8.2)
current liquidity tightness. We will continue to closely monitor developments on
funding availability and performance of LAP/project finance book.
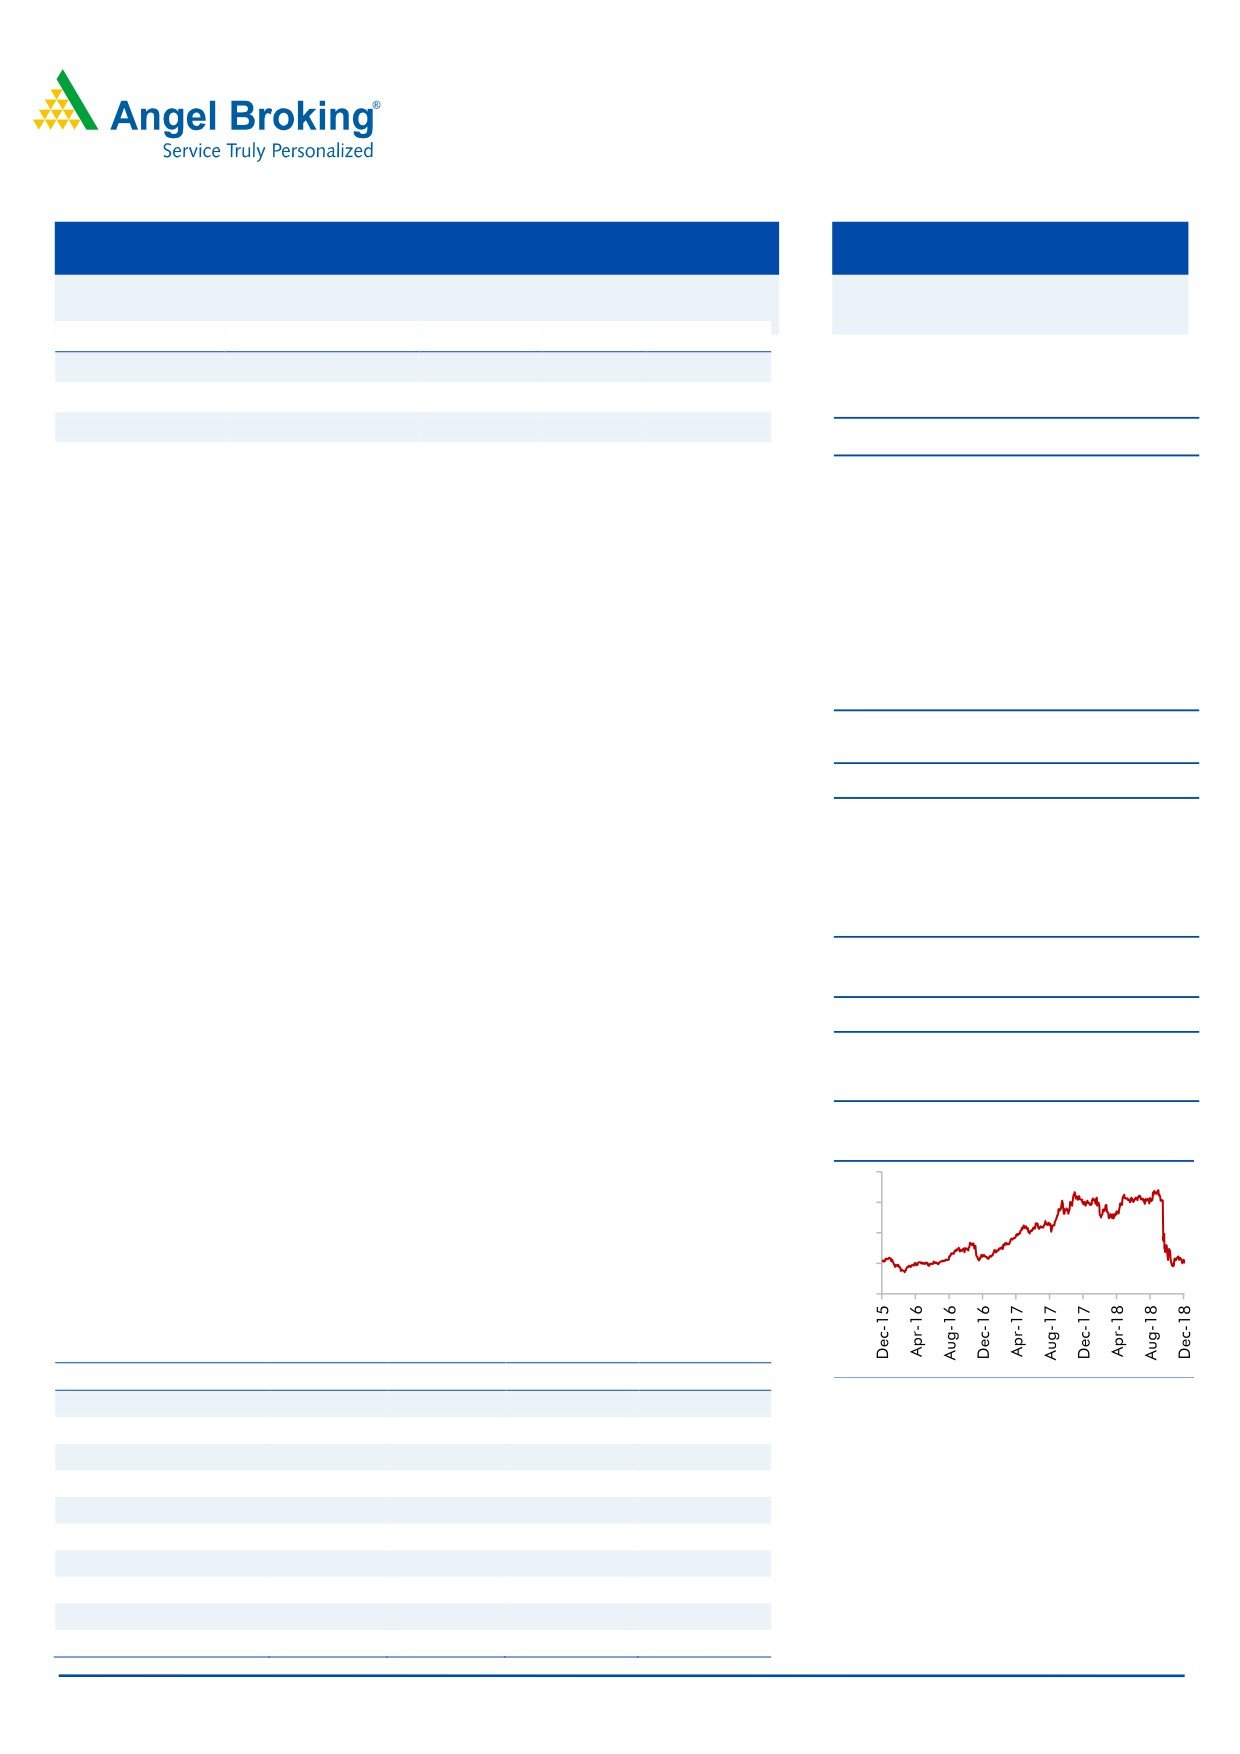
3-year price chart
Outlook & Valuation: Current liquidity issue would completely reset midterm
800
growth path and return ratios. We expect loan book to slowdown significantly over
600
FY18-20, driven by rising cost of funds. Considering, the above parameters, we
400
have moderated our loan growth expectations for the company from 30% to 5%
200
for FY2019E. We maintain our BUY on the stock, with our target price of `300.
0
Key financials (Standalone)
Y/E March (` cr)
FY2017
FY2018E
FY2019E
FY2020E
Source: Company, Angel Research
NII
1,859
2,460
2,674
2,691
% chg
26%
32%
9%
1%
Net profit
927
1,174
1,078
1,073
% chg
27%
27%
-8%
-1%
NIM (%)
2.4
2.5
2.4
2.3
EPS (`)
30
37
34
34
P/E (x)
7
5
6
6
Jaikishan Parmar
P/ABV (x)
0.8
0.8
0.6
0.6
022 - 39357600 Ext: 6810
RoA (%)
1.2
1.2
1.0
1.0
[email protected]
RoE (%)
14
14
11
10
Source: Company, Angel Research; Note: CMP as of Dec 12, 2018
Please refer to important disclosures at the end of this report
1
DHFL | 2QFY2019 Result Update
Exhibit 1: Quarterly Summary
Particular
2QFY17
3QFY17
4QFY17
1QFY18
2QFY18
3QFY18
4QFY18
1QFY19
2QFY19
YoY%
MoM %
Interest Income
2,123
2,316
2,283
2,353
2,526
2,520
2,647
3,017
3,271
29.50
8.43
Interest Expenses
1,631
1,800
1,747
1,787
1,950
1,894
1,980
2,193
2,440
25.12
11.27
NII
492
516
536
566
576
626
667
824
831
44.33
0.86
Other Income
45
51
95
55
106.4
114
161
143
197
84.87
37.55
Total Income
537
567
631
621
682
740
828
967
1,028
50.65
6.29
Operating Exp
133
143
168
151
171.05
170
210
230
250
46.28
8.70
Cost / Income %
25%
25%
27%
24%
25%
23%
25%
24%
24%
Depreciation
7
7
3
6
6
7
8
9
12
89.76
38.07
Emp
66
66
66
78
93
89
100
131
128
37.07
-2.48
Other Exp
67
77
103
74
78
82
110
99
122
57.32
23.46
PPP
397
417
459
464
505
563
610
728
766
51.65
5.15
Provisions
45
45
83
83
110.55
100
130
90.55
132.74
20.07
46.59
PBT
352
372
376
381
394
463
480
638
633
60.50
-0.74
Tax
120
127
127
120
106
156
167
203
194
82.65
-4.37
Tax Rate %
34%
34%
34%
32%
27%
34%
35%
32%
31%
PAT
232.0
245
249
260
288
307
313
435
439
52.32
0.96
Extra Ordinary Gain
0.0%
-
1,969
-
-
-
-
-
0
Reported PAT
232
245
2,218
260
288
307
313
435
439
52.32
0.96
Source: Company
Exhibit 2: AUM MIX & Growth
Loan Break Up
2QFY17
3QFY17
4QFY17
1QFY18
2QFY18
3QFY18
4QFY18
1QFY19
2QFY19
Home Loans
70%
68.9%
65.8%
65.5%
63.7%
63.0%
61%
59%
57%
LAP
16%
15.6%
16.9%
16.6%
17.8%
18.0%
20%
21%
22%
Project Finance
12%
12.5%
14.0%
14.7%
15.1%
15.0%
15%
16%
17%
Others
3%
3.0%
3.3%
3.2%
3.3%
4.0%
4%
4%
5%
Total
100%
100%
100%
100%
100%
100%
100%
100%
100%
AUM Growth
Home Loans AUM
52,807
53,946
54,982
57,795
59,935
63,810
67,765
71,355
74,074
% YoY
12.0%
10.5%
9.8%
12.2%
13.5%
18.3%
23.2%
23.5%
23.6%
% QoQ
2.6%
2.2%
1.9%
5.1%
3.7%
6.5%
6.2%
5.3%
3.8%
LAP AUM
11,810
12,214
14,122
14,647
16,748
18,231
22,218
25,397
28,510
% YoY
10.6%
15.7%
26.9%
27.1%
41.8%
49.3%
57.3%
73.4%
70.2%
% QoQ
2.5%
3.4%
15.6%
3.7%
14.3%
8.9%
21.9%
14.3%
12.3%
Project Finance AUM
8,651
9,787
11,698
12,971
14,207
15,193
16,664
19,350
22,131
% YoY
129.4%
85.5%
87.0%
83.8%
64.2%
55.2%
42.4%
49.2%
55.8%
% QoQ
22.6%
13.1%
19.5%
10.9%
9.5%
6.9%
9.7%
16.1%
14.4%
Others AUM
1,956
2,349
2,757
2,824
3,105
4,051
4,444
4,838
6,509
% YoY
55.6%
78.0%
32.2%
50.8%
58.8%
72.5%
61.1%
71.3%
109.6%
-10.2%
4.5%
20.1%
17.4%
2.4%
10.0%
30.5%
9.7%
8.9%
Total AUM
75,223
78,296
83,560
88,236
93,995
1,01,286
1,11,090
1,20,940
1,31,223
Source: Company
Dec 07, 2018
2
DHFL | 2QFY2019 Result Update
Balance Sheet Statement
Y/E March (` cr)
FY16
FY17
FY18
FY19E
FY20E
Share Capital
292
313
314
314
314
Reserve & Surplus
4,725
7,683
8,482
10,126
11,011
Net Worth
5,017
7,996
8,796
10,440
11,324
Borrowings
61,050
81,265
92,612
90,101
1,01,860
- Growth (%)
25
33
14
(3)
13
Other Liabilities & Provisions
1,695
2,728
5,807
5,036
4,921
Total Liabilities
67,762
91,989
1,07,215
1,05,577
1,18,106
Cash & Bank Balance
3,408
3,430
2,468
3,337
3,518
Investments
893
13,535
8,077
9,701
10,226
Advances
62,356
74,297
95,518
91,301
1,03,060
- Growth (%)
21
19
29
(4)
13
Fixed Assets
202
209
850
892
937
Other Assets
902
518
302
346
364
Total Assets
67,762
91,989
1,07,215
1,05,577
1,18,106
- Growth (%)
24
36
17
(2)
12
Standalone Income Statement
Y/E March (` cr)
FY16
FY17
FY18
FY19E
FY20E
Net Interest Income
1,481
1,859
2,460
2,674
2,691
- YoY Growth (%)
18
26
32
9
1
Other Income
329
345
441
485
416
- YoY Growth (%)
24
5
28
10
(14)
Operating Income
1,810
2,204
2,901
3,159
3,107
- YoY Growth (%)
19
22
32
9
(2)
Operating Expenses
533
583
722
1,006
898
- YoY Growth (%)
12
9
24
39
(11)
Pre - Provision Profit
1,277
1,620
2,179
2,153
2,209
- YoY Growth (%)
22
27
34
(1)
3
Provision and Contingencies
175
218
420
571
583
- YoY Growth (%)
67
25
93
36
2
Profit Before Tax
1,102
1,402
1,759
1,581
1,626
- YoY Growth (%)
17
27
25
(10)
3
Provision for Taxation
373
475
584
503
553
- as a % of PBT
16
27
23
(14)
10
PAT
729
927
1,174
1,078
1,073
- YoY Growth (%)
17
27
27
(8)
(1)
Exception Item
-
1,969
-
-
-
Reported PAT
729
2,896
1,174
1,078
1,073
Dec 07, 2018
3
DHFL | 2QFY2019 Result Update
Key Ratio
Y/E March
FY16
FY17
FY18
FY19E
FY20E
Profitability ratios (%)
Yield on AUM
11.0
11.1
10.3
10.9
10.1
COF
10.0
9.4
8.7
10.3
9.6
Spread
1.0
1.8
1.6
0.6
0.6
NIMs ( Calculated) AUM
2.3
2.4
2.5
2.4
2.3
Cost to Income ratio
29
26
25
32
29
Cost to Asset ratio
0.8
0.6
0.7
1.0
0.8
ROA
1.2
1.2
1.2
1.0
1.0
ROE
15
14
14
11
10
Credit Cost (%)
0.31
0.32
0.49
0.61
0.60
Per Share Data (`)
EPS
23
30
37
34
34
BV
160
255
280
333
361
ABVPS
154
247
272
323
350
DPS
8
4
6
5
5
Valuation Ratios
PER (x)
8.7
6.8
5.4
5.9
5.9
P/BVPS (x)
1.3
0.8
0.7
0.61
0.56
P/ABVPS (x)
1.3
0.8
0.7
0.63
0.58
Dividend Yield
4.0
2.0
3.0
2.6
2.5
Dupont Analysis
NII
2.4
2.3
2.5
2.5
2.4
Provision
0.3
0.3
0.4
0.5
0.5
Adj NII
2.1
2.1
2.0
2.0
1.9
Other Income
0.5
0.4
0.4
0.5
0.4
Total Income
2.7
2.5
2.5
2.4
2.3
Operating Expenses
0.9
0.7
0.7
0.9
0.8
Emp Exp
0.4
0.3
0.4
0.5
0.4
Other Exp
0.5
0.4
0.4
0.5
0.4
PBT
1.8
1.8
1.8
1.5
1.5
Tax
0.6
0.6
0.6
0.5
0.5
ROA
1.2
1.2
1.2
1.0
1.0
Leverage
12.7
12.3
11.9
11.1
10.3
ROE
15.1
14.2
14.0
11.2
9.9
Note - Valuation done on closing price of 07/12/2018
Dec 07, 2018
4
DHFL | 2QFY2019 Result Update
Research Team Tel: 022 - 39357800
E-mail: [email protected]
Website: www.angelbroking.com
DISCLAIMER
Angel Broking Limited (hereinafter referred to as “Angel”) is a registered Member of National Stock Exchange of India Limited, Bombay
Stock Exchange Limited, Metropolitan Stock Exchange Limited, Multi Commodity Exchange of India Ltd and National Commodity &
Derivatives Exchange Ltd It is also registered as a Depository Participant with CDSL and Portfolio Manager and Investment Adviser with
SEBI. It also has registration with AMFI as a Mutual Fund Distributor. Angel Broking Limited is a registered entity with SEBI for Research
Analyst in terms of SEBI (Research Analyst) Regulations, 2014 vide registration number INH000000164. Angel or its associates has not
been debarred/ suspended by SEBI or any other regulatory authority for accessing /dealing in securities Market. Angel or its
associates/analyst has not received any compensation / managed or co-managed public offering of securities of the company covered
by Analyst during the past twelve months.
This document is solely for the personal information of the recipient, and must not be singularly used as the basis of any investment
decision. Nothing in this document should be construed as investment or financial advice. Each recipient of this document should
make such investigations as they deem necessary to arrive at an independent evaluation of an investment in the securities of the
companies referred to in this document (including the merits and risks involved), and should consult their own advisors to determine
the merits and risks of such an investment.
Reports based on technical and derivative analysis center on studying charts of a stock's price movement, outstanding positions and
trading volume, as opposed to focusing on a company's fundamentals and, as such, may not match with a report on a company's
fundamentals. Investors are advised to refer the Fundamental and Technical Research Reports available on our website to evaluate the
contrary view, if any
The information in this document has been printed on the basis of publicly available information, internal data and other reliable
sources believed to be true, but we do not represent that it is accurate or complete and it should not be relied on as such, as this
document is for general guidance only. Angel Broking Limited or any of its affiliates/ group companies shall not be in any way
responsible for any loss or damage that may arise to any person from any inadvertent error in the information contained in this report.
Angel Broking Limited has not independently verified all the information contained within this document. Accordingly, we cannot testify,
nor make any representation or warranty, express or implied, to the accuracy, contents or data contained within this document. While
Angel Broking Limited endeavors to update on a reasonable basis the information discussed in this material, there may be regulatory,
compliance, or other reasons that prevent us from doing so.
This document is being supplied to you solely for your information, and its contents, information or data may not be reproduced,
redistributed or passed on, directly or indirectly.
Neither Angel Broking Limited, nor its directors, employees or affiliates shall be liable for any loss or damage that may arise from or in
connection with the use of this information.
Disclosure of Interest Statement
HDFC Bank
1. Financial interest of research analyst or Angel or his Associate or his relative
No
2. Ownership of 1% or more of the stock by research analyst or Angel or associates or relatives
No
3. Served as an officer, director or employee of the company covered under Research
No
4. Broking relationship with company covered under Research
No
Ratings (Based on expected returns
Buy (> 15%)
Accumulate (5% to 15%)
Neutral (-5 to 5%)
over 12 months investment period):
Reduce (-5% to -15%)
Sell (< -15)
Dec 07, 2018
5