2QFY2016 Result Update | Automobiles
November 17, 2015
Competent Auto
NEUTRAL
CMP
`144
Performance Highlights
Target Price
-
Y/E March (` cr)
2QFY16 2QFY15
% chg (yoy) 1QFY16
% chg (qoq)
Investment Period
-
Net sales
220
196
12.2
237
(7.2)
EBITDA
6
5
16.2
6
(6.4)
Stock Info
EBITDA Margin (%)
2.7
2.6
9bp
2.7
2bp
Adjusted PAT
2.6
2.1
21.6
2.3
9.8
Sector
Automobiles
Source: Company, Angel Research
Market Cap (` cr)
89
For 2QFY2016, Competent Auto (Competent) reported a decent set of numbers.
Net Debt
(10.5)
The top-line for the quarter grew by 12.2% yoy to `220cr, which is slightly lower
Beta
1.2
than our estimate of `226cr. The revenue growth is in-line with growth reported
by Maruti Suzuki in 2QFY2016, where its top-line grew by 13.1% yoy largely
52 Week High / Low
240 / 78
owing to 10% volume growth. The EBIDTA for the quarter came in at `6cr as
Avg. Daily Volume
8,196
against `5cr in the corresponding quarter a year ago. The EBIDTA margin for the
Face Value (`)
10
quarter improved by 9bp yoy to 2.7% as against 2.6% in 2QFY2015. The interest
BSE Sensex
25,760
expense for the quarter grew by 40% yoy to `1.6cr as against `1.2cr in 2QFY2015.
Consequently, the net profit came in at `2.6cr, growing by 21.6% on a yoy basis.
Nifty
7,807
Reuters Code
CPA.BO
Proxy play on Maruti’s growth: The top-line performance of the company is
closely linked to the performance of Maruti Suzuki (MSIL). We expect MSIL to post
Bloomberg Code
CPA.IN
robust volume growth in the domestic market going ahead on back of new
launches which will be replicated by Competent. Also, we expect the market share
Shareholding Pattern (%)
of the company to remain stable/improve, as entry of a new dealer seems to be
Promoters
74.9
commercially unviable with property prices having soared significantly in the Delhi
region. Further, higher vehicle sales would likely get converted into greater demand
MF / Banks / Indian Fls
0.0
for after sale services, thus bringing in additional revenue for the company.
FII / NRIs / OCBs
0.0
Scalable business model with healthy balance-sheet: The company has a scalable
Indian Public / Others
25.1
business model which will enable it to report sustainable revenue growth going
ahead. The company has increased its short term debt in 1HFY2016E ahead of
Abs.(%)
3m 1yr
3yr
the festive season mainly utilizing the funds for inventory. We expect the debt level
to return to normal levels by the year end.
Sensex
(7.6)
(8.6)
40.7
Competent
(16.6)
79.4
167.0
Outlook and Valuations: We believe that Competent will continue to benefit from
its established position in the automobile dealership market in Delhi, Haryana,
and Himachal Pradesh, and from its conducive relationship with its principal,
3-Year Daily Price Chart
MSIL. During FY2015-17, we expect the company to register a top-line and
250
bottom-line CAGR of 10.9% and 21.7%, to `1,137cr and `17cr, respectively.
200
Currently, the stock trades at 5.1x its FY2107E earnings. We have a Neutral
150
rating on the stock.
100
Key financials
50
Y/E March (` cr)
FY2013
FY2014
FY2015
FY2016E
FY2017E
Net Sales
788
808
924
1040
1137
-
% chg
11.2
2.6
14.4
12.5
9.3
Net Profit
8
9
12
16
17
% chg
7.0
17.6
26.6
36.3
8.7
EBITDA Margin (%)
2.5
2.5
2.8
3.2
3.1
Source: Company, Angel Research
FDEPS (`)
12.7
14.9
18.9
25.7
28.0
P/E (x)
11.4
9.6
7.6
5.6
5.1
P/BV (x)
1.2
1.1
1.0
0.8
0.7
RoE (%)
10.8
11.4
12.7
15.0
14.3
RoCE (%)
16.3
15.3
16.0
20.7
19.6
Milan Desai
EV/Sales (x)
0.1
0.1
0.1
0.1
0.1
+91 22 3935 3600 Ext: 6846
EV/EBITDA (x)
5.4
5.0
3.0
2.2
1.8
Source: Company, Angel Research; Note: CMP as of November16, 2015
Please refer to important disclosures at the end of this report
1
Competent Auto | 2QFY2016 Result Update
Exhibit 1: 2QFY2016 performance highlights
Y/E March (` cr)
2QFY16
2QFY15
% chg (yoy)
1QFY16
% chg (qoq)
1HFY16
1HFY15
% chg
Total operating income
220
196
12.2
237
(7.2)
457
405
12.7
Purchase of Stock in Trade
193
174
10.7
211
(8.7)
403
362
11.5
(% of Sales)
87.6
88.8
(115)bp
89.0
(140)bp
88.3
89.3
(94)bp
Employee cost
7
6
23.6
7
7.8
14
12
18.6
(% of Sales)
3.2
2.9
30bp
2.8
45bp
3.0
2.8
15bp
Other Expenses
14
11
27.1
13
8.3
27
22
25.1
(% of Sales)
6.5
5.7
76bp
5.6
93bp
6.0
5.4
60bp
Total expenditure
214
191
12.1
231
(7.2)
444
395
12.5
EBITDA
5.9
5.1
16.2
6
(6.4)
12
10
21.6
EBITDA Margin (%)
2.7
2.6
9bp
2.7
2bp
2.7
2.5
20bp
Interest
1.6
1.2
40.0
1.6
5.5
3
2
45.0
Depreciation
1
1
(17.5)
2
(46.0)
2
2
23.7
Other income
0.3
0.3
(9.1)
0.3
(16.6)
1
0
14.2
PBT
4
3
15.9
4
4.8
7
6
12.4
(% of Sales)
1.7
1.6
1.5
1.6
1.6
Tax
1.1
1.1
4.7
1.2
(5.1)
2
2
7.0
(% of PBT)
30.5
33.8
33.7
32.0
33.6
Reported PAT
2.6
2.1
21.6
2.3
9.8
5
4
15.1
Exceptional items
0
0
0
0
0
Adjusted PAT
2.6
2.1
21.6
2.3
9.8
5
4
15.1
PATM (%)
1.2
1.1
1.0
1.1
1.0
Source: Company, Angel Research
Exhibit 2: Actual v/s Angel’s estimates
Actual v/s Angel's Estimates
Actual (`cr)
Estimate (` cr)
% variation
Total Income (`cr)
220
226
(2.7)
EBITDA (`cr)
5.9
7.5
(21.0)
EBITDA Margin (%)
2.7
3.3
70bp
Adjusted PAT (`cr)
2.6
3.6
(28.8)
Source: Company, Angel Research
Strong performance continues
For 2QFY2016, Competent reported a decent set of numbers. The top-line for the
quarter grew by 12.2% yoy to `220cr, which is slightly lower than our estimate of
`226cr. The revenue growth is in-line with domestic revenue growth reported by
Maruti Suzuki in 2QFY2016, where the revenue grew by 17.5% yoy largely owing
to 12.4% volume growth. The EBIDTA for the quarter came in at `6cr as against
`5cr in the corresponding quarter a year ago. The EBIDTA margin for the quarter
improved by 9bp yoy to 2.7% as against 2.6% in 2QFY2015. The interest expense
for the quarter grew by 40% yoy to `1.6cr as against `1.2cr in 2QFY2015.
Consequently, the net profit came in at `2.6cr, growing by 21.6% on a yoy basis.
November 17, 2015
2
Competent Auto | 2QFY2016 Result Update
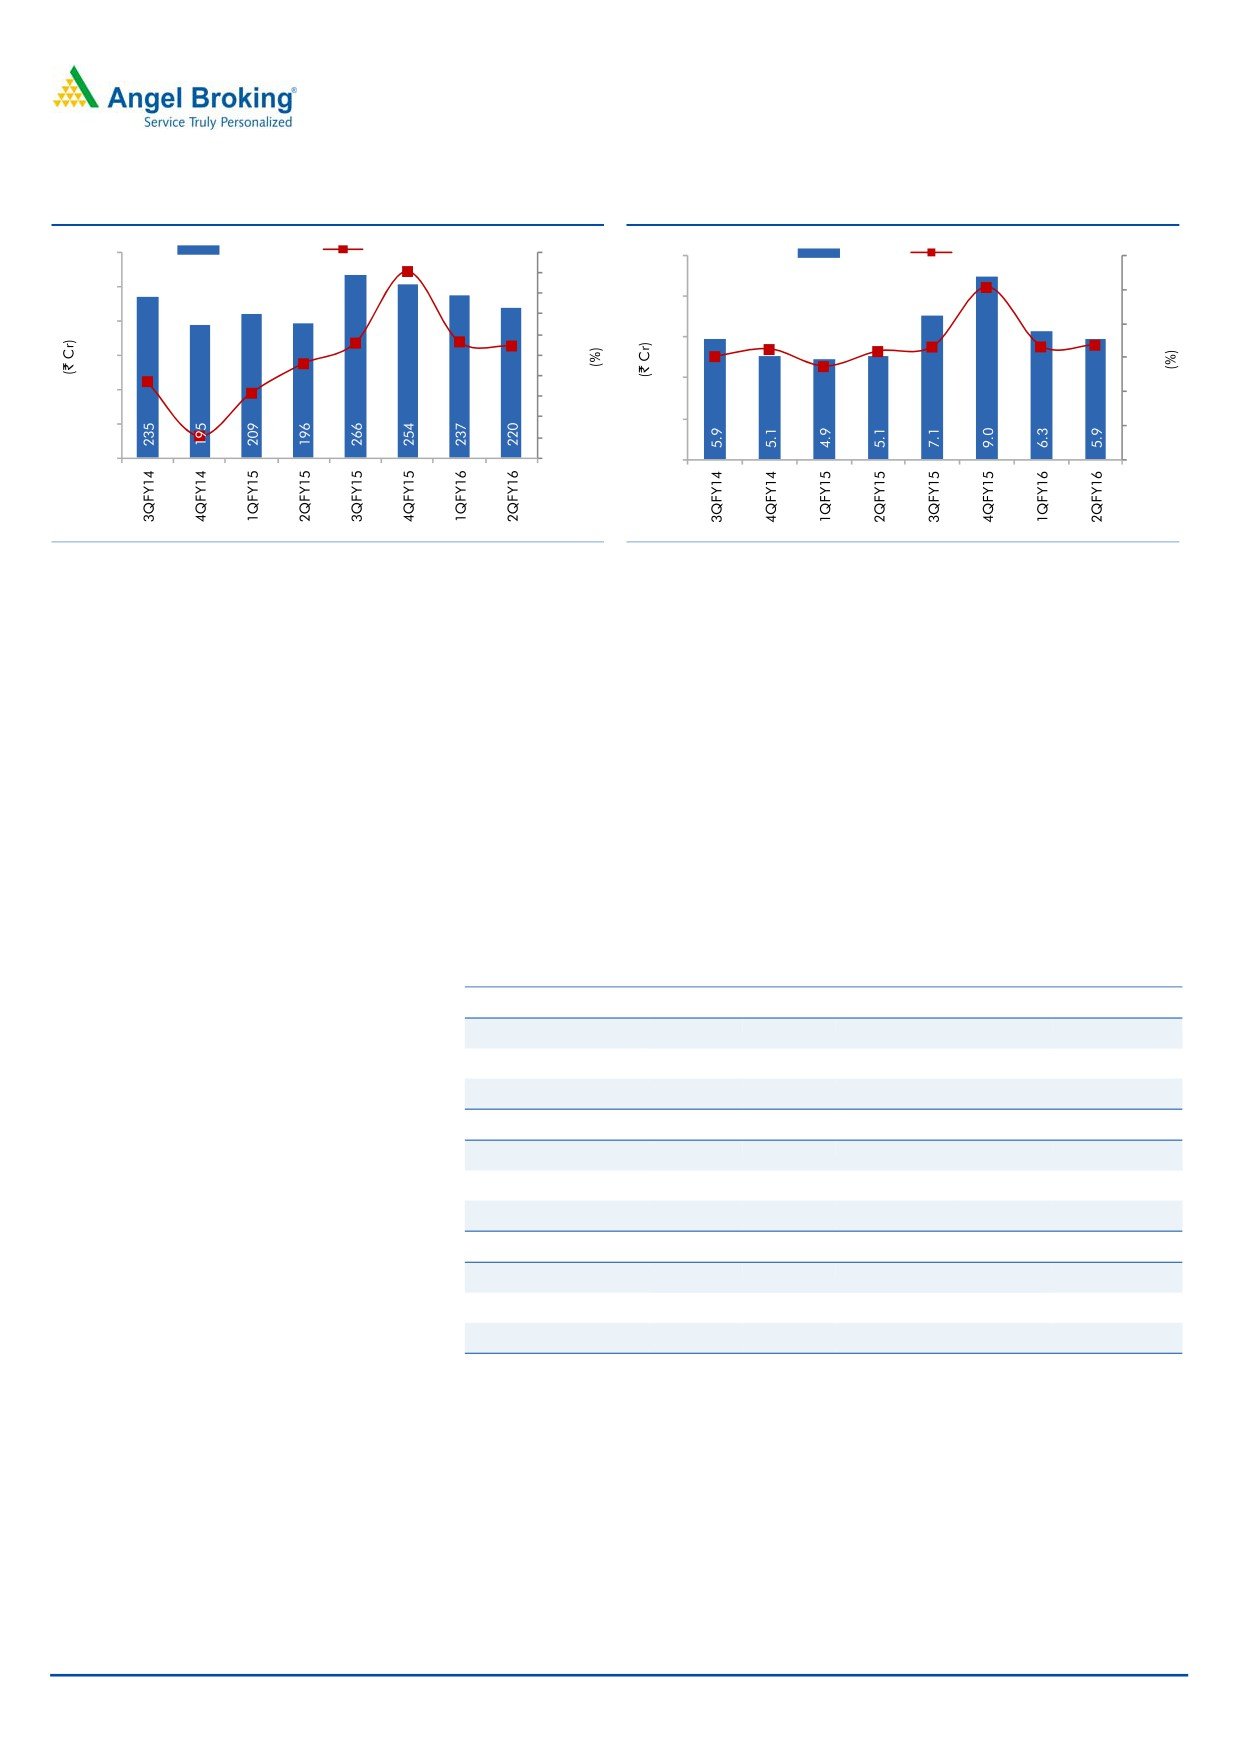
Exhibit 3: Sales growth continues
Exhibit 4: Operating performance
300
Net Sales
Sales yoy growth
35.0
EBIDTA
EBIDTA margins
10
4.0
30.3
30.0
3.5
250
3.5
25.0
8
20.0
2.7
200
2.7
3.0
2.5
15.0
2.6
2.6
13.2
6
2.4
2.7
12.9
12
.2
150
10.0
2.5
7.9
5.0
4
3.5
100
2.0
0.7
-
(9.7)
(5.0)
2
50
1.5
(10.0)
-
(15.0)
-
1.0
Source: Company, Angel Research
Source: Company, Angel Research
Segmental performance
For 2QFY2016, Showroom revenues grew by 12.2% yoy to `197cr. EBIT for the
segment came in at `2.5cr, an increase of 8.6% yoy. The segment’s EBIT margin at
1.3% remained flat on both yoy and qoq basis. During the same period, MSIL
reported a 17.5% yoy revenue growth in the domestic market. MSIL’s volumes
grew 12.4% on a yoy basis coupled with realization growth of ~4.5% yoy during
the quarter.
For 2QFY2016, Services and spares revenue grew by 12.3% yoy to `23cr. EBIT
improved to `2.6cr, a 46.1% increase on a yoy basis, with EBIT margin improving
to 11.2% as against 8.6% in 2QFY2015.
Exhibit 5: Segment-wise performance
Y/E Mar (` cr)
2QFY16
2QFY15
% chg (yoy) 1QFY16
% chg (qoq)
Total Revenue
Showroom
197
175
12.2
213
(7.8)
Services and Spares
23
20
12.3
23
(2.1)
Total
254
195
30.3
266
(4.4)
EBIT
Showroom
2.5
2.3
8.6
2.9
(13.5)
Services and Spares
2.6
1.8
46.1
2
36.9
Total
5.4
4.2
29.4
6.2
(11.8)
EBIT Margin (%)
Showroom
1.3
1.3
70.6
1.3
(8)bp
Services and Spares
11.2
8.6
374.3
8.0
319bp
Source: Company, Angel Research
November 17, 2015
3
Competent Auto | 2QFY2016 Result Update
Investment Rationale
Proxy play to Maruti: The top-line performance of the company is closely linked to
the performance of MSIL. We expect MSIL to post robust volume CAGR of 12.6%
over FY2015-17E, which will translate to better top-line for Competent. Also, we
expect Competent’s market share to remain stable/improve, as entry of a new
dealer seems to be commercially unviable with property prices having soared
significantly in the Delhi region. Competent is also likely to benefit from MSIL’s
plan to launch new products in the new segments in order to outgrow the market.
With lower fuel prices scenario prevailing, we expect Competent to benefit from
favorable outlook for MSIL.
Further, higher vehicle sales would likely get converted into greater demand for
after sale services, thus bringing in additional revenue for Competent. All these
factors augur well for Competent’s future financial performance.
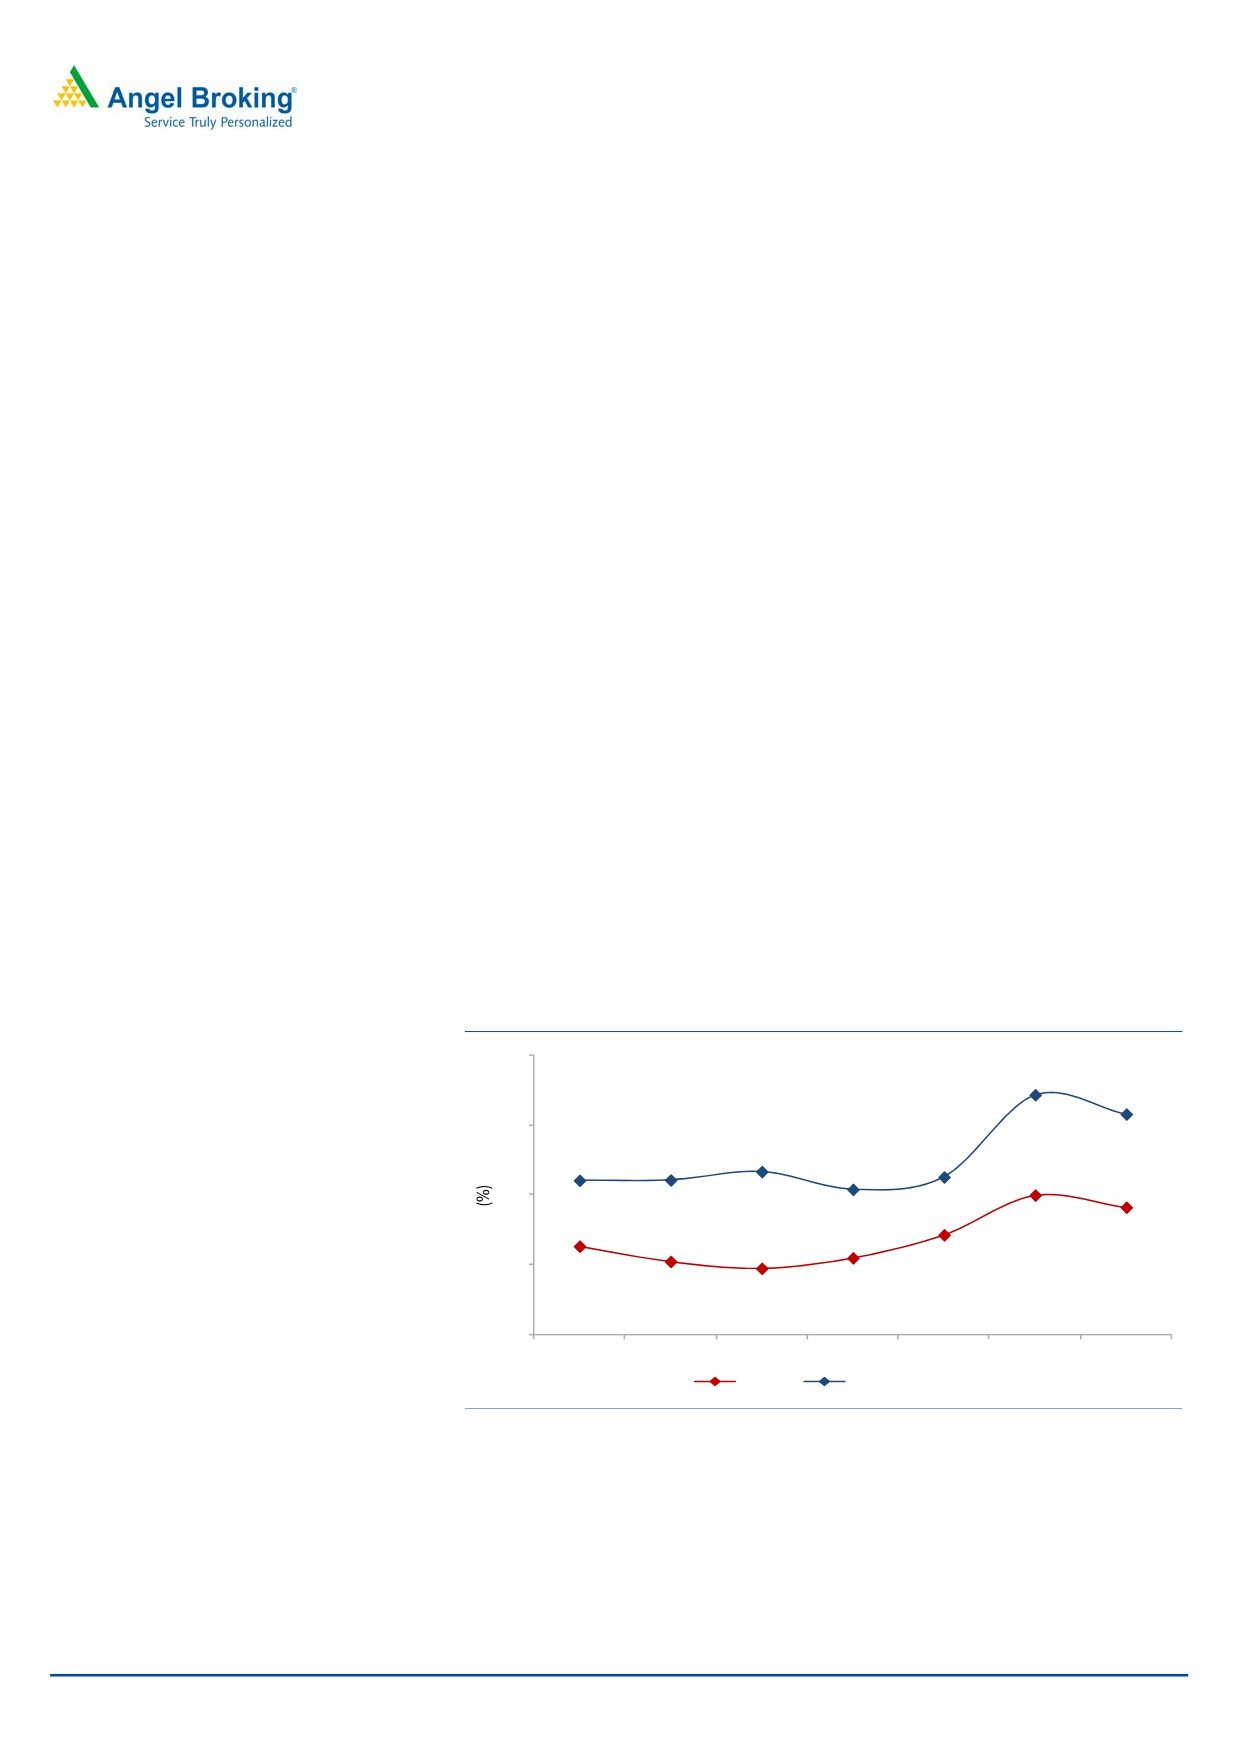
Scalable business model with healthy balance sheet: The company
operates in two segments, namely Showroom and Services & Spares. The
Showroom segment deals with purchase and sale of vehicles manufactured by
MSIL. The Service and Spares segment includes servicing of Maruti vehicles and
sale of their spare parts. The business model being scalable enables the company
to sustain its revenue growth trajectory. Further, the company is increasing focus
on its Service & Spares business where the margins are higher than the Showroom
business. The company has increased its short term debt in the 1HFY2016E ahead
of the festive season mainly utilizing the funds for inventory. We expect the
company to reduce this debt level by year end. With profitability expected to
improve due to decent revenue growth and improvement in margins, the return
ratios are expected to improve going ahead.
Exhibit 6: Return Ratios to improve...
23
20.7
19.6
19
16.3
15.8
15.9
16.0
15.3
15
15.0
14.3
11
12.7
12.1
11.2
11.4
10.8
7
FY2011
FY2012
FY2013
FY2014
FY2015
FY2016E FY2017E
ROE
ROCE (Pre-tax)
Source: Company, Angel Research
November 17, 2015
4
Competent Auto | 2QFY2016 Result Update
Company Financials
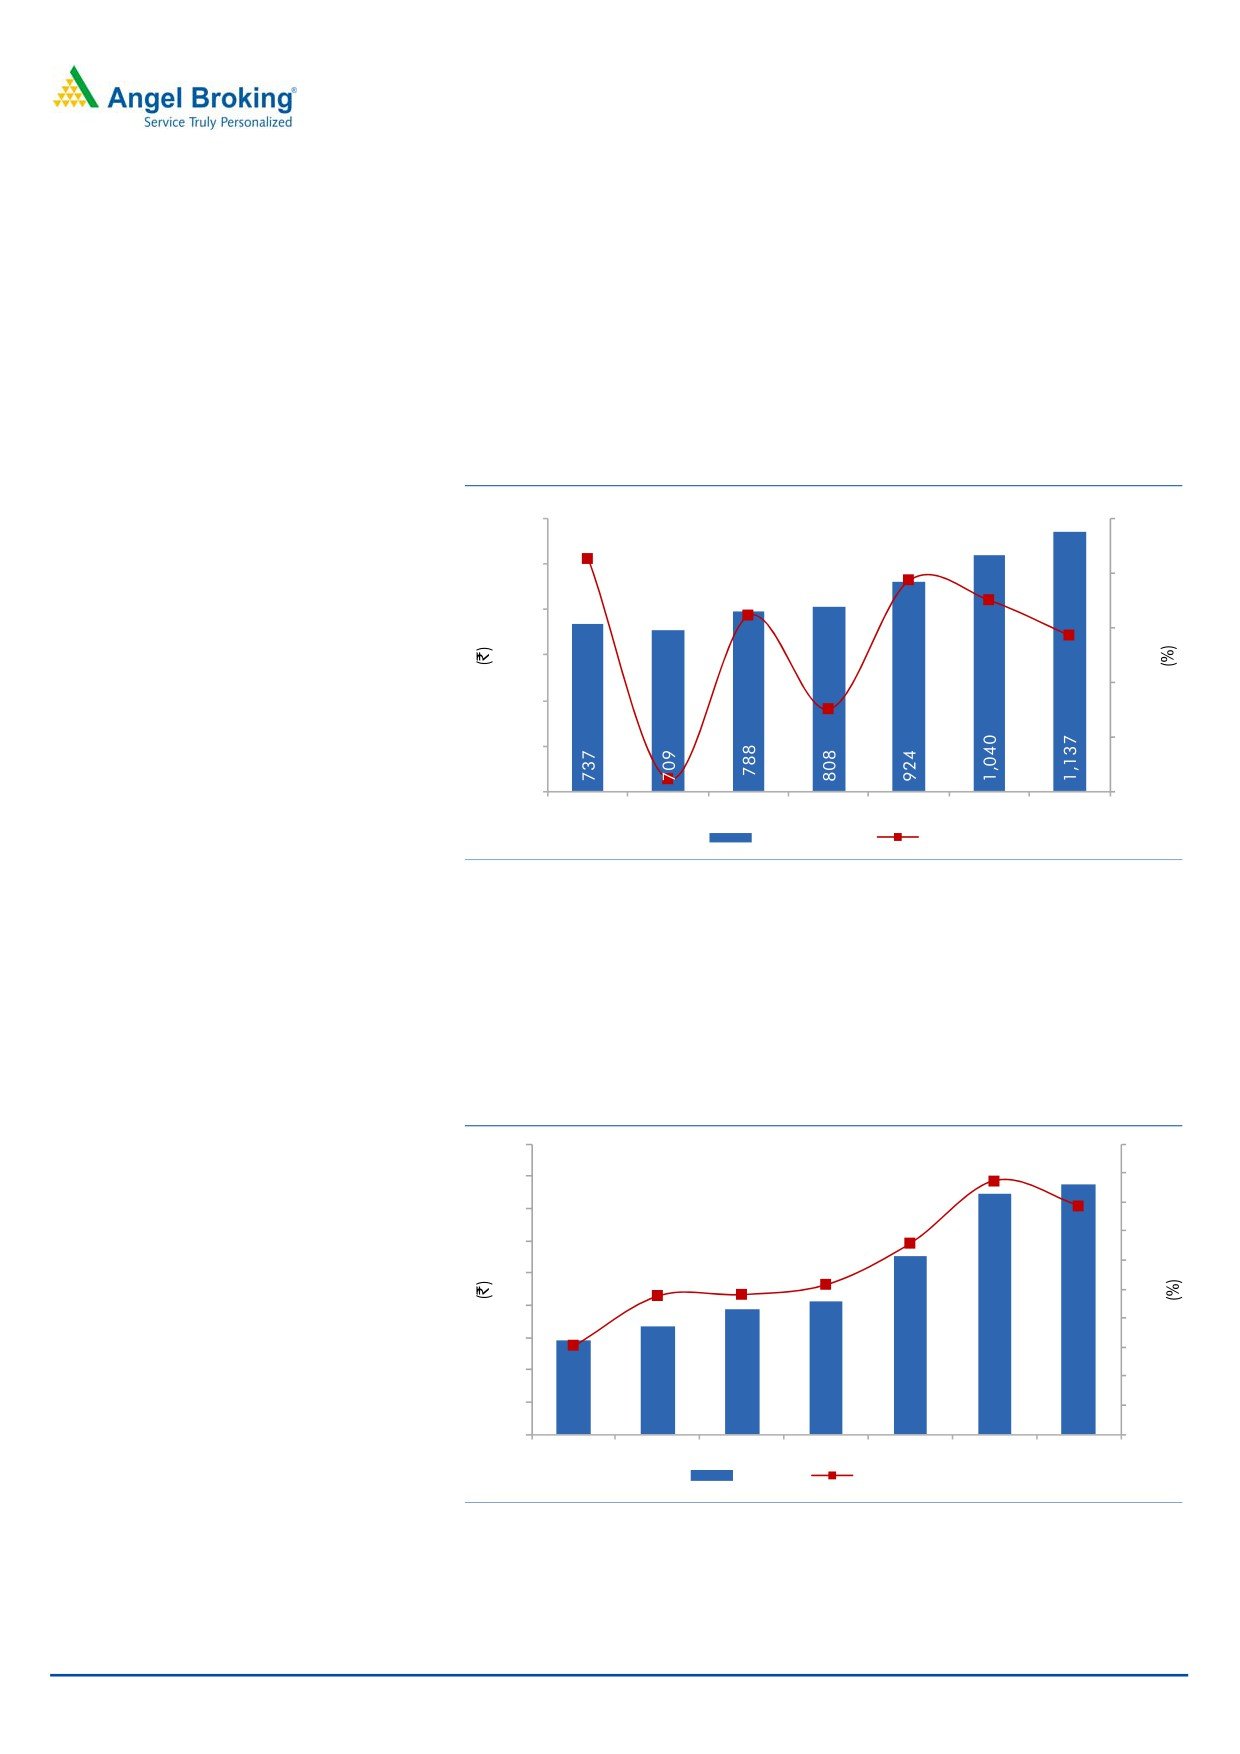
Net sales expected to post 10.9% CAGR over FY2015-17E
The top-line performance of the company is closely linked to the performance of
MSIL. We expect MSIL to post strong sales growth going ahead on account of new
product launches scheduled over the next one year. As a result, we expect
Competent to post a 10.9% CAGR in revenue over FY2015-17E to `1,137cr in
FY2017E.
Exhibit 7: Net sales and net sales growth
12.5
1,200
9.3
20.0
16.3
1,000
14.4
15.0
11.2
2.6
800
10.0
600
5.0
400
-
200
(3.8)
0
(5.0)
FY2011
FY2012
FY2013
FY2014
FY2015
FY2016E FY2017E
Net Sales
Sales growth
Source: Company, Angel Research
EBITDA to post 15.9% CAGR over FY2015-17
The company’s EBITDA is expected to rise from `26cr in FY2015 to `35cr in
FY2017. The EBITDA margin is expected to improve from 2.8% in FY2015 to 3.1%
in FY2017.
Exhibit 8: EBIDTA and EBIDTA margins to improve
40
3.5
3.2
3.1
3.3
36
3.1
32
2.8
2.9
28
2.5
2.7
24
2.5
2.5
2.5
20
2.1
2.3
16
2.1
12
1.9
8
1.7
16
17
19
20
26
34
35
4
1.5
FY2011
FY2012
FY2013
FY2014
FY2015
FY2016E FY2017E
EBIDTA
EBIDTA margins
Source: Company, Angel Research
November 17, 2015
5
Competent Auto | 2QFY2016 Result Update
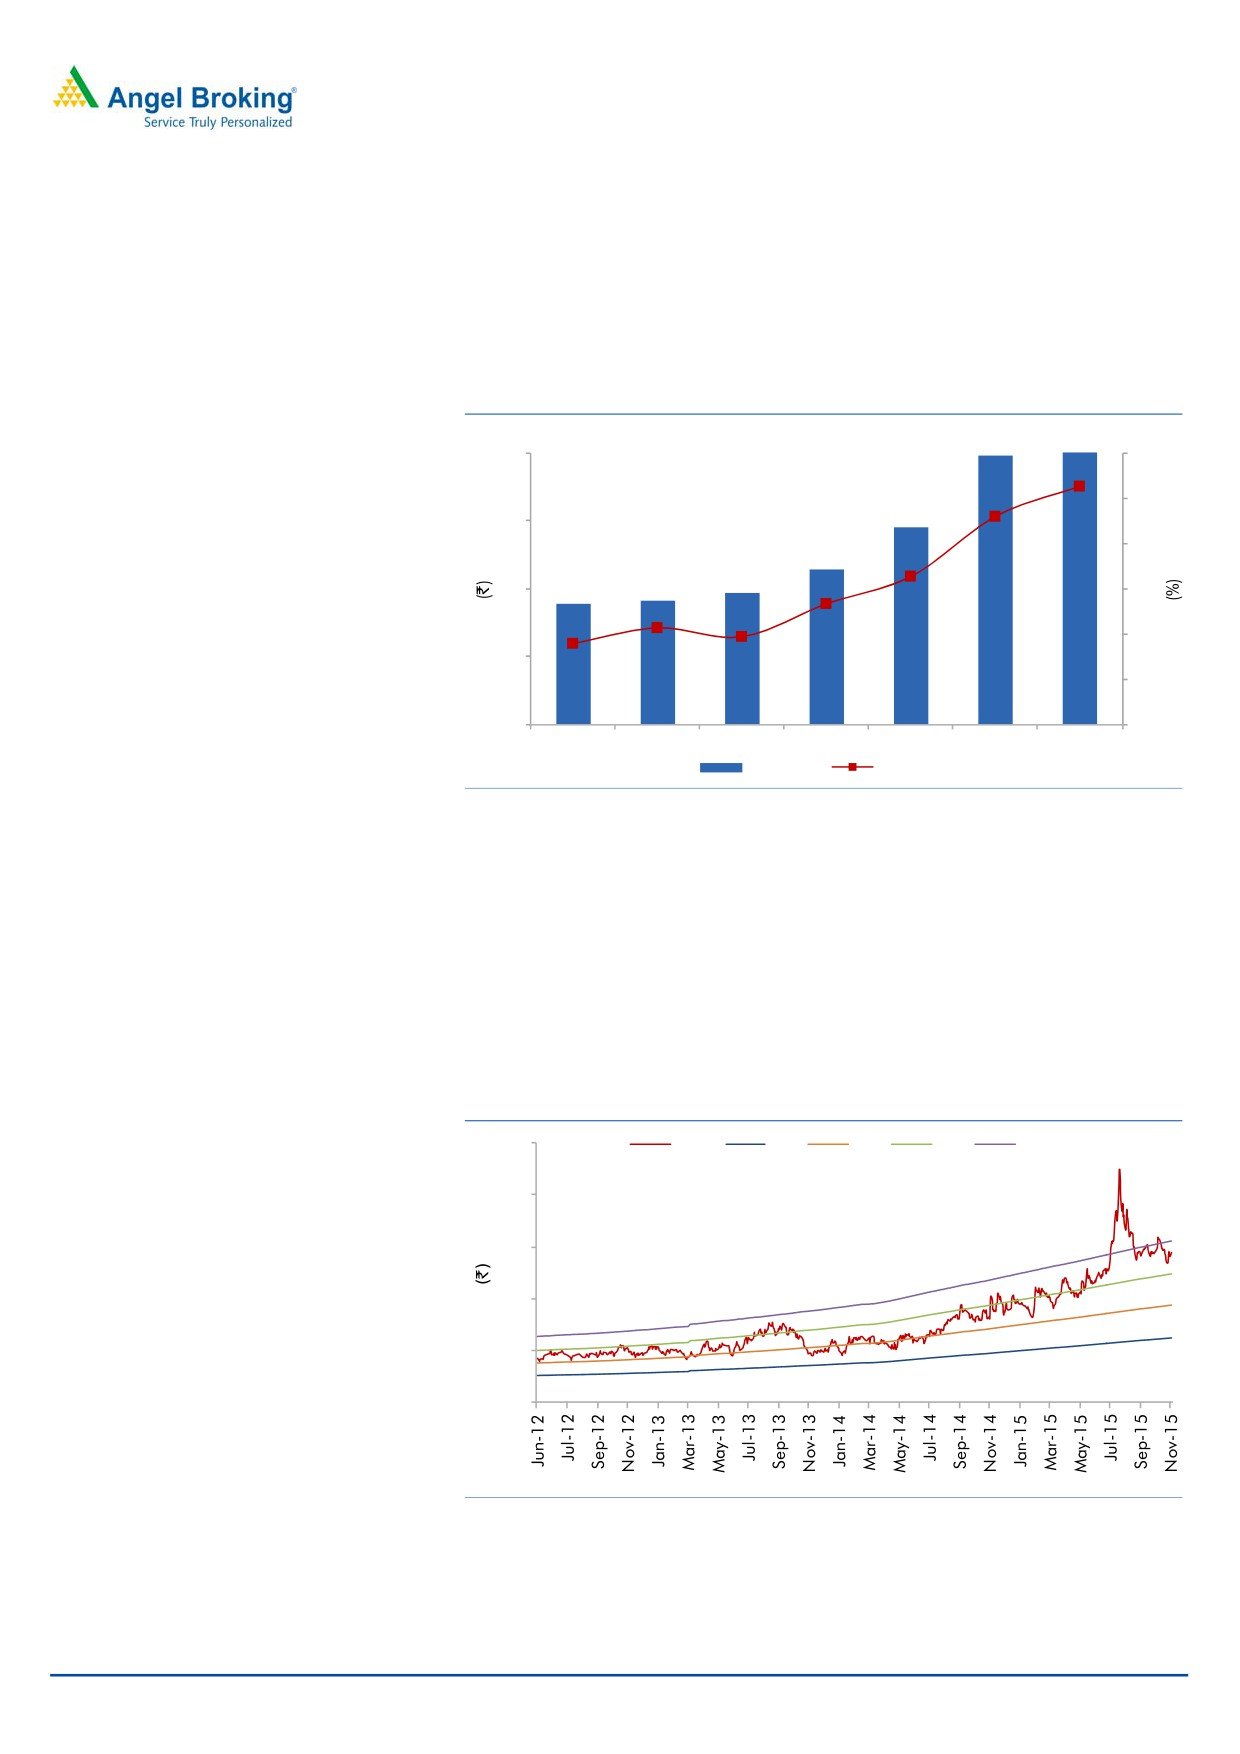
Net profit to grow at 21.7% CAGR over FY2015-17
The company’s bottom-line is expected to get a boost from an estimated
improvement in its EBIDTA and EBIDTA margins; the bottom-line is expected to
grow at a CAGR of 21.7% over FY2015-17 to `17cr. As a result, the PAT margins
are expected to improve from 1.3% in FY2014 to 1.7% in FY2017.
Exhibit 9: PAT and PAT margins to improve
1.7
1.5
16
1.8
1.6
12
1.3
1.4
1.1
8
1.0
1.0
1.2
1.0
1.0
4
0.8
7
7
8
9
12
16
17
-
0.6
FY2011
FY2012
FY2013
FY2014
FY2015
FY2016E FY2017E
ADJ. PAT
PAT margins
Source: Company, Angel Research
Outlook and Valuation: We believe that Competent will continue to benefit
from its established position in the automobile dealership market in Delhi,
Haryana, and Himachal Pradesh, and from its conducive relationship with its
principal, MSIL. During FY2015-17, we expect the company to register a top-line
and bottom-line CAGR of 10.9% and 20.8%, to `1,137cr and `17cr, respectively.
Currently, the stock trades at 5.1x its FY2107E earnings. We have a Neutral rating
on the stock.
Exhibit 10: One-year forward P/E band
250
Price
2 x
3 x
4 x
5 x
200
150
100
50
0
Source: Company, Angel Research
November 17, 2015
6
Competent Auto | 2QFY2016 Result Update
Company Background
Competent Automobiles is mainly in the business of trading and servicing of
Maruti Suzuki (MSIL) vehicles. The company operates in two segments, namely,
Showroom and Services & Spares. The Showroom segment deals with sale of
vehicles manufactured by MSIL. Competent Automobiles has 14 Maruti Showroom
Network spread across Delhi NCR, Haryana and Himachal with State of Art facility
and customer support team at each dealership.
Key Risks
Unsatisfactory utilization of funds - Further diversion of cash in unrelated
business. The company invested `7.5cr (as on March 2014) in Raj Chopra &
Company Pvt Ltd, which is owned by Mr. Raj Chopra (CMD). As of 1HFY2016,
it appears that the company has invested additional amount taking the non-
current investment figure to `34cr for the period.
Increased competition due to entry of new players and appointment of new
dealers by MSIL. Launch of new models by competing OEMs to Maruti have
also increased market competition.
Higher inflation and interest rates coupled with significant increase in fuel
prices could hurt vehicle sales.
November 17, 2015
7
Competent Auto | 2QFY2016 Result Update
Profit and loss statement
Y/E March (` cr)
FY2013
FY2014
FY2015
FY2016E
FY2017E
Net Sales
788
808
924
1,040
1,137
Other operating income
-
-
-
-
-
Total operating income
788
808
924
1,040
1,137
% chg
11.2
2.6
14.4
12.5
9.3
Purchase of Stock in Trade
712
729
831
926
1014
% chg
14.5
2.4
13.9
11.4
9.5
Power and Fuel costs
2
2
2
4
5
% chg
(20.9)
33.8
3.3
73.0
9.3
Personnel
19
21
24
30
33
% chg
13.2
8.5
17.5
23.3
9.3
Other
35
35
41
46
51
% chg
(29.5)
0.8
14.8
14.3
9.5
Total Expenditure
768
788
898
1,007
1,102
EBITDA
19.4
20.5
26.0
33.7
34.9
% chg
11.5
5.4
27.2
29.6
3.5
EBITDA Margin
2.5
2.5
2.8
3.2
3.1
Depreciation & Amortisation
4
4
6
5
5
EBIT
15
17
20
29
30
% chg
12.2
8.7
17.1
46.2
3.3
(% of Net Sales)
2.0
2.1
2.1
2.8
2.6
Interest & other Charges
5
5
5
7
5
Other Income
1
1
1
1
1
(% of Net Sales)
0.1
0.2
0.1
0.1
0.1
Recurring PBT
11
12
15
22
24
% chg
9.0
12.7
21.0
50.7
9.3
PBT (reported)
11
14
16
24
26
Tax
4
4
4
8
8
(% of PBT)
32
33
28
33
33
PAT (reported)
8
9
12
16
17
Extraordinary Expense/(Inc.)
-
-
-
-
-
ADJ. PAT
8
9
12
16
17
% chg
7.0
17.6
26.6
36.3
8.7
(% of Net Sales)
1.0
1.1
1.3
1.5
1.7
Basic EPS (`)
12.7
14.9
18.9
25.7
28.0
Fully Diluted EPS (`)
12.7
14.9
18.9
25.7
28.0
% chg
7.0
17.6
26.6
36.3
8.7
November 17, 2015
8
Competent Auto | 2QFY2016 Result Update
Balance sheet
Y/E March (` cr)
FY2013
FY2014
FY2015
FY2016E
FY2017E
SOURCES OF FUNDS
Equity Share Capital
6
6
6
6
6
Preference Capital
-
-
-
-
-
Reserves& Surplus
66
74
85
99
114
Shareholders’ Funds
72
80
91
106
120
Minority Interest
-
-
-
-
-
Total Loans
23
30
33
35
33
Other long term liabilities
0
0
0
0
0
Net Deferred tax liability
(0.6)
(0.4)
(1.4)
(1.4)
(1.4)
Total Liabilities
95
110
123
139
152
APPLICATION OF FUNDS
Gross Block
73
75
80
84
88
Less: Acc. Depreciation
29
32
38
43
48
Net Block
44
43
42
41
40
Capital Work-in-Progress
6
9
12
9
7
Lease adjustment
-
-
-
-
-
Goodwill
-
-
-
-
-
Investments
0
8
12
34
34
Other non-current assets
0
1
1
1
1
Current Assets
84
94
123
119
135
Cash
7
8
32
16
24
Loans & Advances
3
5
1
1
1
Other current assets
0
0
4
4
4
Current liabilities
45
51
73
72
74
Net Current Assets
39
43
50
46
62
Mis. Exp. not written off
-
-
-
-
-
Total Assets
95
110
123
139
152
November 17, 2015
9
Competent Auto | 2QFY2016 Result Update
Cash Flow Statement
Y/E March (` cr)
FY2013 FY2014 FY2015E FY2016E FY2017E
Profit before tax
11
14
16
24
26
Depreciation
4
4
6
5
5
(Inc.)/ Dec. in Working Capital
(1)
(1)
(1)
(1)
(1)
Less: Other income
(3)
(3)
17
(13)
(7)
Direct taxes paid
(4)
(4)
(4)
(8)
(8)
Cash Flow from Operations
8
9
34
7
14
(Inc.)/ Dec. in Fixed Assets
(12)
(5)
(7)
(1)
(2)
(Inc.)/ Dec. in Investments
3
(10)
(5)
(23)
(1)
Other income
1
1
1
1
1
Cash Flow from Investing
(8)
(13)
(11)
(23)
(1)
Issue of Equity
-
-
-
-
-
Inc./(Dec.) in loans
1
7
2
2
(2)
Dividend Paid (Incl. Tax)
(1)
(1)
(1)
(2)
(2)
Others
(1)
(1)
-
-
-
Cash Flow from Financing
(1)
5
2
0
(5)
Inc./(Dec.) in Cash
(0)
1
24
(16)
8
Opening Cash balances
7
7
8
32
16
Closing Cash balances
7
8
32
16
24
November 17, 2015
10
Competent Auto | 2QFY2016 Result Update
Key Ratios
Y/E March
FY2013
FY2014
FY2015
FY2016E
FY2017E
Valuation Ratio (x)
P/E (on FDEPS)
11.4
9.6
7.6
5.6
5.1
P/CEPS
7.6
6.9
4.9
4.3
4.0
P/BV
1.2
1.1
1.0
0.8
0.7
Dividend yield (%)
0.8
0.8
0.9
1.8
2.7
EV/Sales
0.1
0.1
0.1
0.1
0.1
EV/EBITDA
5.4
5.0
3.0
2.2
1.8
EV / Total Assets
1.1
0.9
0.6
0.5
0.4
Per Share Data (`)
EPS (Basic)
12.7
14.9
18.9
25.7
28.0
EPS (fully diluted)
12.7
14.9
18.9
25.7
28.0
Cash EPS
19.1
20.8
29.1
33.7
36.4
DPS
1.0
1.0
1.0
2.0
3.0
Book Value
117.5
131.0
148.6
171.7
195.8
Dupont Analysis
EBIT margin
2.0
2.1
2.1
2.8
2.6
Tax retention ratio
0.7
0.7
0.7
0.7
0.7
Asset turnover (x)
9.6
9.4
13.6
12.9
13.1
ROIC (Post-tax)
12.9
13.2
20.9
24.0
22.9
Cost of Debt (Post Tax)
13.7
10.5
10.7
12.6
11.1
Leverage (x)
0.2
0.2
(0.1)
(0.1)
(0.2)
Operating ROE
12.7
13.7
19.8
22.4
20.4
Returns (%)
ROCE (Pre-tax)
16.3
15.3
16.0
20.7
19.6
Angel ROIC (Pre-tax)
18.9
19.6
29.1
35.8
34.2
ROE
10.8
11.4
12.7
15.0
14.3
Turnover ratios (x)
Asset Turnover (Gross Block)
10.7
10.8
11.6
12.4
12.9
Inventory / Sales (days)
23
27
25
24
24
Receivables (days)
8
8
8
8
8
Payables (days)
21
23
24
25
24
WC cycle (ex-cash) (days)
14
15
11
9
11
Solvency ratios (x)
Net debt to equity
0.2
0.2
(0.1)
(0.1)
(0.2)
Net debt to EBITDA
0.8
0.7
(0.4)
(0.4)
(0.7)
Interest Coverage (EBIT / Int.)
3.3
3.7
4.0
4.4
5.5
November 17, 2015
11
Competent Auto | 2QFY2016 Result Update
Research Team Tel: 022 - 39357800
DISCLAIMER
Angel Broking Private Limited (hereinafter referred to as “Angel”) is a registered Member of National Stock Exchange of India Limited,
Bombay Stock Exchange Limited and Metropolitan Stock Exchange of India Limited. It is also registered as a Depository Participant with
CDSL and Portfolio Manager with SEBI. It also has registration with AMFI as a Mutual Fund Distributor. Angel Broking Private Limited is
a registered entity with SEBI for Research Analyst in terms of SEBI (Research Analyst) Regulations, 2014 vide registration number
INH000000164. Angel or its associates has not been debarred/ suspended by SEBI or any other regulatory authority for accessing
/dealing in securities Market. Angel or its associates including its relatives/analyst do not hold any financial interest/beneficial
ownership of more than 1% in the company covered by Analyst. Angel or its associates/analyst has not received any compensation /
managed or co-managed public offering of securities of the company covered by Analyst during the past twelve months. Angel/analyst
has not served as an officer, director or employee of company covered by Analyst and has not been engaged in market making activity
of the company covered by Analyst.
This document is solely for the personal information of the recipient, and must not be singularly used as the basis of any investment
decision. Nothing in this document should be construed as investment or financial advice. Each recipient of this document should
make such investigations as they deem necessary to arrive at an independent evaluation of an investment in the securities of the
companies referred to in this document (including the merits and risks involved), and should consult their own advisors to determine
the merits and risks of such an investment.
Reports based on technical and derivative analysis center on studying charts of a stock's price movement, outstanding positions and
trading volume, as opposed to focusing on a company's fundamentals and, as such, may not match with a report on a company's
fundamentals.
The information in this document has been printed on the basis of publicly available information, internal data and other reliable
sources believed to be true, but we do not represent that it is accurate or complete and it should not be relied on as such, as this
document is for general guidance only. Angel Broking Pvt. Limited or any of its affiliates/ group companies shall not be in any way
responsible for any loss or damage that may arise to any person from any inadvertent error in the information contained in this report.
Angel Broking Pvt. Limited has not independently verified all the information contained within this document. Accordingly, we cannot
testify, nor make any representation or warranty, express or implied, to the accuracy, contents or data contained within this document.
While Angel Broking Pvt. Limited endeavors to update on a reasonable basis the information discussed in this material, there may be
regulatory, compliance, or other reasons that prevent us from doing so.
This document is being supplied to you solely for your information, and its contents, information or data may not be reproduced,
redistributed or passed on, directly or indirectly.
Neither Angel Broking Pvt. Limited, nor its directors, employees or affiliates shall be liable for any loss or damage that may arise from
or in connection with the use of this information.
Note: Please refer to the important ‘Stock Holding Disclosure' report on the Angel website (Research Section). Also, please refer to the
latest update on respective stocks for the disclosure status in respect of those stocks. Angel Broking Pvt. Limited and its affiliates may
have investment positions in the stocks recommended in this report.
Disclosure of Interest Statement
Competent Auto
1. Analyst ownership of the stock
No
2. Angel and its Group companies ownership of the stock
No
3. Angel and its Group companies' Directors ownership of the stock
No
4. Broking relationship with company covered
No
Note: We have not considered any Exposure below ` 1 lakh for Angel, its Group companies and Directors
Ratings (Based on expected returns
Buy (> 15%)
Accumulate (5% to 15%)
Neutral (-5 to 5%)
over 12 months investment period):
Reduce (-5% to -15%)
Sell (< -15)
November 17, 2015
12