2QFY2016 Result Update | Mining
November 16, 2015
Coal India
ACCUMULATE
CMP
`338
Performance Highlights
Target Price
`380
(` cr)
2QFY16
2QFY15
% yoy
1QFY16
% qoq
Investment Period
12 months
Net Sales
16,958
15,678
8.2
18,956
(10.5)
Stock Info
EBITDA
3,008
2,556
17.7
4,944
(39.2)
Sector
Mining
% margin
17.2
15.8
139bp
25.3
(813bp)
Market Cap (` cr)
2,13,272
Net Profit
2,519
2,188
15.2
3,787
(33)
Net Debt (` cr)
(49,805)
Source: Company, Angel Research
Beta
0.7
For 2QFY2016, Coal India (CIL) reported a strong 8% yoy increase in revenue to
52 Week High / Low
447/301
`16,958cr, in line with our estimate of `16,833cr. Off-take volumes were
Avg. Daily Volume
46,02,127
marginally ahead of our expectations at 121.8MT (our estimate was of 119.1MT).
Face Value (`)
10
Off-take was higher in the FSA segment with e-auction and washeries’ volumes in
BSE Sensex
25,611
line with expectations. FSA realizations were in line with expectations at `1,294/T.
Nifty
7,762
However, e-auction realizations came in much lower than expected at `1,788.
Reuters Code
COAL.BO
Blended realization/tonne came in lower than our expectation at `1,392 (1.5%
Bloomberg Code
COAL@IN
lower than our estimate of `1,414), led by the sharply lower e-auction realisation.
Blended realisation declined 2% yoy, while off-take increased 10.2% yoy, resulting
in an 8.2% increase in net sales. The EBITDA, at `3,008cr, came in 3.2% lower
Shareholding Pattern (%)
than our estimate, resulting in a 140bp improvement in EBITDA margin to 17.2%,
Promoters
79.7
marginally lower than our estimate of 17.9%. Net profit at `2,544cr was slightly
MF / Banks / Indian Fls
8.4
ahead of our estimate of `2,445cr.
FII / NRIs / OCBs
9.0
Indian Public / Others
2.9
Outlook and valuation
We reduce our consolidated FY2016 and FY2017 EPS estimates by 12% and 9%,
respectively, in view of the lower than expected realizations and increased
Abs. (%)
3m 1yr
3yr
operating expenses. We expect CIL’s production to increase by 7.1% to 530MT in
Sensex
(7.0)
(8.3)
37.6
FY2016 (538MT earlier) and 572MT in FY2017 (575 MT earlier). We expect e-
CIL
(10.5)
(2.8)
(2.4)
auction realization to remain under pressure led by weakness in global
commodity prices and increased availability of coal in FY2016. We value Coal
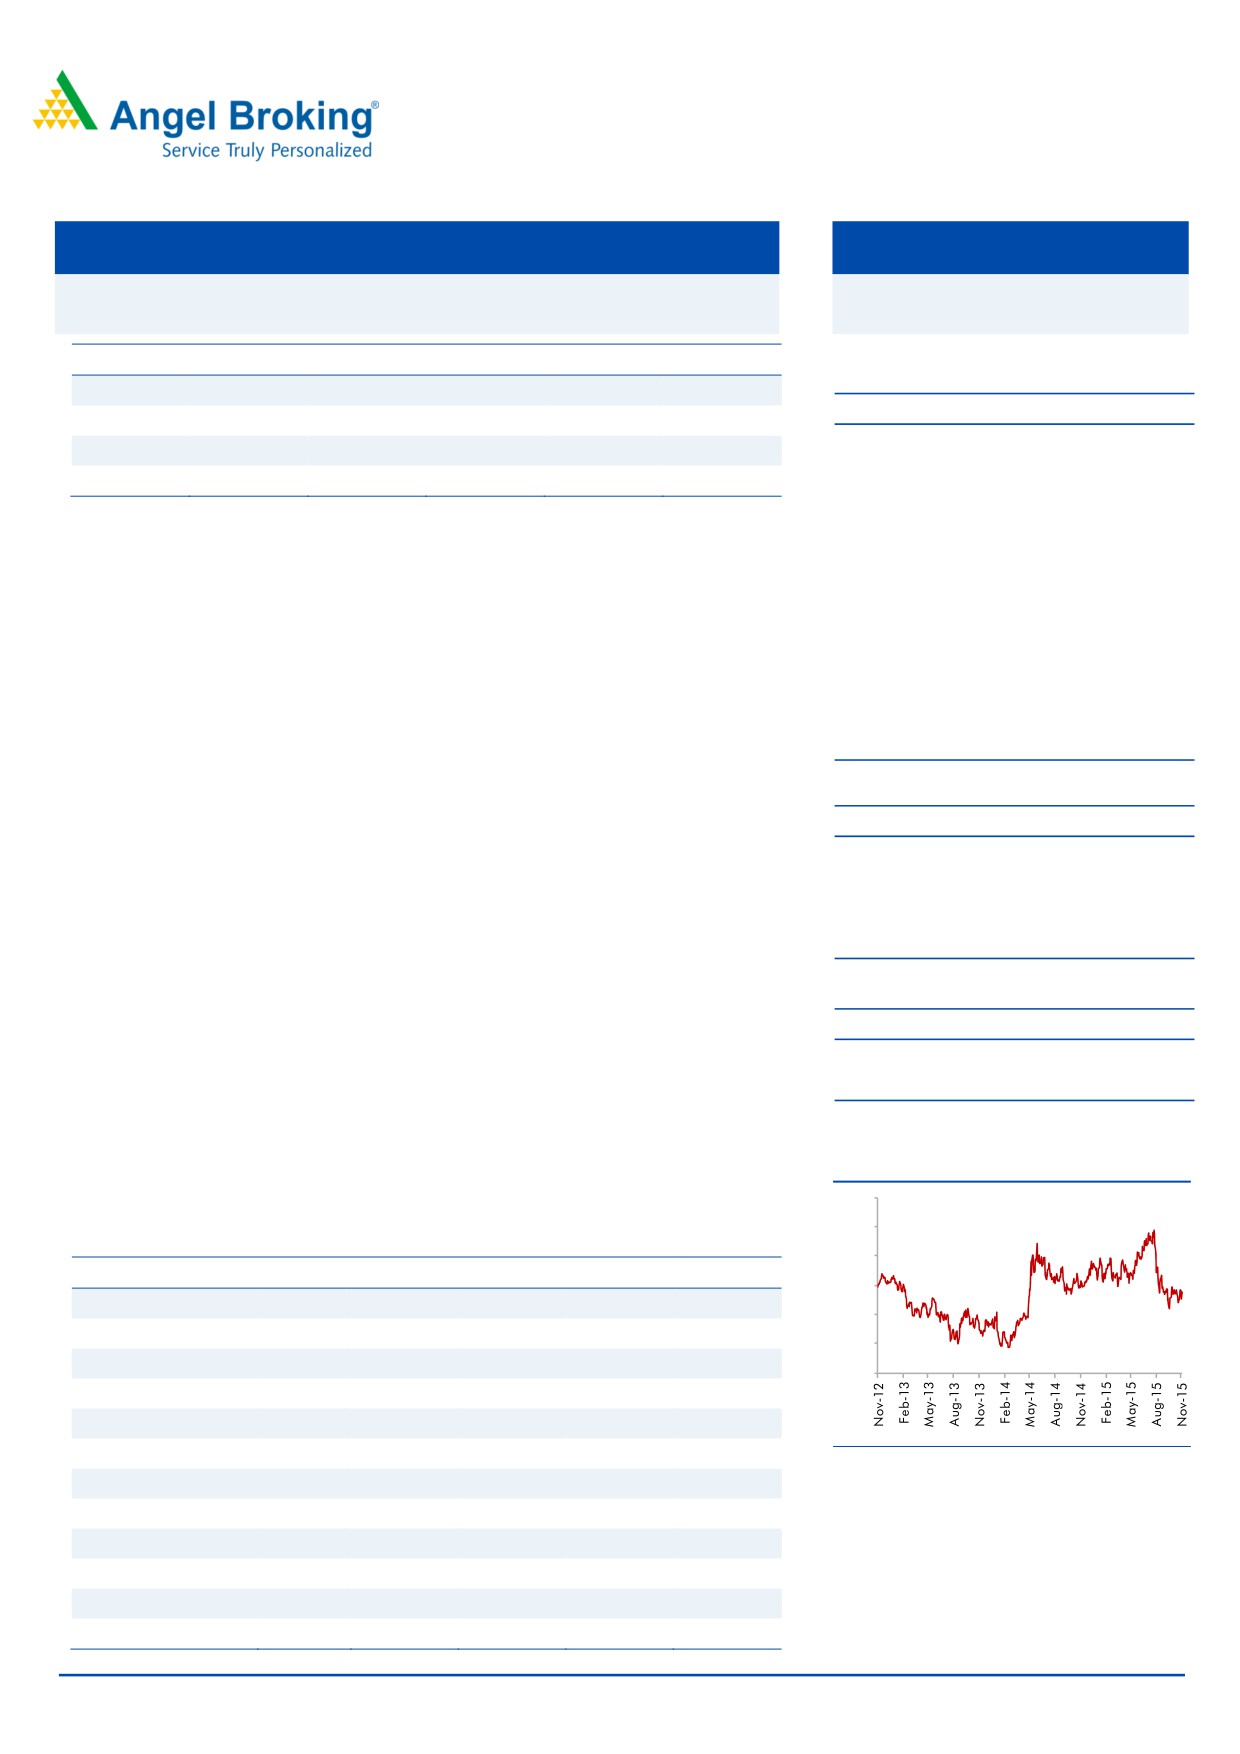
3-year price chart
India at 8x FY2017E Adj. EBITDA to arrive at a revised target price of `380 (`400
500
earlier) and retain our Accumulate rating on the stock.
450
Key financials (Consolidated)
400
Y/E March (` Cr)
FY2013
FY2014E
FY2015E
FY2016E
FY2017E
350
Net Sales
68,303
68,810
72,015
76,167
84,130
300
% chg
9.4
0.7
4.7
5.8
10.5
250
Net Profit
17,350
15,110
13,722
14,161
16,314
200
% chg
17.4
(12.9)
(9.2)
3.2
15.2
FDEPS (`)
27.5
23.9
21.7
22.4
25.8
OPM (%)
26.5
23.2
21.1
19.9
22.3
Source: Company, Angel Research
P/E (x)
12.3
14.1
15.5
15.1
13.1
P/BV (x)
4.4
5.0
5.3
5.4
5.3
RoE (%)
39.0
33.2
33.1
35.5
41.0
RoCE (%)
22.0
17.1
15.9
15.3
18.6
Rahul Dholam
EV/Sales (x)
1.8
2.3
2.2
2.1
1.9
Tel: 022- 3935 7800 Ext: 6847
EV/Adj. EBITDA (x)
5.7
8.2
8.4
9.2
7.5
Source: Company, Angel Research: Note CMP as of November 13, 2015
Please refer to important disclosures at the end of this report
1
Coal India | 2QFY2016 Result Update
Exhibit 1: 2QFY2016 performance (Consolidated)
Y/E March (` cr)
2QFY16
2QFY15
% yoy
1QFY16
% qoq
FY2015
FY2014
% yoy
Net sales
16,958
15,678
8.2
18,956
(10.5)
72,015
68,810
4.7
Other operating income
532
486
9.4
562
(5.3)
2,105
1,798
17.1
Total Income
17,490
16,164
8.2
19,518
(10.4)
74,120
70,608
5.0
Raw material expenses
2,356
2,423
(2.8)
2,180
8.1
6,726
7,115
(5.5)
(% of Net Sales)
13.9
15.5
11.5
9.3
10.3
Staff cost
7,530
7,287
3.3
7,185
4.8
29,859
27,769
7.5
(% of Net Sales)
44.4
46.5
37.9
41.5
40.4
Power & Fuel
654
585
11.7
588
11.1
2,347
2,282
2.9
(% of Net Sales)
3.9
3.7
3.1
3.3
3.3
Social Overhead
186
129
44.7
177
5.1
405
735
(44.8)
(% of Net Sales)
1.1
0.8
0.9
0.6
1.1
Contractual Expenses
2,254
1,626
38.6
2,490
(9.5)
8,513
6,828
24.7
(% of Net Sales)
13.3
10.4
13.1
11.8
9.9
Other Expenses
1,501
1,558
(3.6)
1,953
(23.1)
8,935
8,118
10.1
(% of Net Sales)
8.9
9.9
10.3
12.4
11.8
Total expenditure
14,481
13,608
6.4
14,574
(0.6)
56,785
52,847
7.5
(% of Net Sales)
85.4
86.8
76.9
78.9
76.8
EBIDTA
3,008
2,556
17.7
4,944
(39.2)
17,335
17,761
(2.4)
EBITDA margin (%)
17.2
15.8
25.3
23.4
25.2
Interest
2
1
42.1
4
(62.3)
7
58
(87.4)
Depreciation
586
536
9.3
558
5.2
2,320
1,996
16.2
Other income
1,431
1,536
(6.8)
1,447
(1.1)
6,571
7,172
(8.4)
Exceptional items
25
5
414.6
(23)
(209.6)
5
1
254.6
Profit before tax
3,877
3,559
8.9
5,807
(33.2)
21,584
22,880
(5.7)
Margin (%)
22.2
22.0
29.8
29.1
32.4
Tax
1,333
1,367
(2.5)
2,043
(34.8)
7,857
7,768
1.2
% of PBT
34.4
38.4
35.2
36.4
34.0
Rep. Net income
2,544
2,192
16.0
3,764
(32.4)
13,727
15,112
(9.2)
Margin (%)
14.5
13.6
19.3
18.5
21.4
Adjusted net income
2,519
2,188
15.2
3,787
(33.5)
1,37,217
1,51,103
(9.2)
Source: Company, Angel Research
Exhibit 2: Consolidated - 2QFY2016 Actual vs Angel estimates
(` cr)
Actual
Estimates
Variation (%)
Net Sales
16,958
16,833
0.7
EBITDA
3,008
3,106
(3.2)
EBITDA margin (%)
17.2
17.9
(65bp)
Adjusted PAT
2,519
2,445
3.0
Source: Company, Angel Research
November 16, 2015
2
Coal India | 2QFY2016 Result Update
Result highlights
Higher E-auction volumes offset by lower realisation
Coal India’s total revenue increased 8.2% yoy to `16,958cr, in line with our
estimate of `16,833cr. While production was slightly below our estimate at
108.2MT for the quarter (vs. our estimate of 110.6MT), off-take volumes were
marginally ahead of our expectations at 121.8MT (our estimate was of 119.1MT).
Off-take was higher in the FSA segment with e-auction and washeries volumes in
line with expectations. FSA realizations were in line with expectations at `1,294/T.
However, e-auction realizations came in much lower than expected at `1,788. This
was partially offset by better than expected washeries realizations of `2,328.
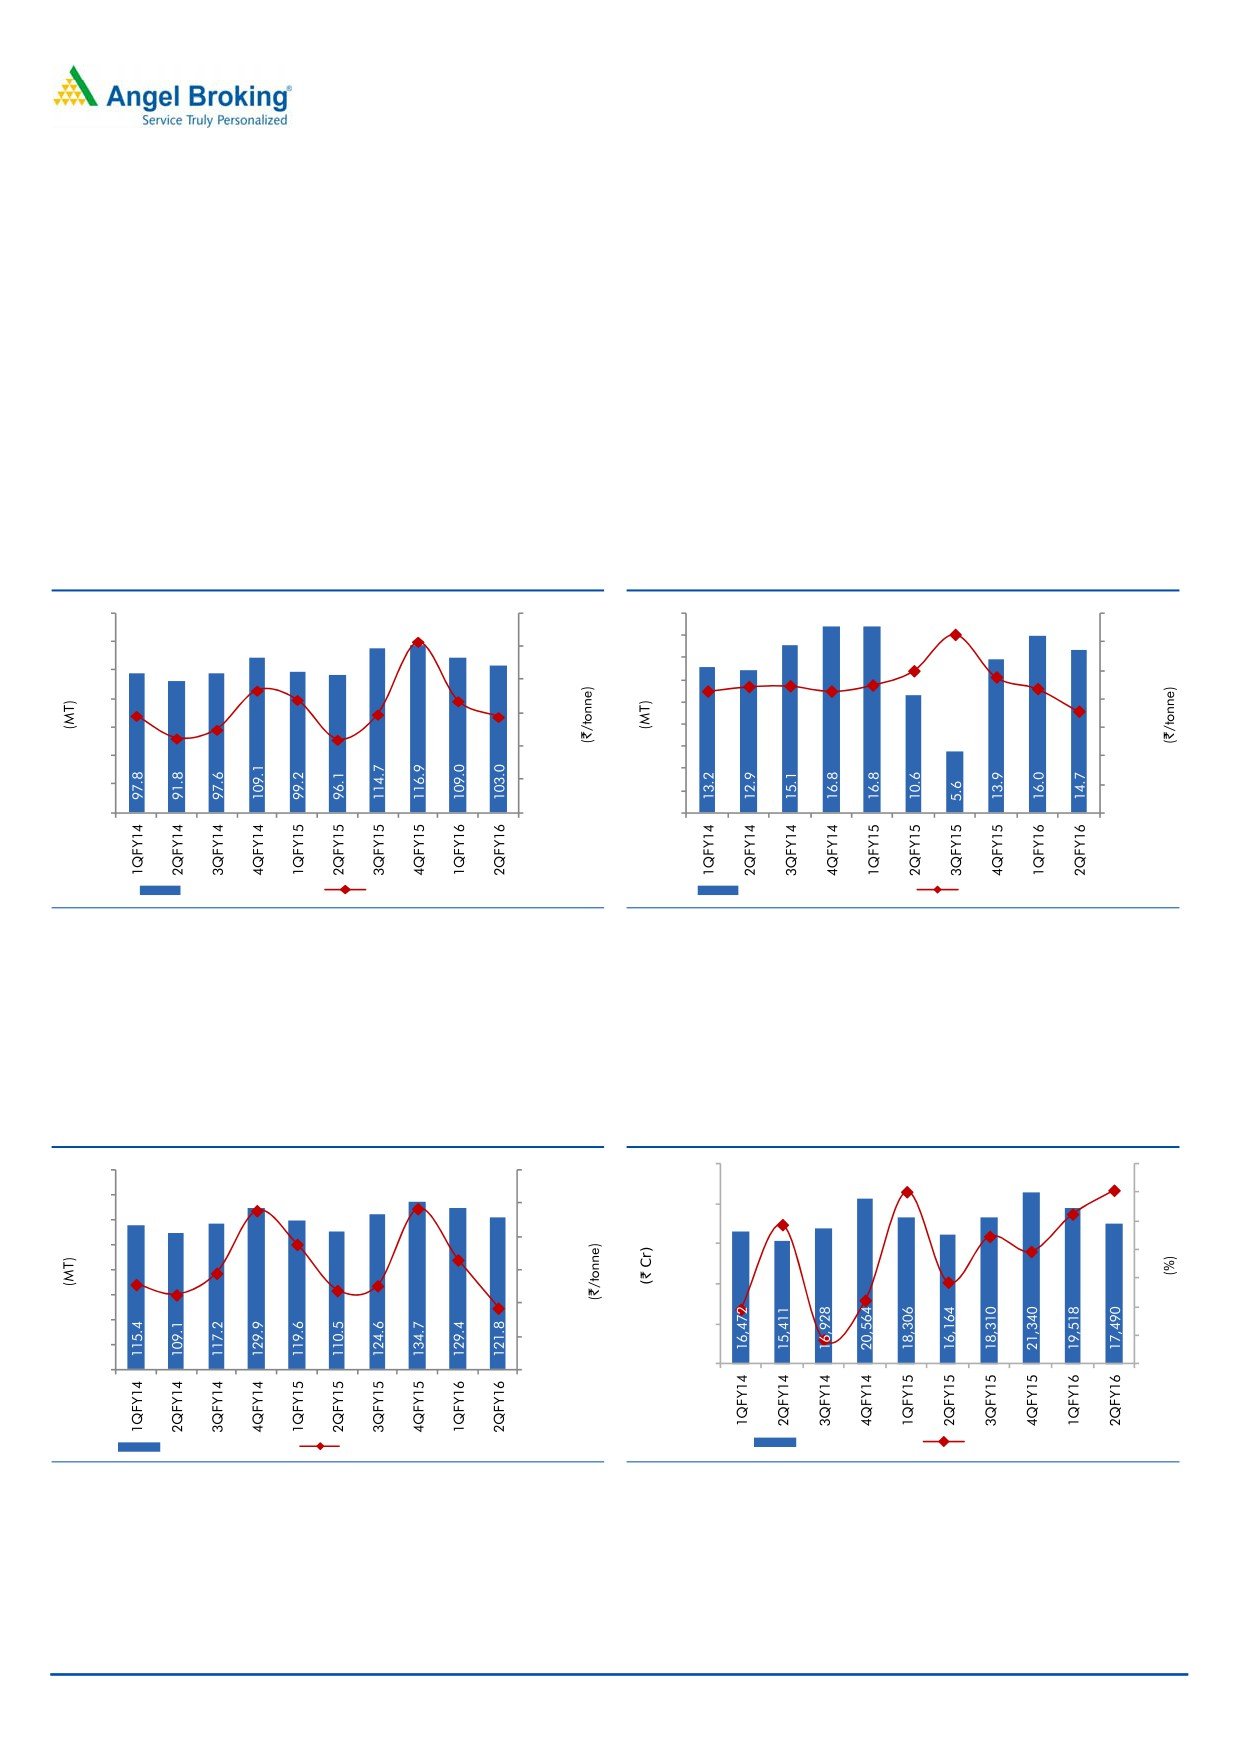
Exhibit 3: FSA volumes stable, realisation declines
Exhibit 4: E-auction volume in line with expectations
140
1,450
18
3,500
16
120
1,400
3,000
14
100
2,500
1,350
12
80
10
2,000
1,300
60
8
1,500
1,250
6
40
1,000
4
20
1,200
500
2
0
1,150
0
-
FSA Volumes (MT)
Realisation (`/tonne)
E-auction Volumes (MT)
Realisation (`/tonne)
Source: Company, Angel Research
Source: Company, Angel Research
Blended realization/tonne came in lower than our expectation at `1,392 (1.5%
lower than our estimate of `1,414), led by the sharply lower e-auction realisation.
Blended realisation declined 2% yoy, while off-take increased 10.2% yoy, resulting
in an 8.2% increase in net sales.
Exhibit 5: Off-take volume stable, realisation declines
Exhibit 6: Revenue growth picks up to 8.2%
25,000
10
160
1,600
140
8
1,550
20,000
120
6
1,500
100
15,000
4
80
1,450
10,000
2
60
1,400
0
40
5,000
1,350
-2
20
0
1,300
0
-4
Total Volumes (MT)
Blended Realisation (`/tonne)
Revenue (` cr)
yoy change (%)
Source: Company, Angel Research
Source: Company, Angel Research
November 16, 2015
3
Coal India | 2QFY2016 Result Update
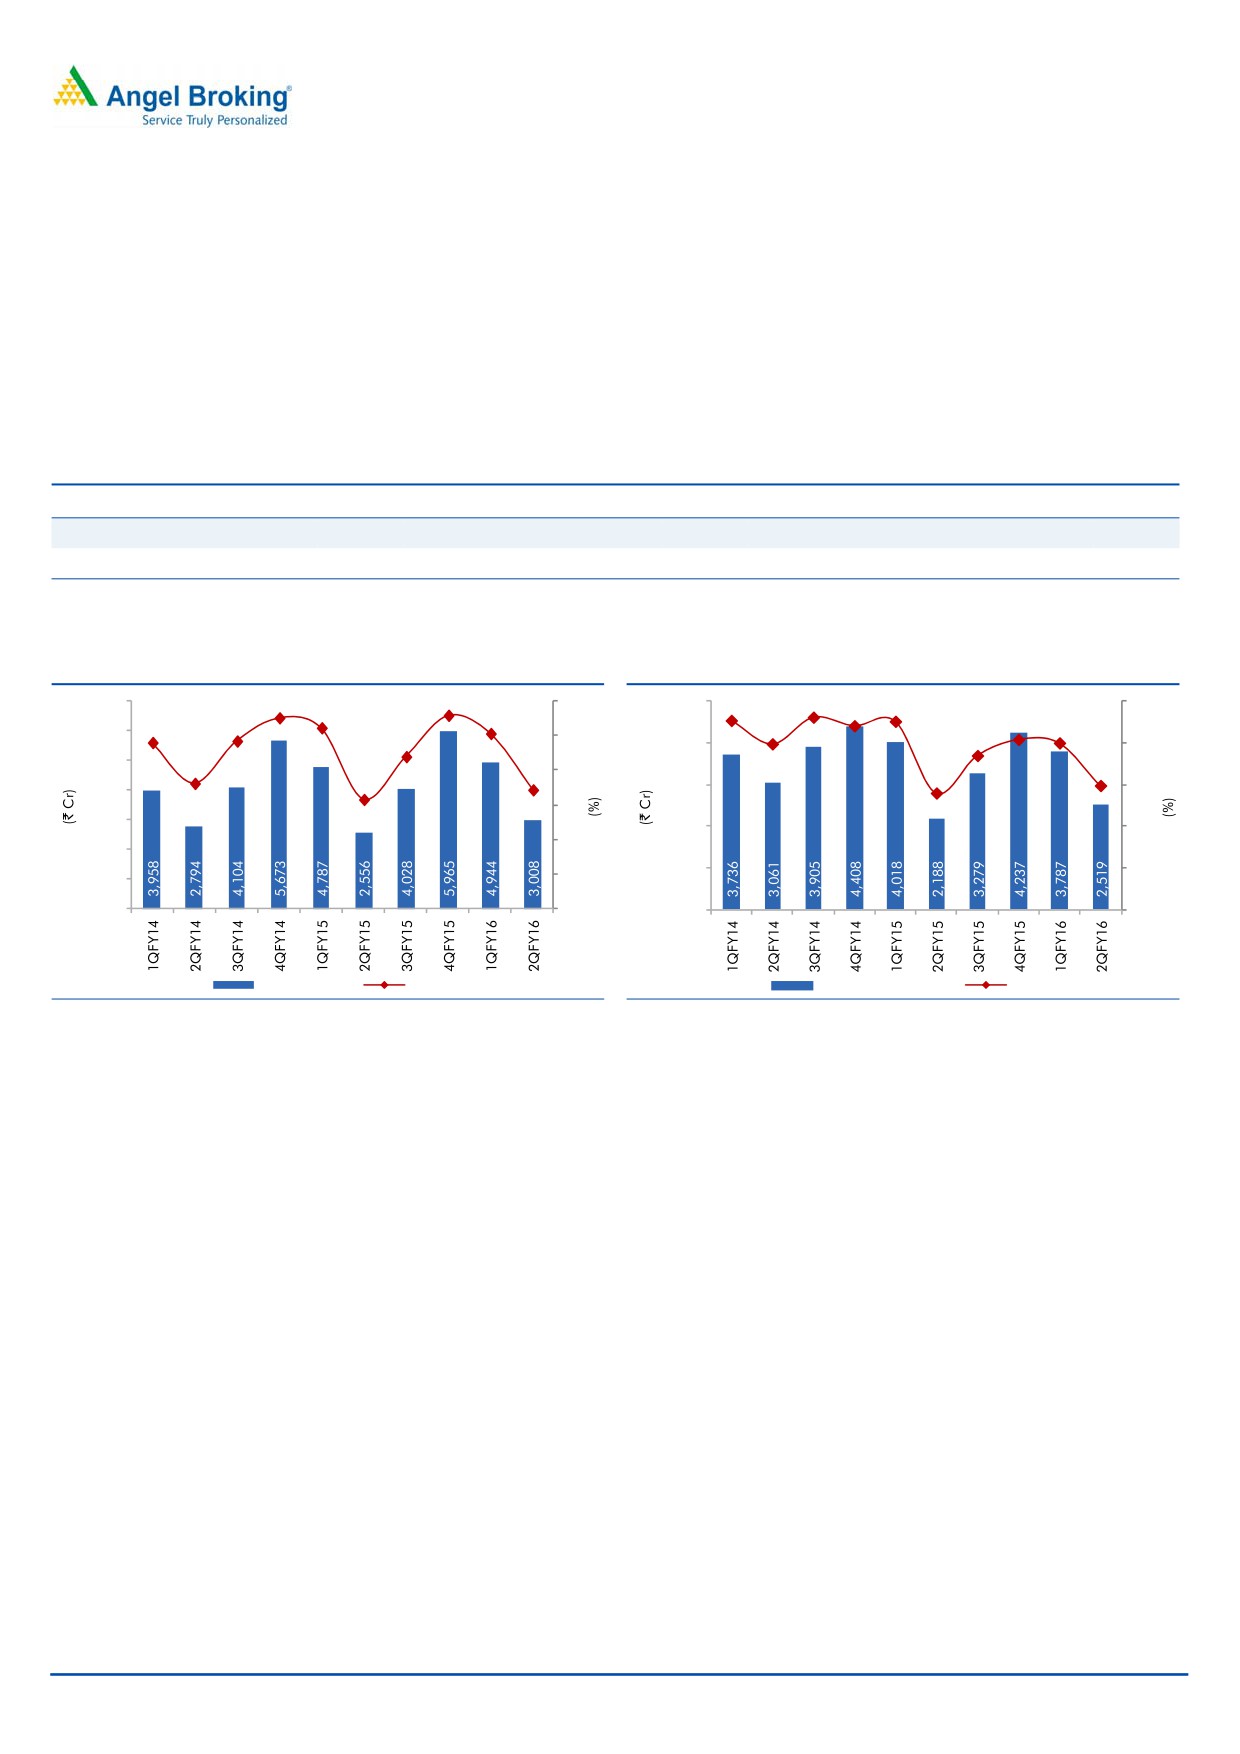
Higher expenses offset by lower material costs
Higher staff and other expenses offset lower than expected material and
overburden expenses resulting in an EBITDA of `3,008cr, as against our estimate
of `3,106cr. EBITDA margin improved 140bp to 17.2%, but was marginally lower
than our estimate of 17.9%. The Net profit at `2,544cr was slightly ahead of our
expectations (our estimate was of `2,445cr) led by lower than expected tax
expenses and marginally higher than expected other income.
Exhibit 7: Quarterly performance trend
1Q14
2Q14
3Q14
4Q14
1Q15
2Q15
3Q15
4Q15
1Q16
2Q16
Realisation (`/tonne)
1,428
1,412
1,445
1,539
1,488
1,419
1,426
1,542
1,465
1,392
EBITDA (`/tonne)
343
256
350
393
358
187
279
401
339
203
Source: Company, Angel Research
Exhibit 8: EBITDA margin improves 140bp yoy
Exhibit 9: Net profit improves 15% yoy
7,000
30
5,000
25
27.6
26.2
28.0
25.3
22.7
23.1
22.0
22.6
24.0
24.2
19.9
20.4
20.0
6,000
22.0
25
18.5
4,000
20
5,000
18.1
14.9
17.2
20
14.0
15.8
4,000
3,000
15
15
3,000
2,000
10
10
2,000
1,000
5
1,000
5
0
0
0
0
EBITDA (` cr)
Margin (%)
Net Profit (` cr)
Margin (%)
Source: Company, Angel Research
Source: Company, Angel Research
November 16, 2015
4
Coal India | 2QFY2016 Result Update
Investment arguments
Strong production growth to drive revenues
Coal India’s production increased ~7% yoy in FY2015 to 494MT, as against a
muted growth of 2.3% in FY2014. Off-take growth also picked up to 3.8% yoy in
FY2015 as against 1.4% in FY2014. According to the Coal Ministry, with rising
demand for power, demand for coal is estimated to increase to 1.6bn tonne by the
year FY2020. CIL has already finalised plans to achieve targeted production of
925MT by FY2020 and is planning to increase production to 1bn tonne. The target
production implies a ~13% CAGR growth in production over FY2015-20. We
believe the production growth target is a bit too optimistic and expect CIL’s
production to grow at a CAGR of ~8%.
Operating efficiencies and low realisations to help improve margins
CIL’s net realisation is significantly lower than the landed price of imported coal,
providing enough cushion against any decline in international coal prices. The gap
also provides ample scope for CIL to pass on any cost escalations. The increasing
share of washed coal will also help improve realizations. Further, technological
and infrastructural enhancements, coupled with operating efficiencies from rising
production will help to keep production costs low.
November 16, 2015
5
Coal India | 2QFY2016 Result Update
Outlook and valuation
We reduce our consolidated FY2016 and FY2017 EPS estimates by 12% and 9%,
respectively, in view of the lower than expected realizations and increased
operating expenses. We expect CIL’s production to increase by 7.1% to 530MT in
FY2016 (538MT earlier) and 572MT in FY2017 (575MT earlier). We expect e-
auction realization to remain under pressure led by weakness in global commodity
prices and increased availability of coal in FY2016.
We value Coal India at 8x FY2017E Adj. EBITDA to arrive at a target price of `380
(`400 earlier) and retain our Accumulate rating on the stock.
Exhibit 10: Valuation
EV/EBITDA
(` cr)
FY2017E Adj. EBITDA
23,545
Multiple (x)
8.0
Total EV
1,89,299
Net Cash
50,375
Minority Interest
66
Equity Value
2,39,609
Target price (`)
380
Source: Angel Research
Company background
Incorporated in 1973, Coal India Ltd (CIL) is a ‘Maharatna’ company under the
Ministry of Coal, Government of India and is the single largest coal producing
company in the world with reserves of 65bn tonne. CIL accounts for ~80% of
India's overall coal production and commands ~74% of the Indian coal market.
The company produced 494MT and dispatched 489MT of raw coal in FY2015. At
the end of FY2015, CIL had 430 mines (227 underground, 175 opencast and 28
mixed mines) and 15 coal washeries (12 coking coal and 3 non-coking coal).
November 16, 2015
6
Coal India | 2QFY2016 Result Update
Profit & Loss Statement (Consolidated)
Y/E March (` cr)
FY2013
FY2014
FY2015
FY2016E
FY2017E
Net Sales
68,303
68,810
72,015
76,167
84,130
% chg
9.4
0.7
4.7
5.8
10.5
Total Expenditure
50,219
52,847
56,785
61,034
65,369
Raw Material Expenses
6,556
7,115
6,726
8,656
9,618
Personnel
27,321
27,769
29,859
30,944
32,881
Power & Fuel Cost
2,333
2,282
2,347
2,551
2,817
Other Expenses
14,009
15,681
17,853
18,884
20,053
EBITDA
18,084
15,963
15,230
15,133
18,761
% chg
15.4
(11.7)
(4.6)
(0.6)
24.0
(% of Net Sales)
26.5
23.2
21.1
19.9
22.3
Depreciation
1,813
1,996
2,320
2,479
2,708
EBIT
16,271
13,967
12,910
12,654
16,053
% chg
18.8
(14.2)
(7.6)
(2.0)
26.9
(% of Net Sales)
23.8
20.3
17.9
16.6
19.1
Interest & other Charges
45
58
7
9
10
Other Income
8,747
8,969
8,676
8,584
8,413
(% of PBT)
35.0
39.2
40.2
40.4
34.4
Recurring PBT
24,972
22,878
21,579
21,230
24,456
% chg
17.9
(8.4)
(5.7)
(1.6)
15.2
Extraordinary Inc/(Expense)
7
1
5
2
0
PBT (reported)
24,979
22,880
21,584
21,232
24,456
Tax
7,623
7,768
7,857
7,069
8,143
(% of PBT)
30.5
34.0
36.4
33.3
33.3
PAT (reported)
17,356
15,112
13,727
14,163
16,314
Add: Share of earnings of asso.
-
-
-
-
-
Less: Minority interest (MI)
-
0.0
0.1
0.1
0.1
Extraordinary (Expense)/Inc.
(0.0)
(0.0)
(0.0)
(0.0)
(0.0)
PAT after MI (reported)
17,356
15,112
13,727
14,163
16,314
Adjusted PAT
17,350
15,110
13,722
14,161
16,314
% chg
18.0
(12.9)
(9.2)
3.2
15.2
(% of Net Sales)
25.4
22.0
19.1
18.6
19.4
November 16, 2015
7
Coal India | 2QFY2016 Result Update
Balance Sheet (Consolidated)
Y/E March (` cr)
FY2013
FY2014
FY2015
FY2016E FY2017E
SOURCES OF FUNDS
Equity Share Capital
6,316
6,316
6,316
6,316
6,316
Reserves & Surplus
42,156
36,088
34,037
32,903
33,921
Shareholders Funds
48,472
42,404
40,353
39,220
40,237
Minority Interest
64
64
66
66
66
Total Loans
1,078
171
202
202
202
Other Long Term liabilities
3,137
3,529
3,999
4,230
4,672
Long term provisions
31,144
33,639
37,499
39,661
43,807
Total Liabilities
83,895
79,807
82,119
83,378
88,984
APPLICATION OF FUNDS
Gross Block
39,011
40,897
44,987
49,036
53,694
Less: Acc. Depreciation
25,545
26,302
28,622
31,101
33,809
Net Block
13,466
14,595
16,365
17,935
19,885
Capital Work-in-Progress
3,496
4,505
4,910
5,431
5,820
Goodwill
-
-
-
-
-
Investments
2,395
3,775
2,813
2,813
2,813
Other
1,256
1,756
2,641
2,794
3,086
Current Assets
87,429
77,639
78,767
78,938
84,070
Cash
62,236
52,390
50,007
48,413
50,577
Loans & Advances
4,920
6,596
8,827
9,336
10,312
Other
20,273
18,654
19,933
21,189
23,181
Current liabilities
26,401
24,435
25,337
26,492
28,651
Net Current Assets
61,028
53,204
53,430
52,446
55,420
Net deferred tax assets
2,255
1,972
1,960
1,960
1,960
Total Assets
83,895
79,807
82,119
83,378
88,984
November 16, 2015
8
Coal India | 2QFY2016 Result Update
Cash flow statement (Consolidated)
Y/E March (` cr)
FY2013
FY2014
FY2015
FY2016E FY2017E
Profit before tax
24,979
22,880
21,584
21,232
24,456
Depreciation
1,839
1,996
2,320
2,479
2,708
Change in Working Capital
(6,839)
244
(2,609)
(609)
(810)
Others
(2,218)
(1,769)
1,916
2,249
4,306
Direct taxes paid
(8,652)
(8,826)
(7,857)
(7,069)
(8,143)
Cash Flow from Operations
9,109
14,525
15,354
18,282
22,518
(Inc.)/ Dec. in Fixed Assets
(2,454)
(4,116)
(4,494)
(4,570)
(5,048)
(Inc.)/ Dec. in Investments
4,195
(8,981)
2,031
-
-
Others
1,035
14,076
-
-
-
Cash Flow from Investing
2,776
979
(2,463)
(4,570)
(5,048)
Issue of Equity
-
-
-
-
-
Inc./(Dec.) in loans
(229)
(1,263)
30
-
-
Dividend Paid (Incl. Tax)
(7,907)
(24,243)
(15,296)
(15,296)
(15,296)
Others
284
156
(7)
(9)
(10)
Cash Flow from Financing
(7,852)
(25,350)
(15,273)
(15,305)
(15,306)
Inc./(Dec.) in Cash
4,033
(9,846)
(2,383)
(1,593)
2,164
Opening Cash balances
58,203
62,236
52,390
50,007
48,413
Closing Cash balances
62,236
52,390
50,007
48,413
50,577
November 16, 2015
9
Coal India | 2QFY2016 Result Update
Key ratios
Y/E March
FY2013
FY2014
FY2015
FY2016E
FY2017E
Valuation Ratio (x)
P/E (on FDEPS)
12.3
14.1
15.5
15.1
13.1
P/CEPS
11.1
12.5
13.3
12.8
11.2
P/BV
4.4
5.0
5.3
5.4
5.3
Dividend yield (%)
4.1
8.6
6.1
6.1
6.1
EV/Sales
1.8
2.3
2.2
2.1
1.9
EV/Adj. EBITDA
5.9
8.2
8.4
9.2
7.5
EV/Total Assets
1.5
2.0
2.0
1.9
1.8
Per Share Data (`)
EPS (Basic)
27.5
23.9
21.7
22.4
25.8
EPS (fully diluted)
27.5
23.9
21.7
22.4
25.8
Cash EPS
30.3
27.1
25.4
26.3
30.1
DPS
14.0
29.0
20.7
20.7
20.7
Book Value
76.7
67.1
63.9
62.1
63.7
Returns (%)
ROCE (Pre-tax)
22.0
17.1
15.9
15.3
18.6
ROE
39.0
33.2
33.1
35.5
41.0
Turnover ratios (x)
Asset Turnover (Gross Block)
1.8
1.7
1.6
1.6
1.6
Inventory (days)
41
38
40
40
40
Receivables (days)
56
44
43
43
43
Payables (days)
6
6
6
6
6
WC cycle (ex-cash) (days)
70
75
68
68
67
Solvency ratios (x)
Net debt to equity
(1.3)
(1.3)
(1.3)
(1.3)
(1.3)
Net debt to EBITDA
(2.9)
(3.5)
(3.5)
(3.4)
(2.8)
Interest Coverage (EBIT / Int.)
360.2
240.8
1,763.7
1,473.1
1,642.6
November 16, 2015
10
Coal India | 2QFY2016 Result Update
Research Team Tel: 022 - 39357800
DISCLAIMER
Angel Broking Private Limited (hereinafter referred to as “Angel”) is a registered Member of National Stock Exchange of India Limited,
Bombay Stock Exchange Limited and Metropolitan Stock Exchange of India Limited. It is also registered as a Depository Participant with
CDSL and Portfolio Manager with SEBI. It also has registration with AMFI as a Mutual Fund Distributor. Angel Broking Private Limited is
a registered entity with SEBI for Research Analyst in terms of SEBI (Research Analyst) Regulations, 2014 vide registration number
INH000000164. Angel or its associates has not been debarred/ suspended by SEBI or any other regulatory authority for accessing
/dealing in securities Market. Angel or its associates including its relatives/analyst do not hold any financial interest/beneficial
ownership of more than 1% in the company covered by Analyst. Angel or its associates/analyst has not received any compensation /
managed or co-managed public offering of securities of the company covered by Analyst during the past twelve months. Angel/analyst
has not served as an officer, director or employee of company covered by Analyst and has not been engaged in market making activity
of the company covered by Analyst.
This document is solely for the personal information of the recipient, and must not be singularly used as the basis of any investment
decision. Nothing in this document should be construed as investment or financial advice. Each recipient of this document should
make such investigations as they deem necessary to arrive at an independent evaluation of an investment in the securities of the
companies referred to in this document (including the merits and risks involved), and should consult their own advisors to determine
the merits and risks of such an investment.
Reports based on technical and derivative analysis center on studying charts of a stock's price movement, outstanding positions and
trading volume, as opposed to focusing on a company's fundamentals and, as such, may not match with a report on a company's
fundamentals.
The information in this document has been printed on the basis of publicly available information, internal data and other reliable
sources believed to be true, but we do not represent that it is accurate or complete and it should not be relied on as such, as this
document is for general guidance only. Angel Broking Pvt. Limited or any of its affiliates/ group companies shall not be in any way
responsible for any loss or damage that may arise to any person from any inadvertent error in the information contained in this report.
Angel Broking Pvt. Limited has not independently verified all the information contained within this document. Accordingly, we cannot
testify, nor make any representation or warranty, express or implied, to the accuracy, contents or data contained within this document.
While Angel Broking Pvt. Limited endeavors to update on a reasonable basis the information discussed in this material, there may be
regulatory, compliance, or other reasons that prevent us from doing so.
This document is being supplied to you solely for your information, and its contents, information or data may not be reproduced,
redistributed or passed on, directly or indirectly.
Neither Angel Broking Pvt. Limited, nor its directors, employees or affiliates shall be liable for any loss or damage that may arise from
or in connection with the use of this information.
Note: Please refer to the important ‘Stock Holding Disclosure' report on the Angel website (Research Section). Also, please refer to the
latest update on respective stocks for the disclosure status in respect of those stocks. Angel Broking Pvt. Limited and its affiliates may
have investment positions in the stocks recommended in this report.
Disclosure of Interest Statement
Coal India
1. Analyst ownership of the stock
No
2. Angel and its Group companies ownership of the stock
No
3. Angel and its Group companies' Directors ownership of the stock
Yes
4. Broking relationship with company covered
No
Note: We have not considered any Exposure below ` 1 lakh for Angel, its Group companies and Directors
Ratings (Based on expected returns
Buy (> 15%)
Accumulate (5% to 15%)
Neutral (-5 to 5%)
over 12 months investment period):
Reduce (-5% to -15%)
Sell (< -15)
November 16, 2015
11